This
week we have at least seen some volatility come back to the market and this
chart still has some downside before we can buy it with confidence.
This
correction remains far from over and could take a good few weeks, if not
months, to complete.
I
am now of the opinion that one should use the volatility to play the ranges and
gain confidence as holding a net long after last weeks Q4 stocks report might
just weigh heavy on the mind and the pocket!
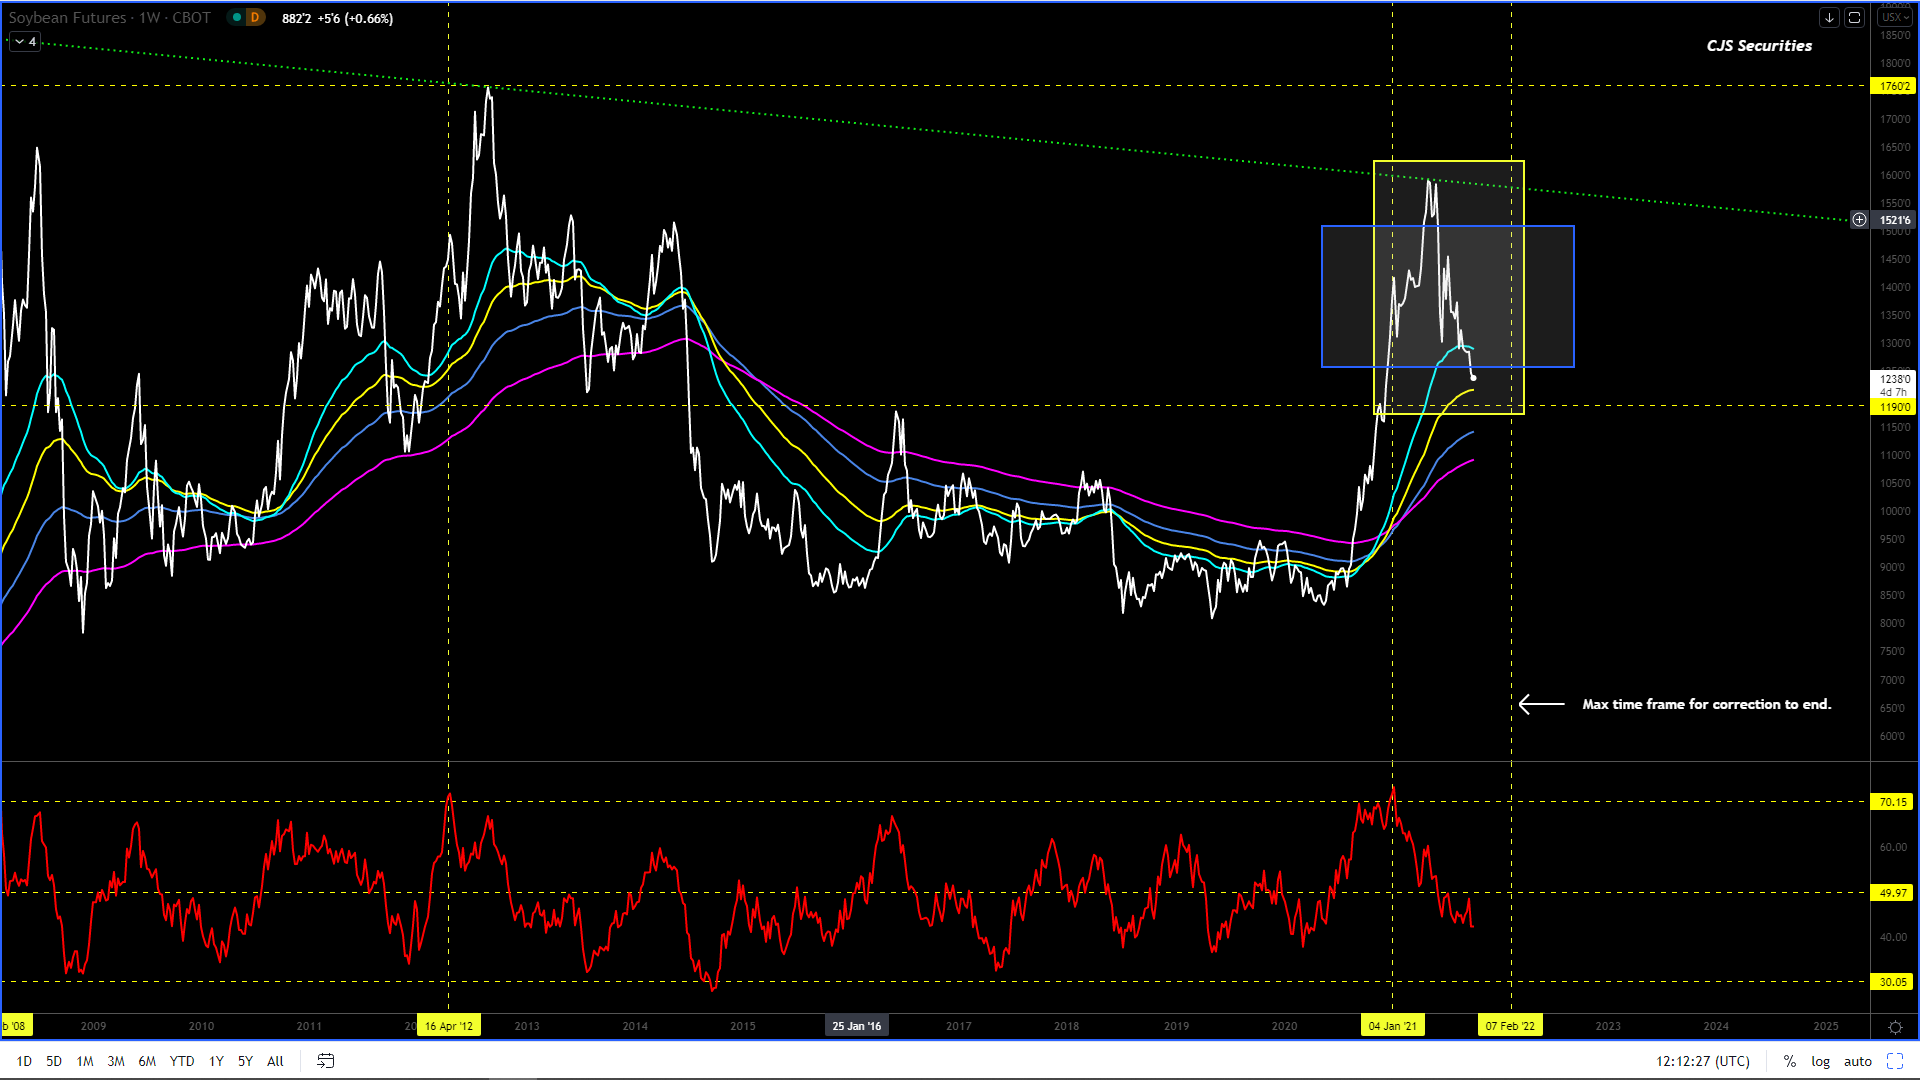
My
new downside target is sub $12.00and potentially $11.70,
this would be a massive MT buying opportunity to say the least.
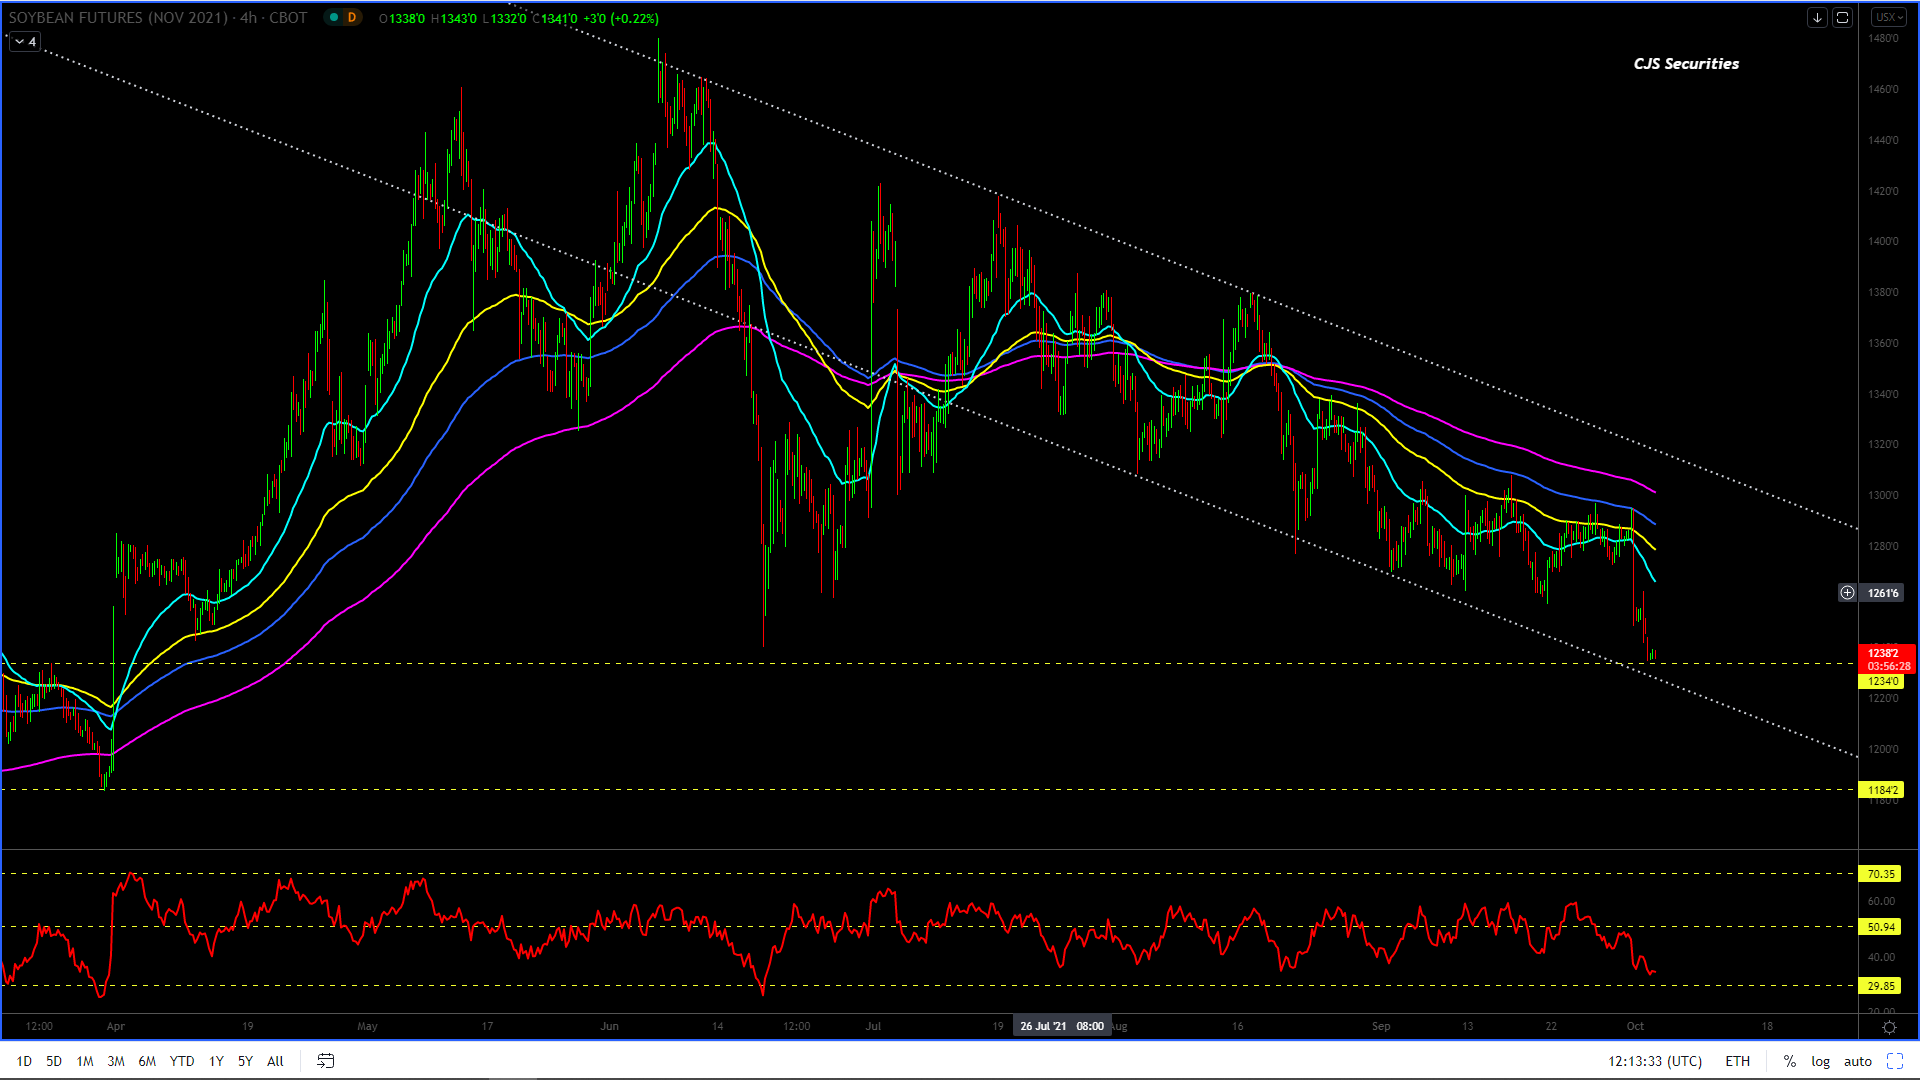
240 Min CBOT November 21 Soybean Candle Chart
This chart looks shocking and thinking it can rally hard off currently levels is like hoping the Cape will get independence.
I would sell any hard rally as a move sub $12.00 in the coming weeks, but note that sub $12.00 I would want to own it all week long and twice on a Sunday.
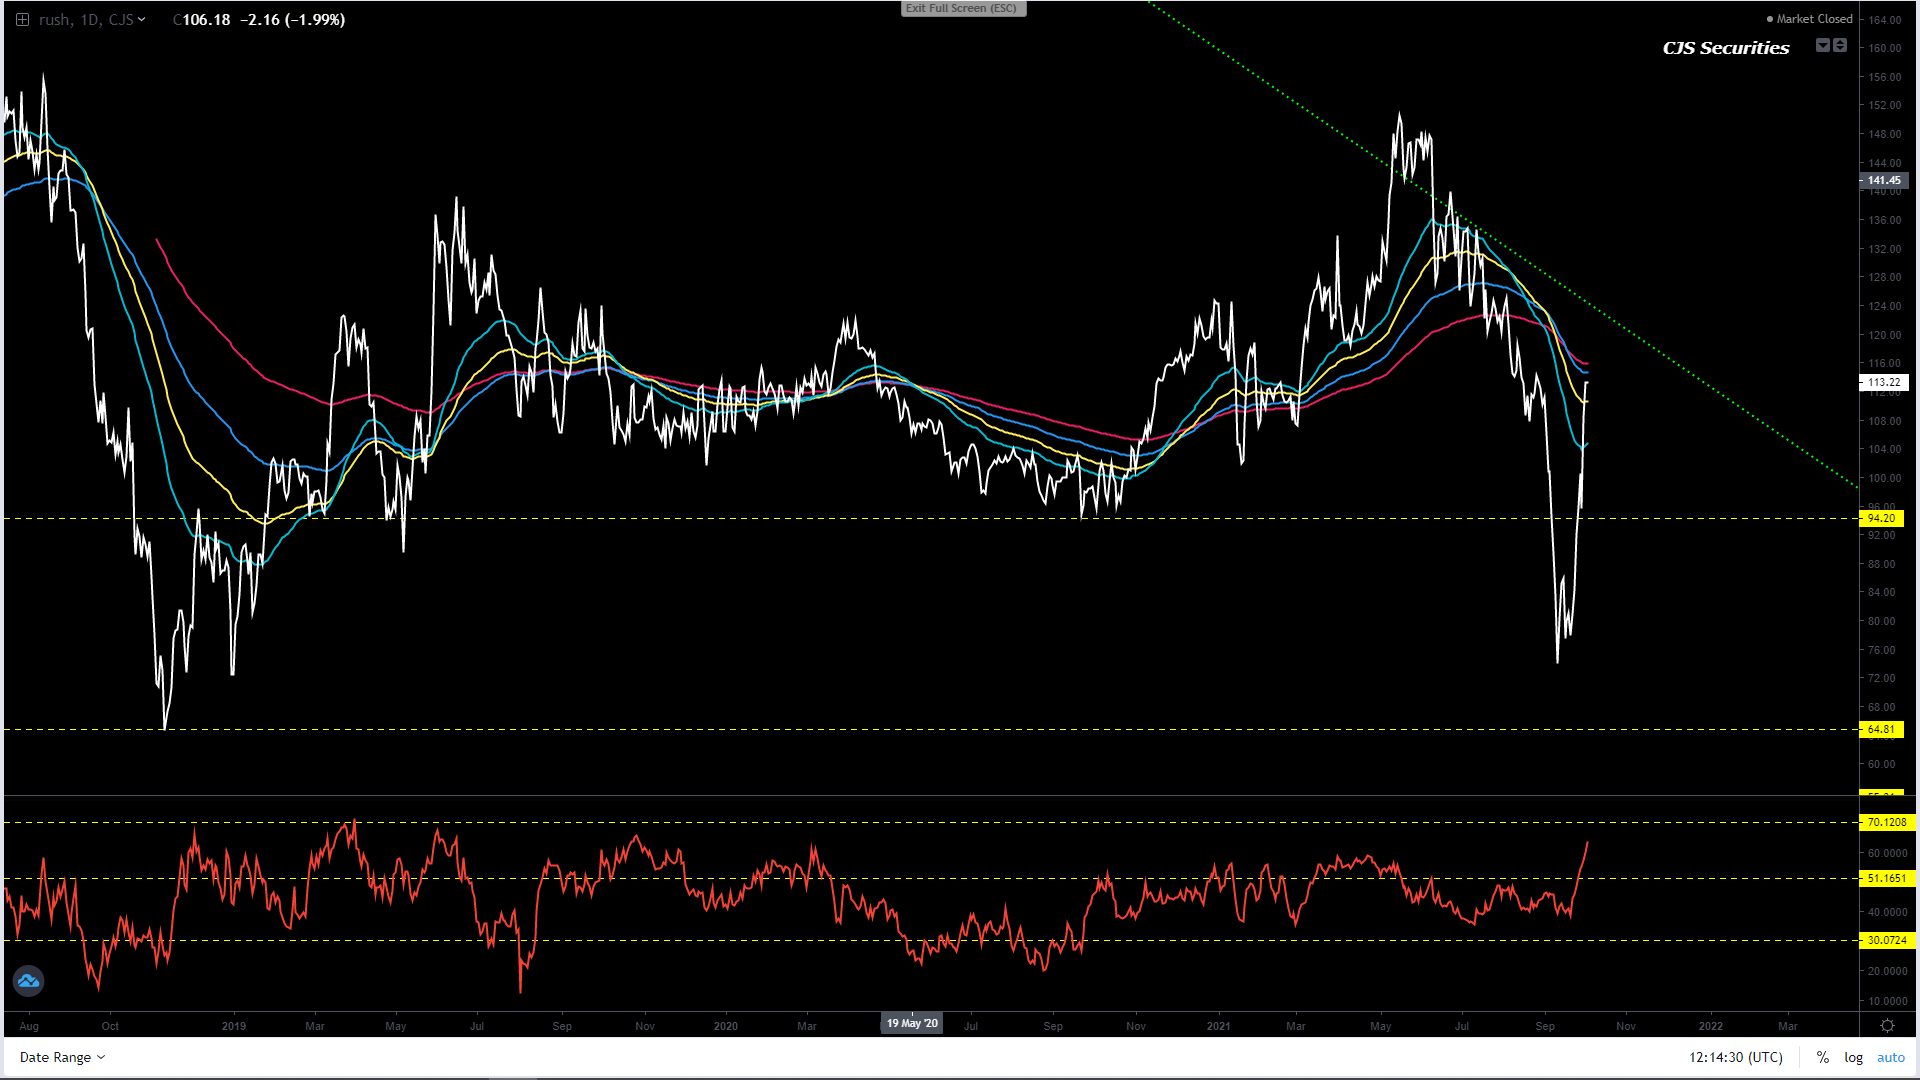
Board Crush Continuous Daily Close
This chart can take you to the cleaners and return your dirty!
I would stay out until further notice.
The price action now feels binary!
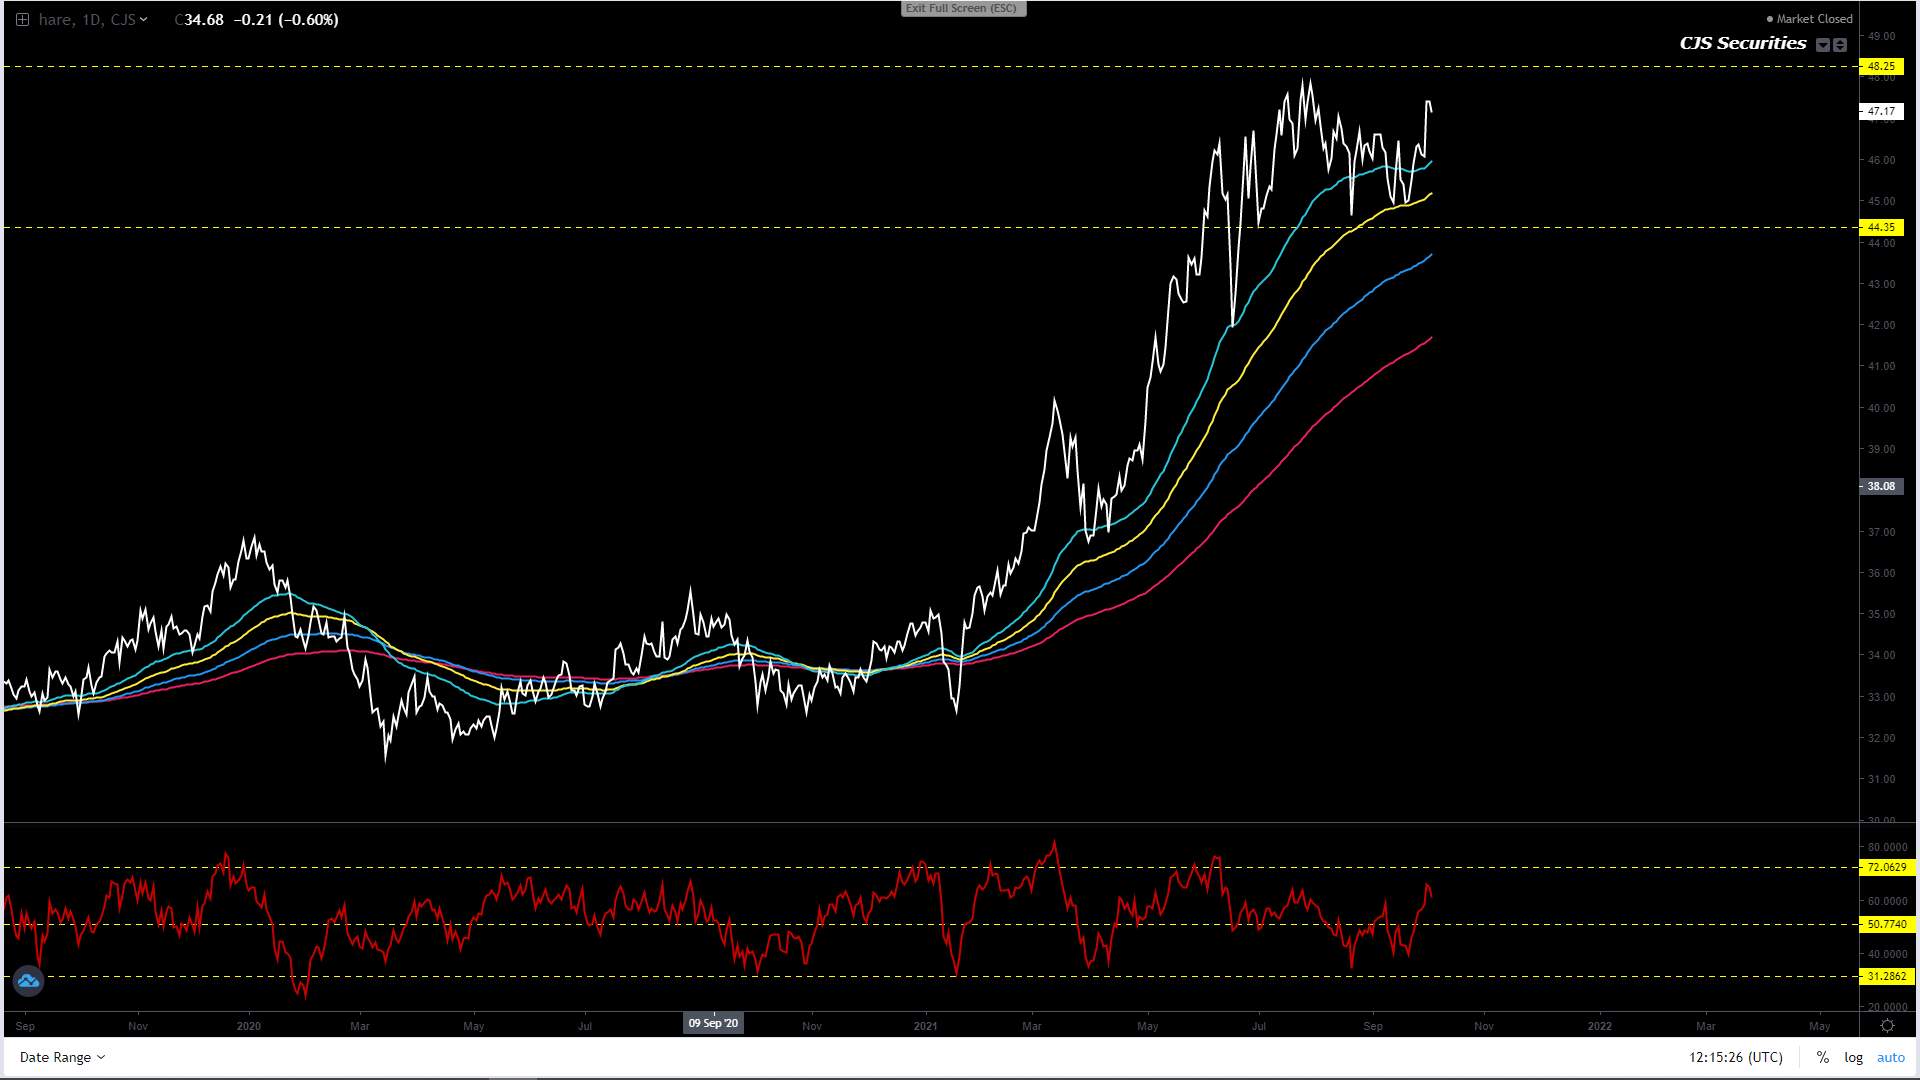
Oil Share Continuous Daily Close
The below view is playing out for now!
We are bullish and long but will put in a stop loss under 44%.
Weekly SAF Soy Continuous Close
#No Change in commentary.
We
are looking to buy this chart further into weakness and are “hoping” (which has
no place in trading) that this chart still prints R7000
in the coming weeks.
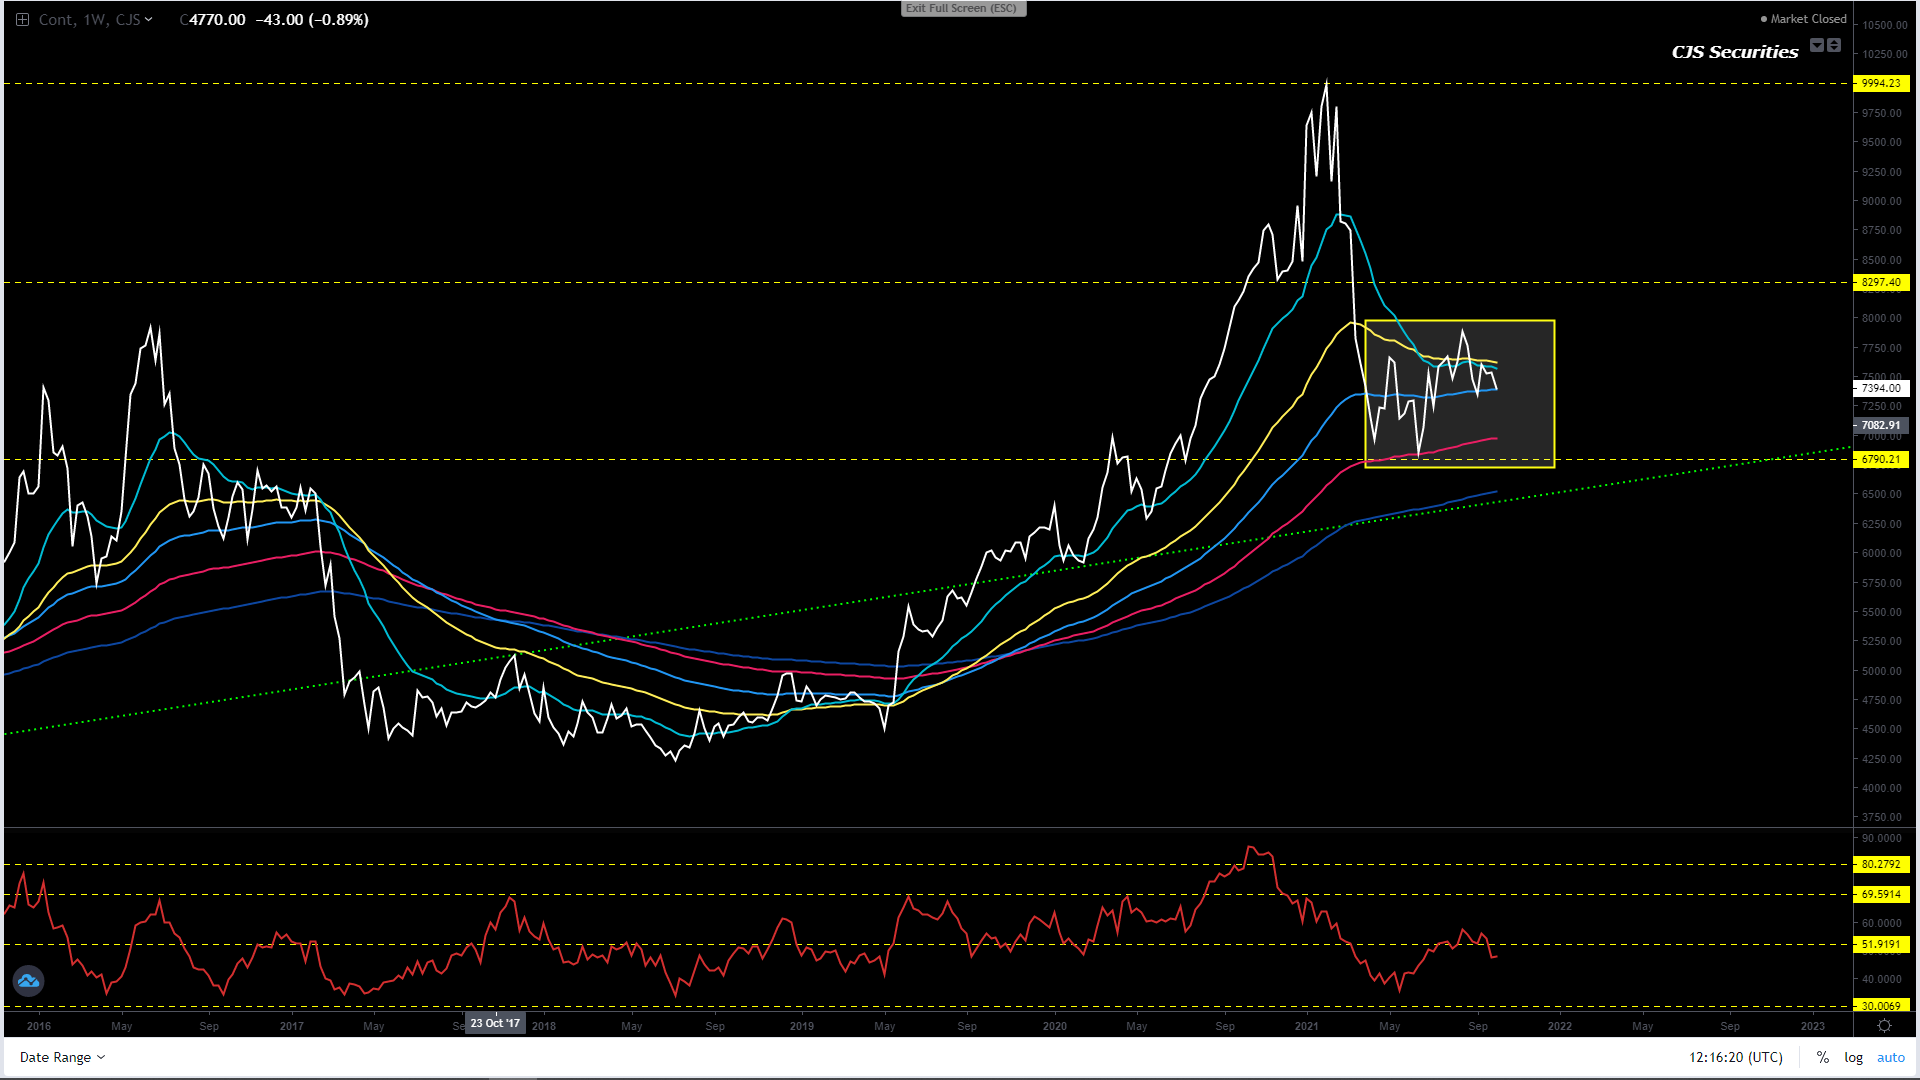
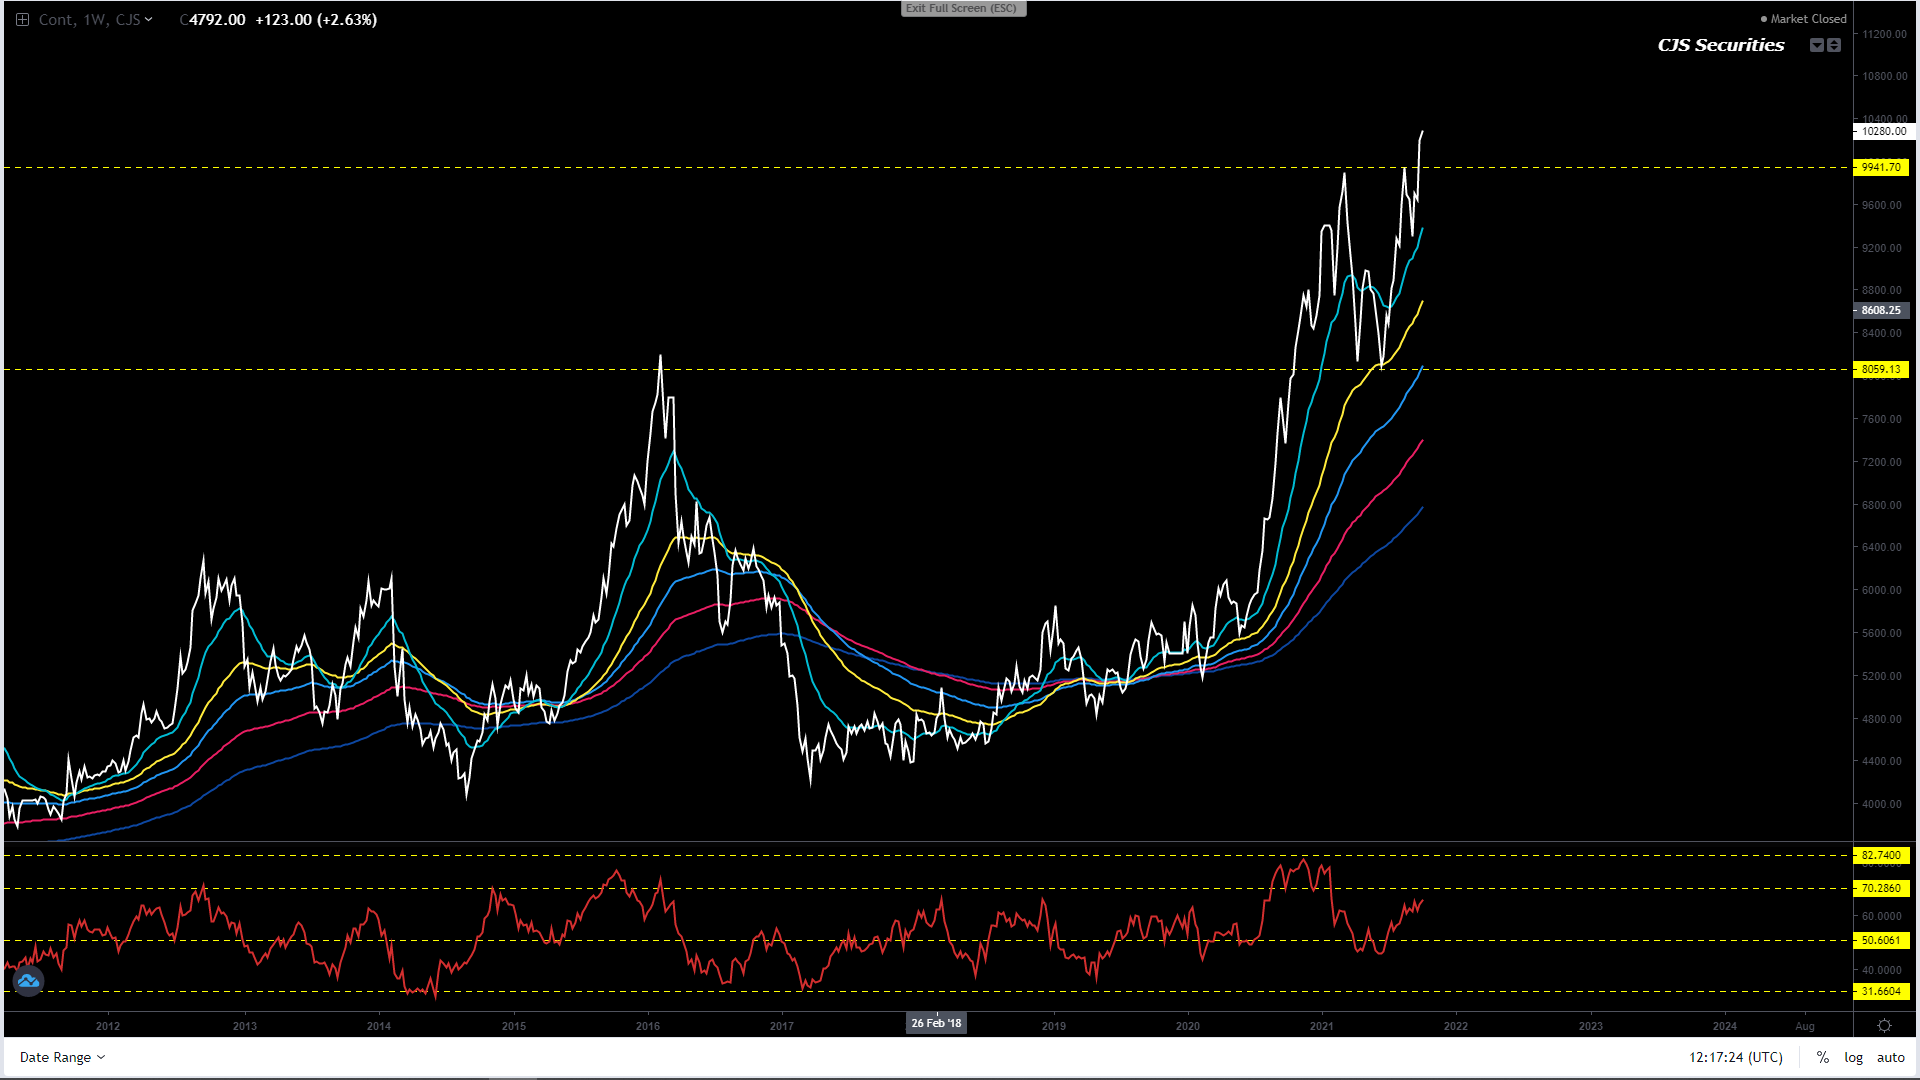
Weekly SAF Suns Continuous Close
The weekly double tops have been negated, all pullbacks are buying opportunities, as the bull market is far from over and over the next 8 weeks R11 000 – R12 000 could print just based on shorts that might be a little too clever!
“I would buy scale down from R9550. – this is aging pretty well for now.” – this month old view is aging like Riaan Cruywagen!
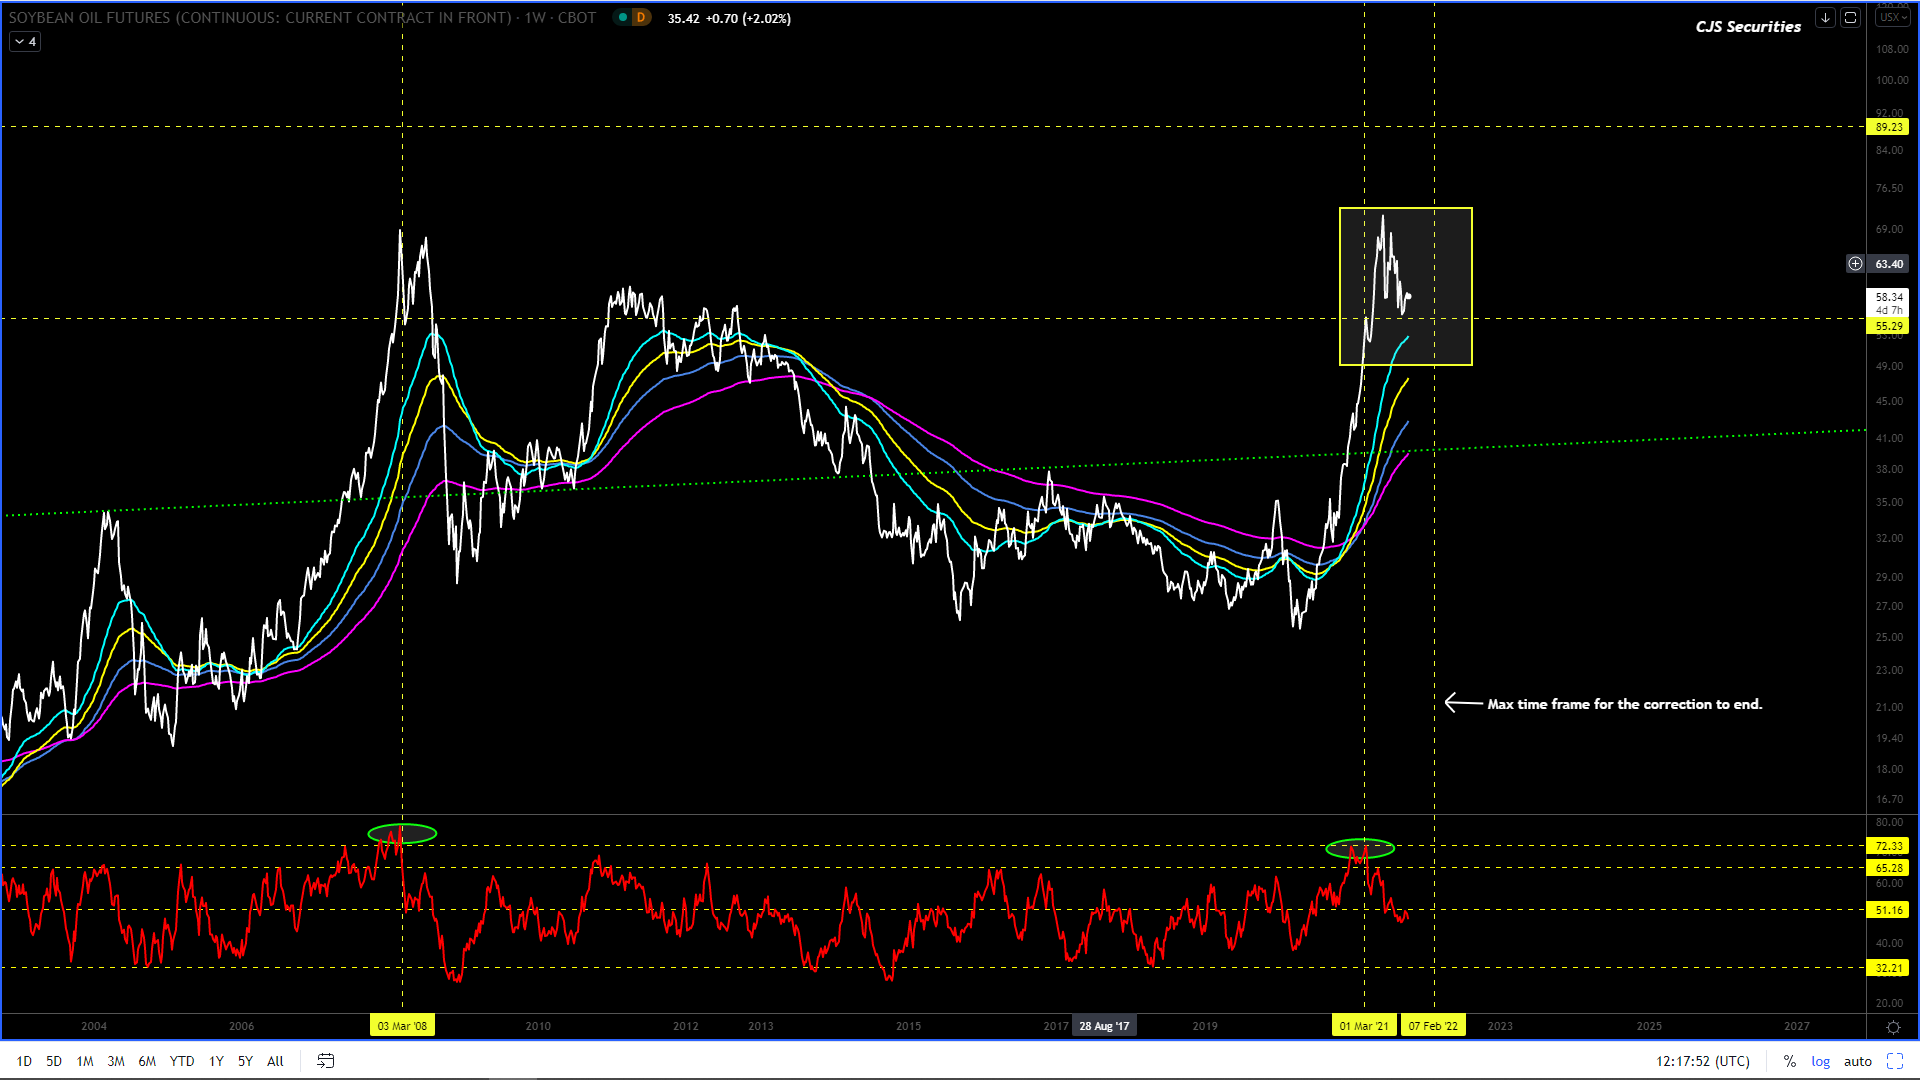
Weekly CBOT Soy Oil Continuous Close
#No Change in Commentary
I am super bullish and starting to wonder if the energy / power issues in China will transpire as the trigger for the below number to play out?
I feel the correction is done, (I feel good about this one) and all the pullbacks from here are buying opportunities with upside targets between $0.85 -$0.89!
I almost feel that we don’t have enough cash to get as long as we should, buy at best and scale down, this is budget making stuff with sprinkling of retirement!!!!
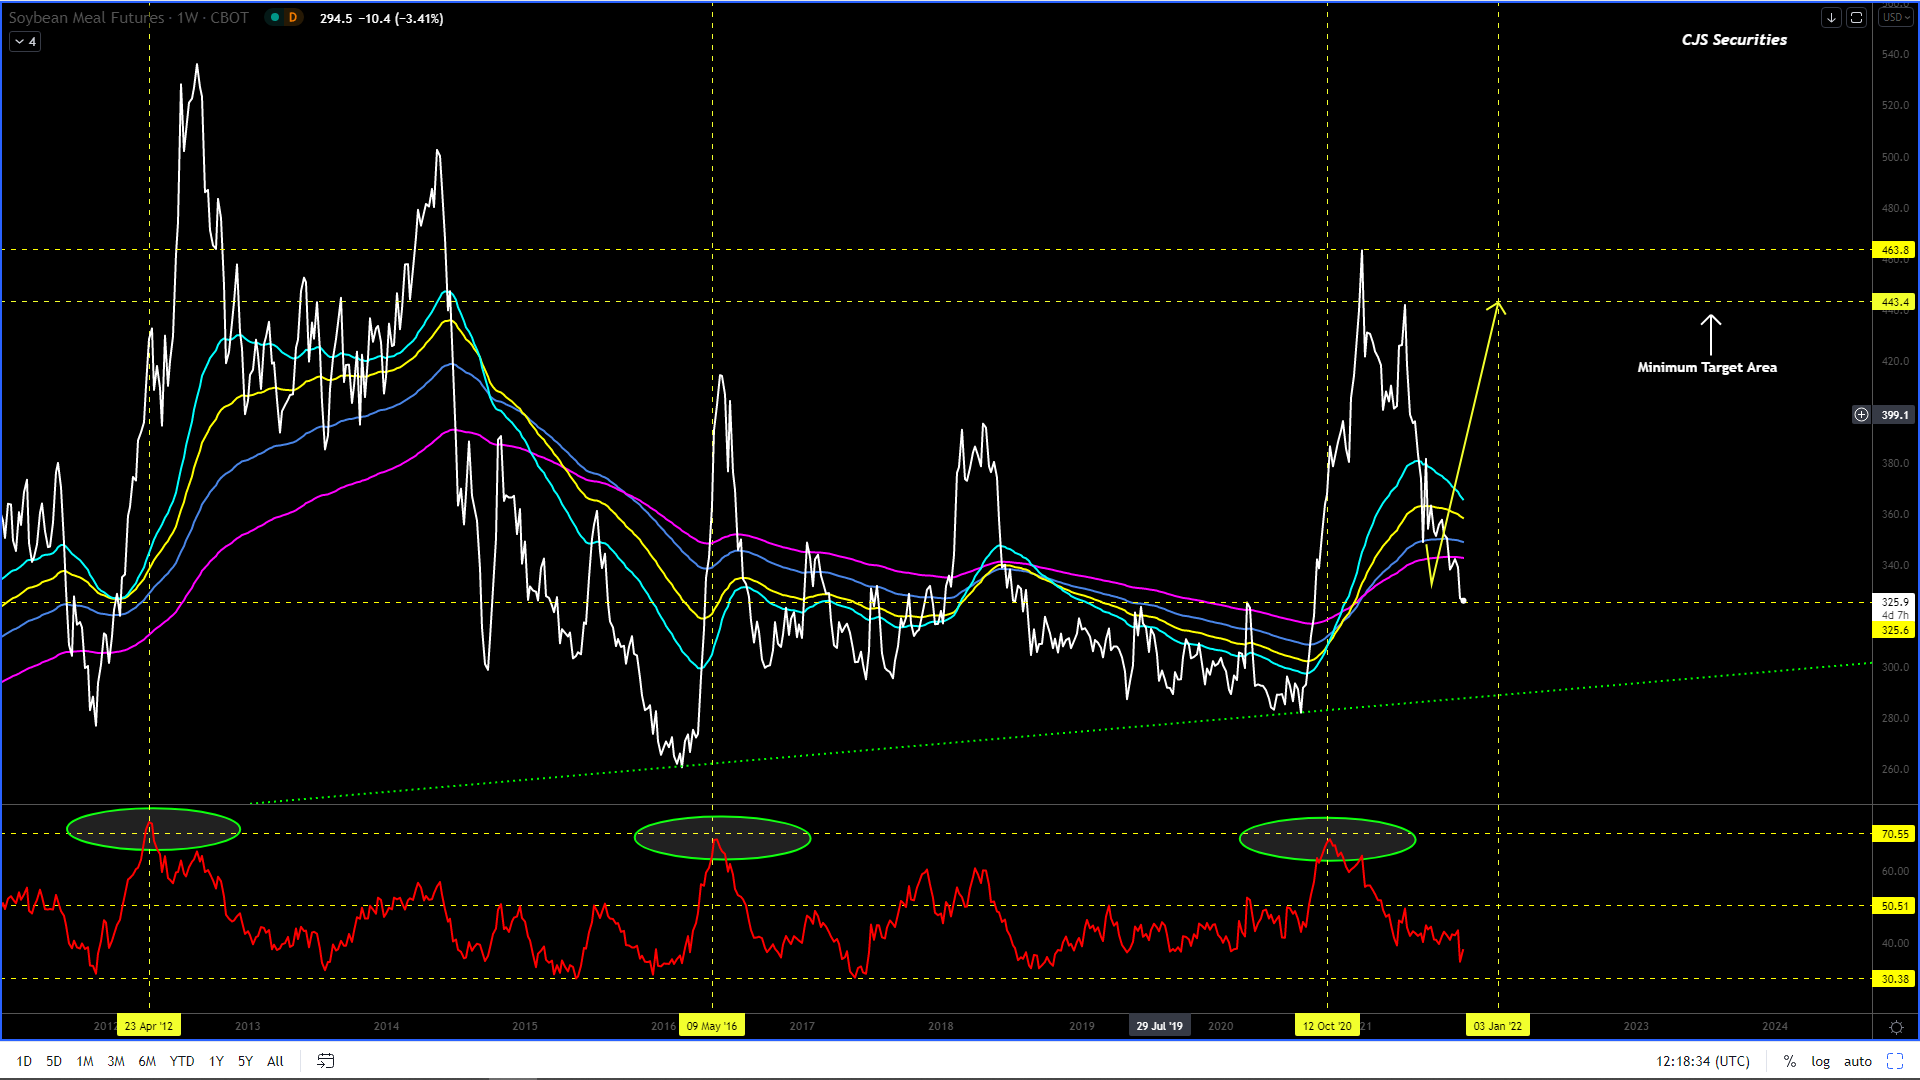
Weekly CBOT SBM Continuous Close
I
am now starting to feel like I have Stockholm syndrome.
After
this week I am packing my bags and leaving, In hope.
In
all seriousness though this chart is currently very unfriendly and the $325level will
need to hold if this chart has any chance of rallying.