Good
afternoon and blessings for 2022 where I would like us all to adopt the theme
“Patience” for the year.
It
has been five weeks since we last communicated, but congratulations to all the
longs that made a small killing!
This
chart is still bullish and has upside yet before looking to correct.
Look
to the $15.00level
to provide some very decent resistance!
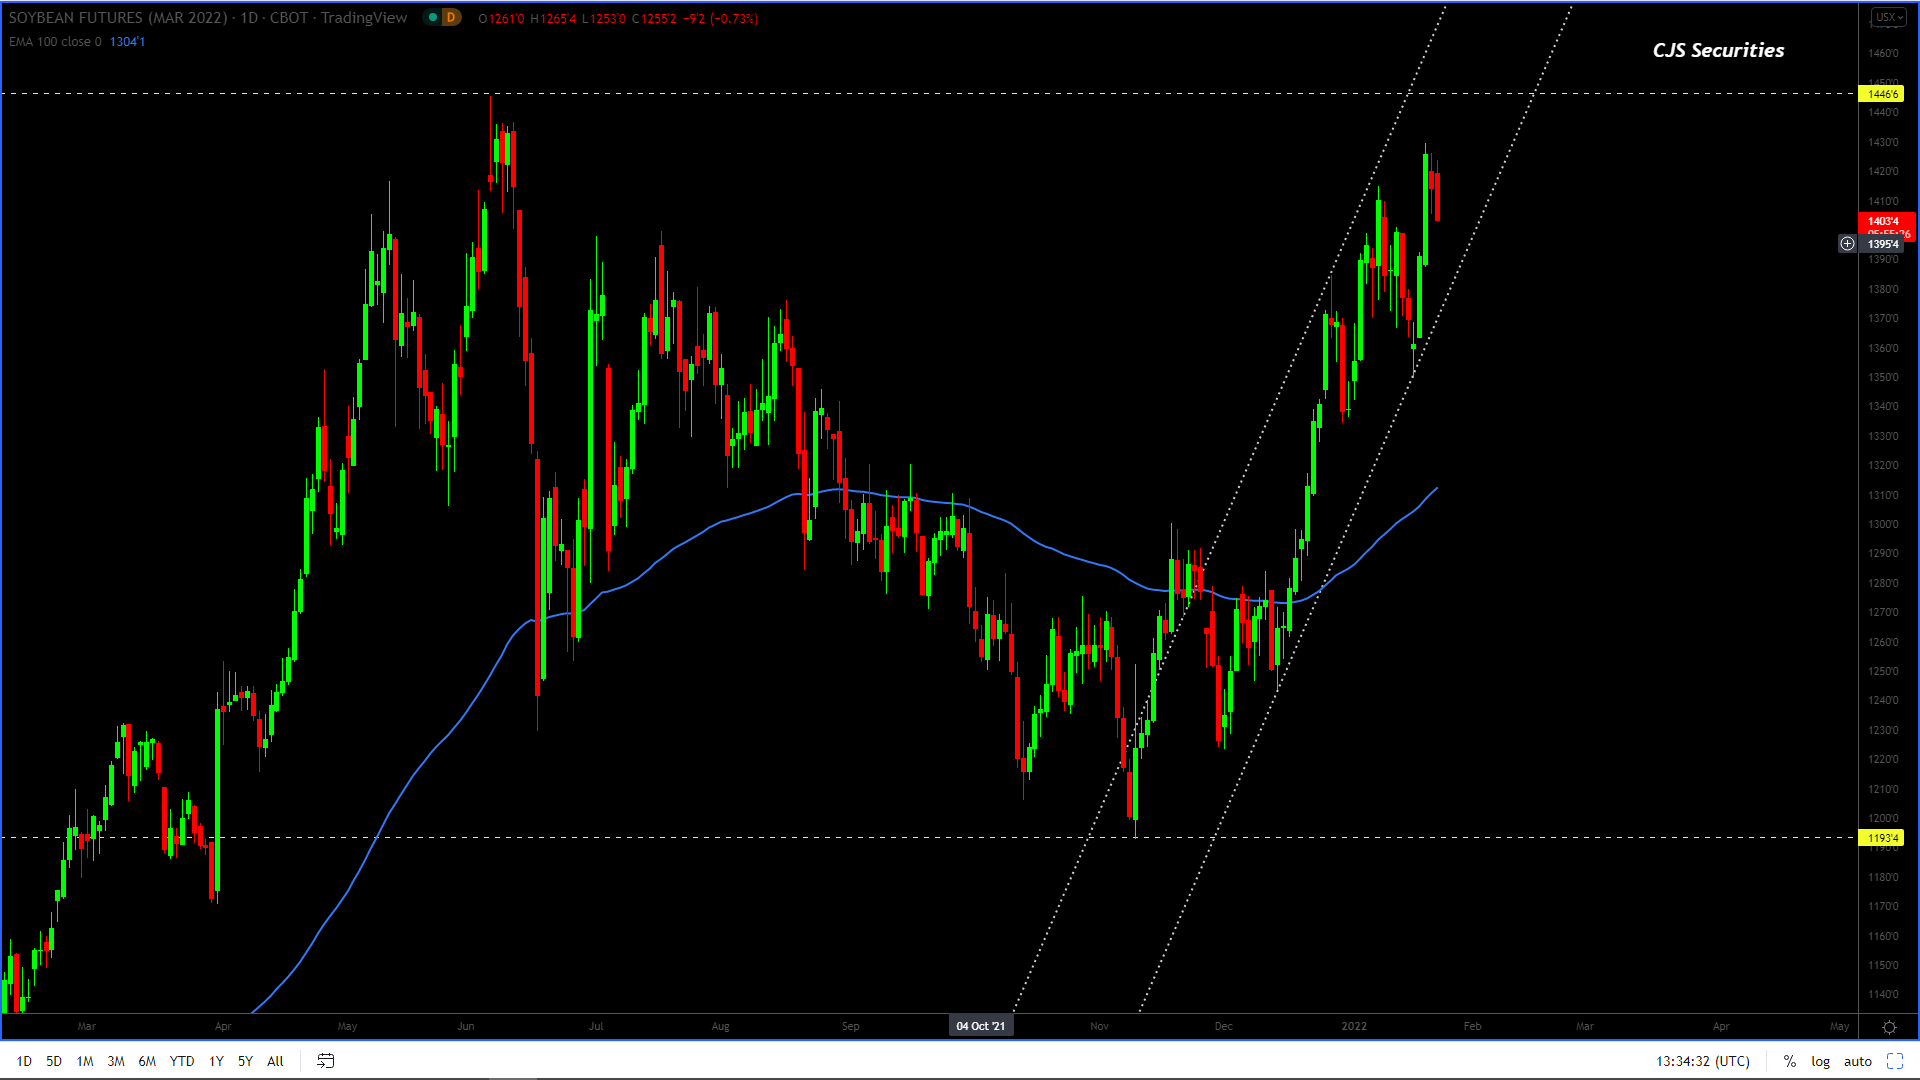
240 Min CBOT January 22 Soybean Candle Chart
The 240 min chart is still looking good, but I feel that the next leg up will be the last before making a decent correction.
For those that are long I would definitely look to take some profit on a rally over the $14.50 level.
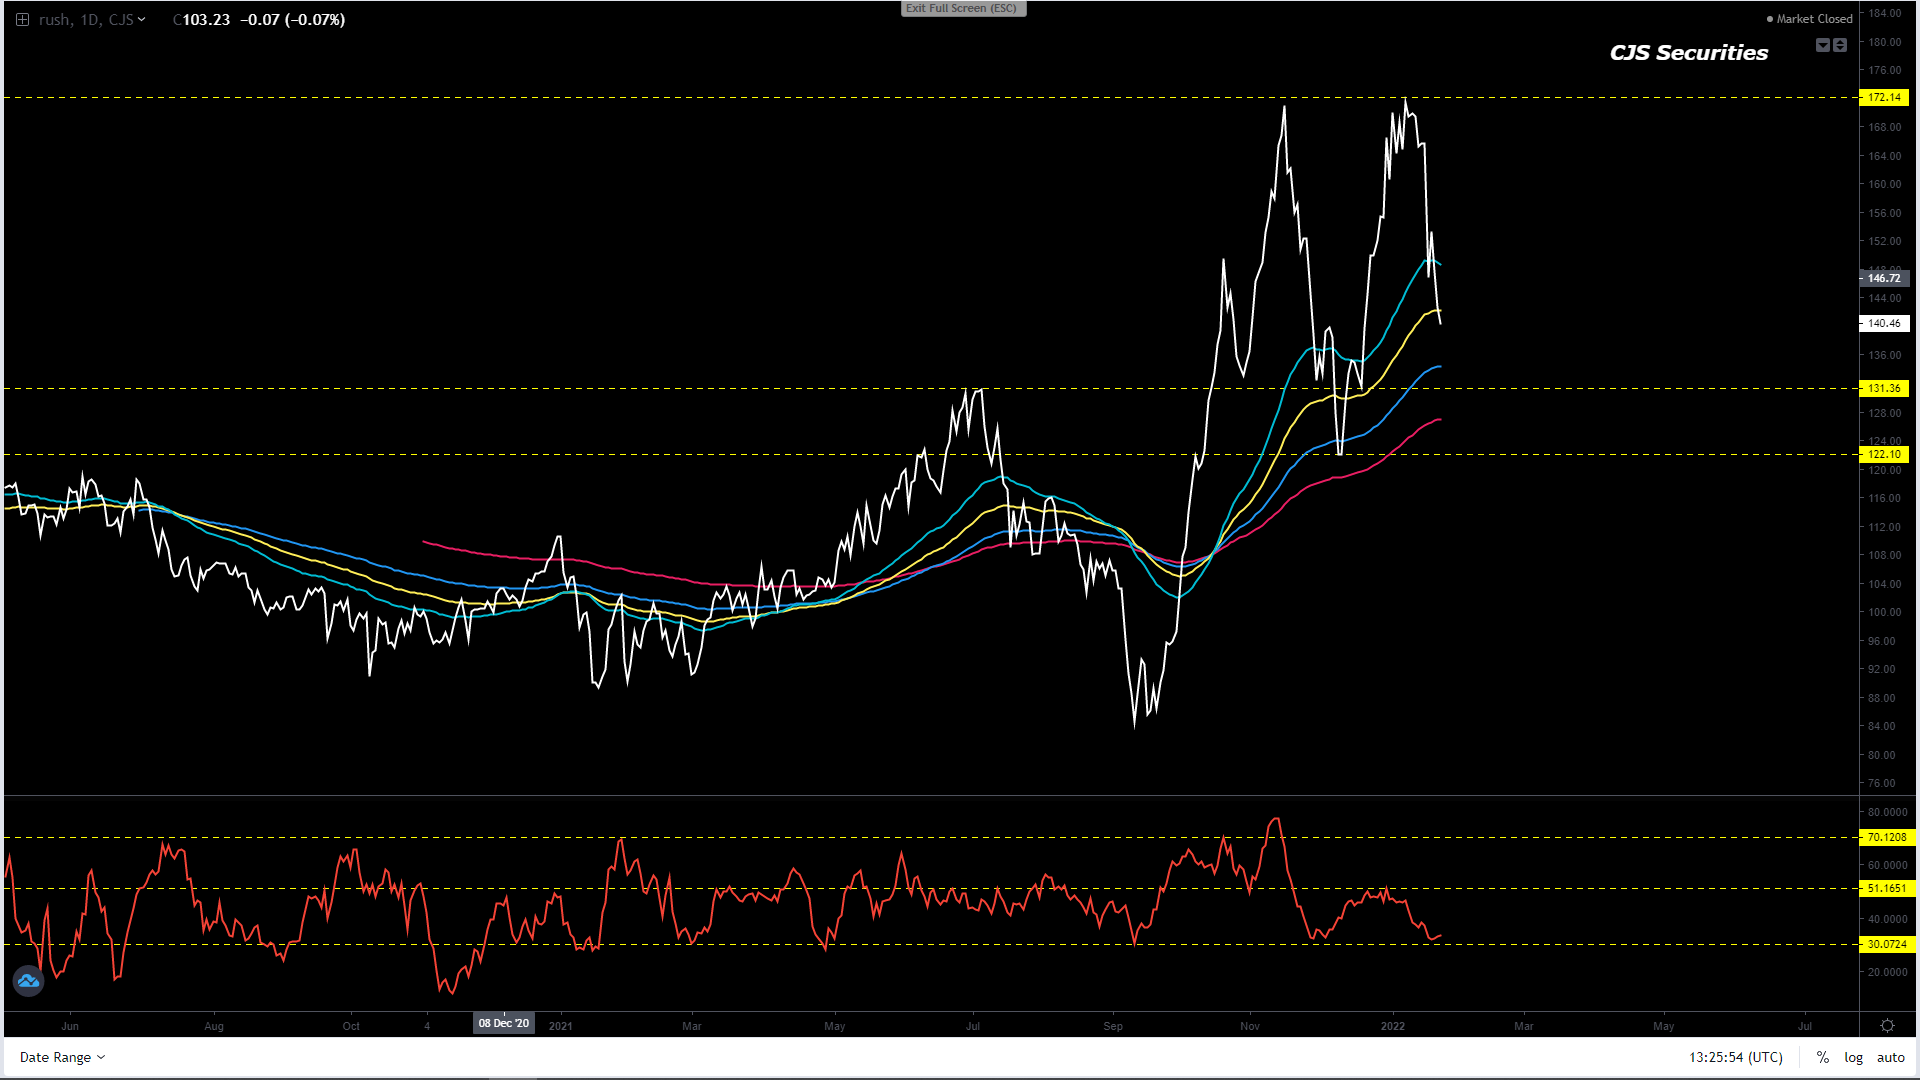
Board Crush Continuous Daily Close
Wow, all I can say that this price action is wicked and could easily be a widow maker.
Right now, I would look to buy a dip to the previous low at $1.22.
The chart is nearing seriously oversold levels.
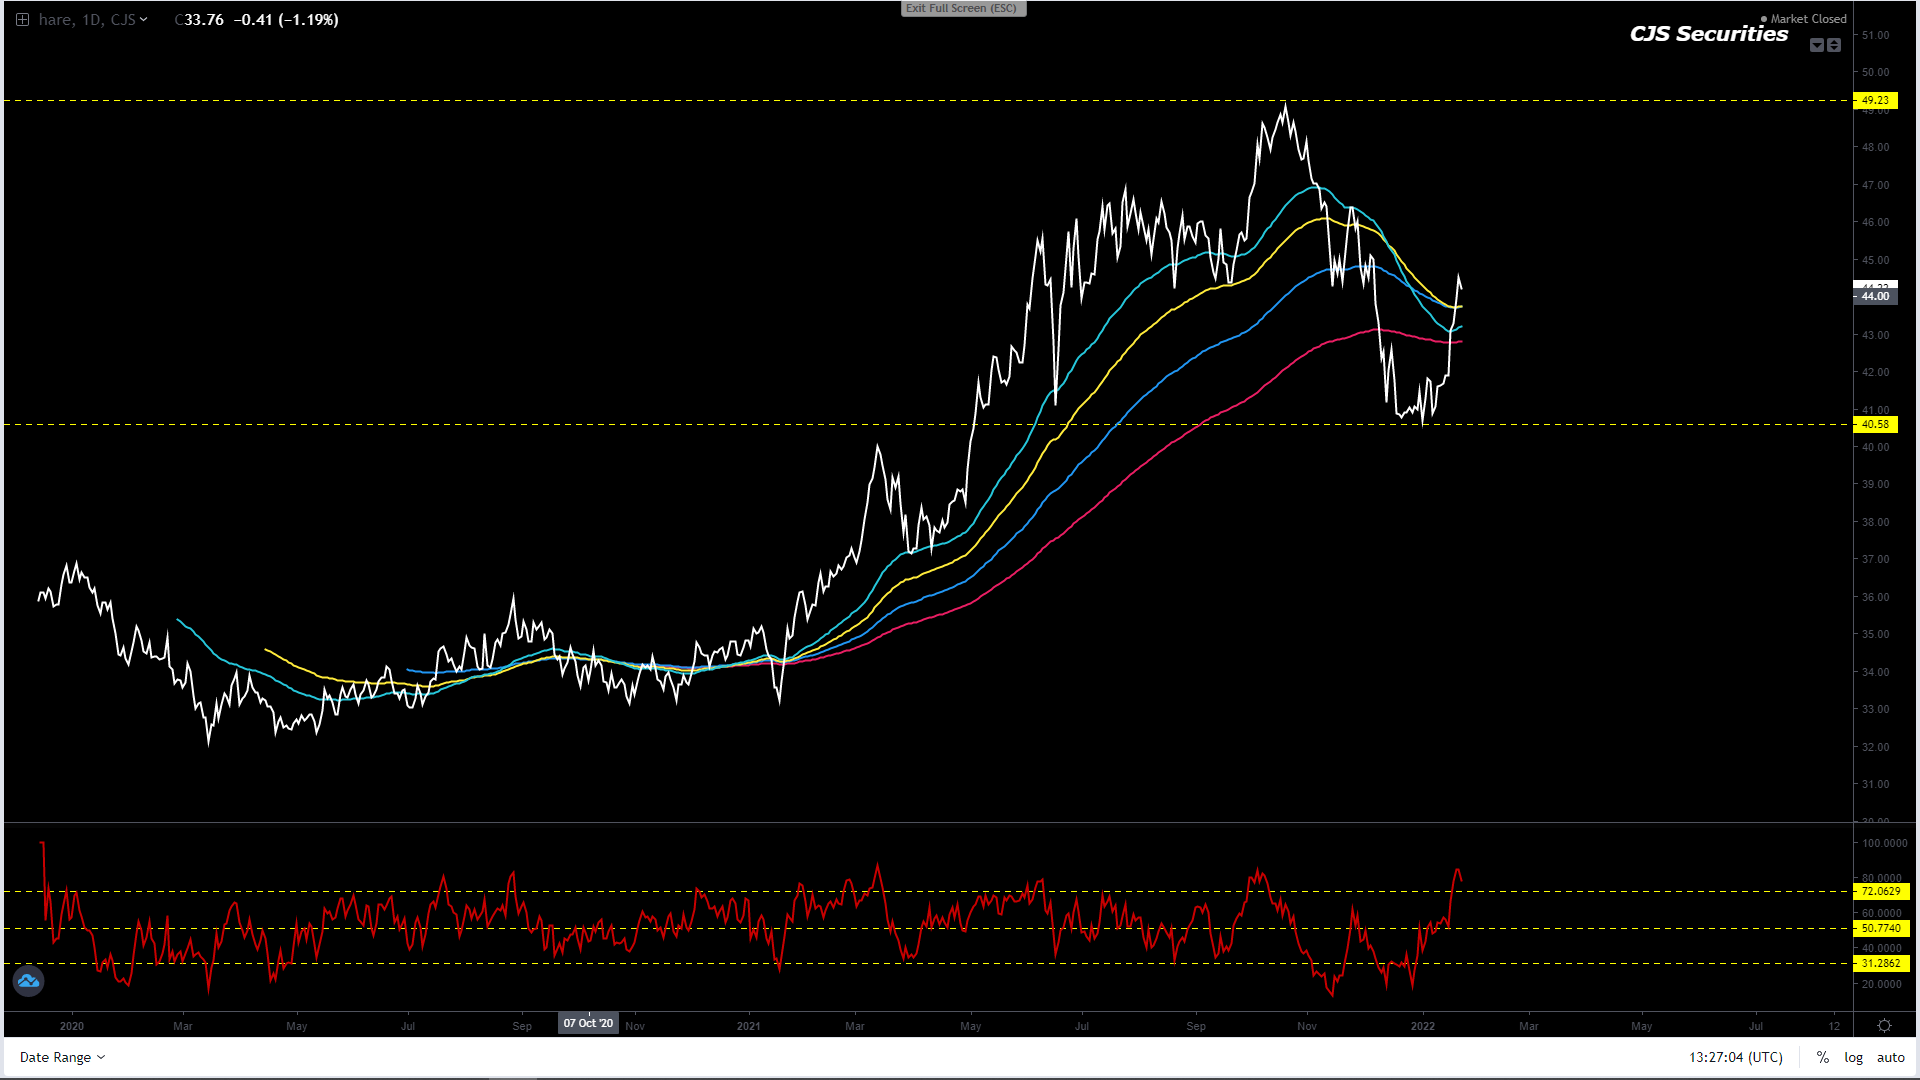
Oil Share Continuous Daily Close
We have not been stopped on the below view, but will put in a stop under 40% as this chart is now highly overbought!
“After kicking off extremely oversold levels and making a new MT low, the chart remains at oversold levels and another leg lower to 42% will get me long. – lets see how this plays out.”
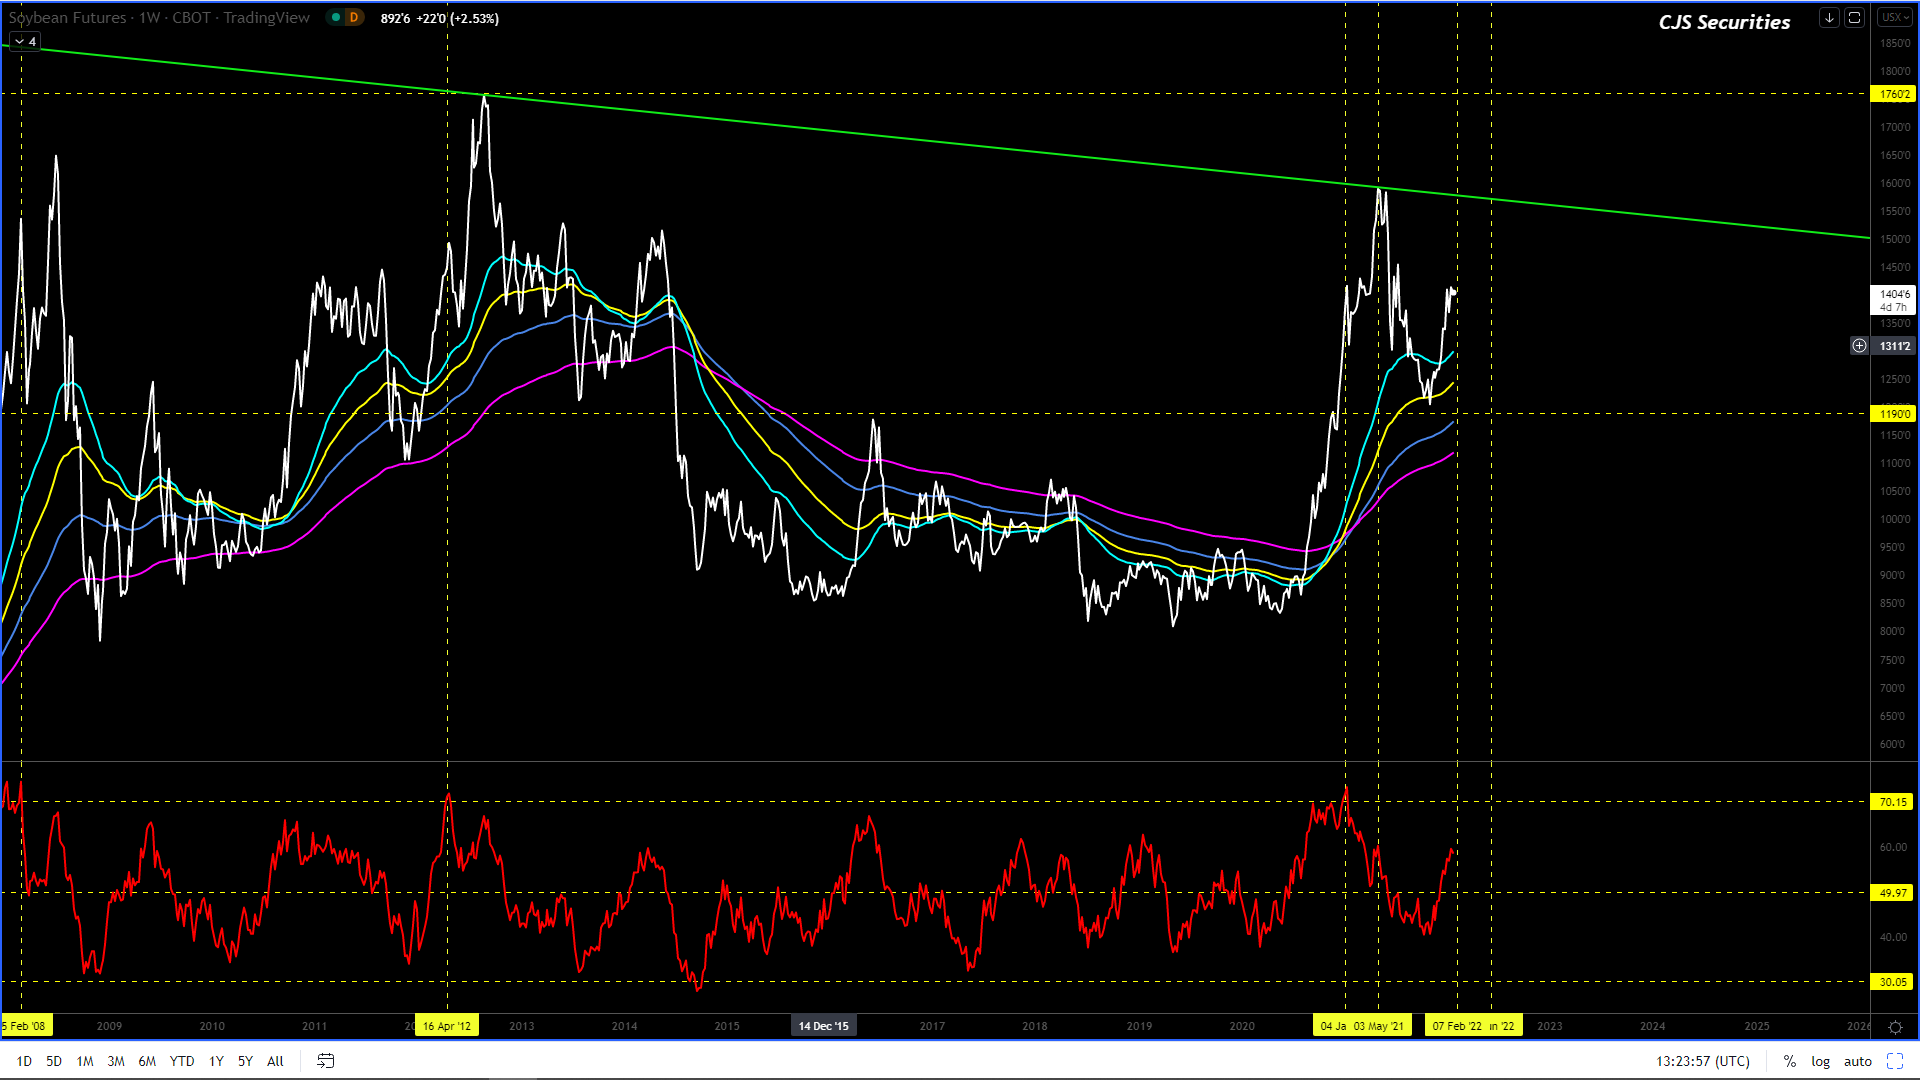
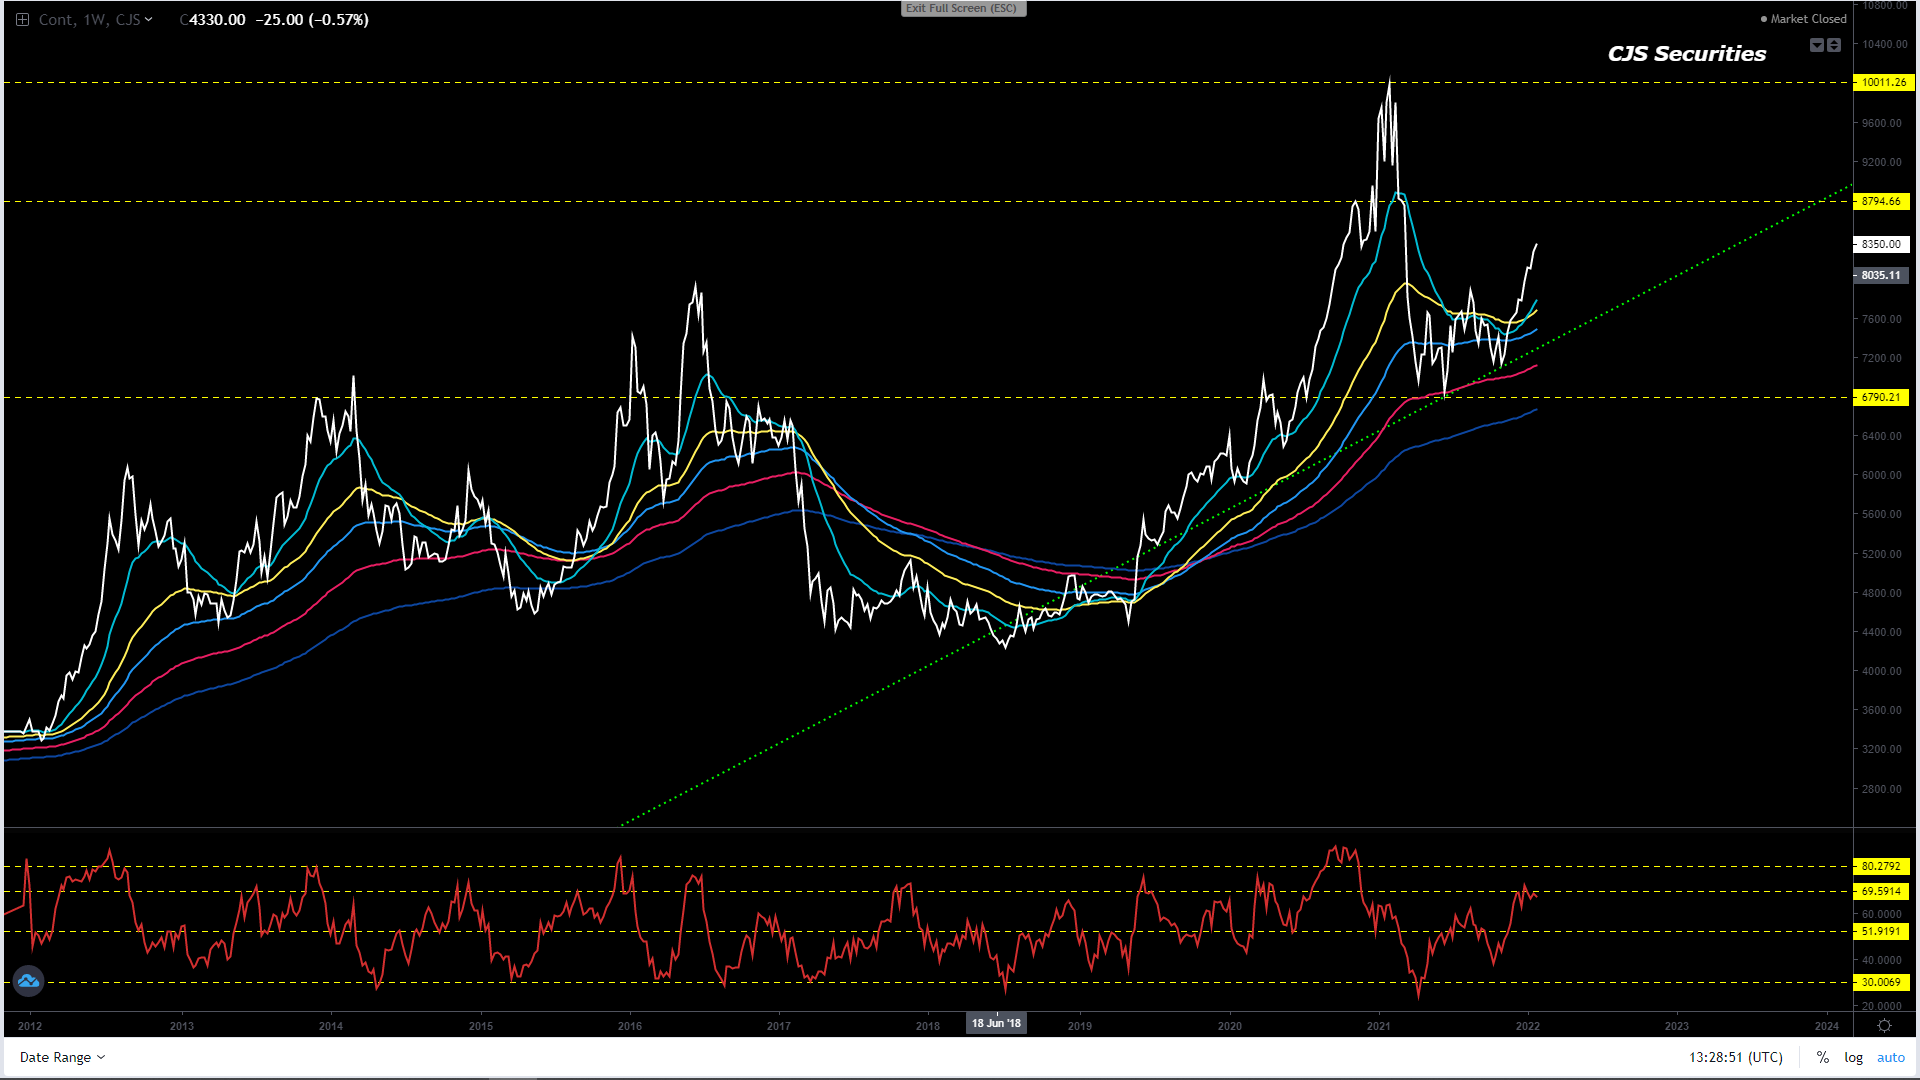
Weekly SAF Soy Continuous Close
For those that were long in size congratulations!
I would take 50% of the cash and ride the balance as this chart still has decent upside in the coming weeks.
This chart looks great, and I expect a move to over R8000 in the coming weeks! – this played out very well.
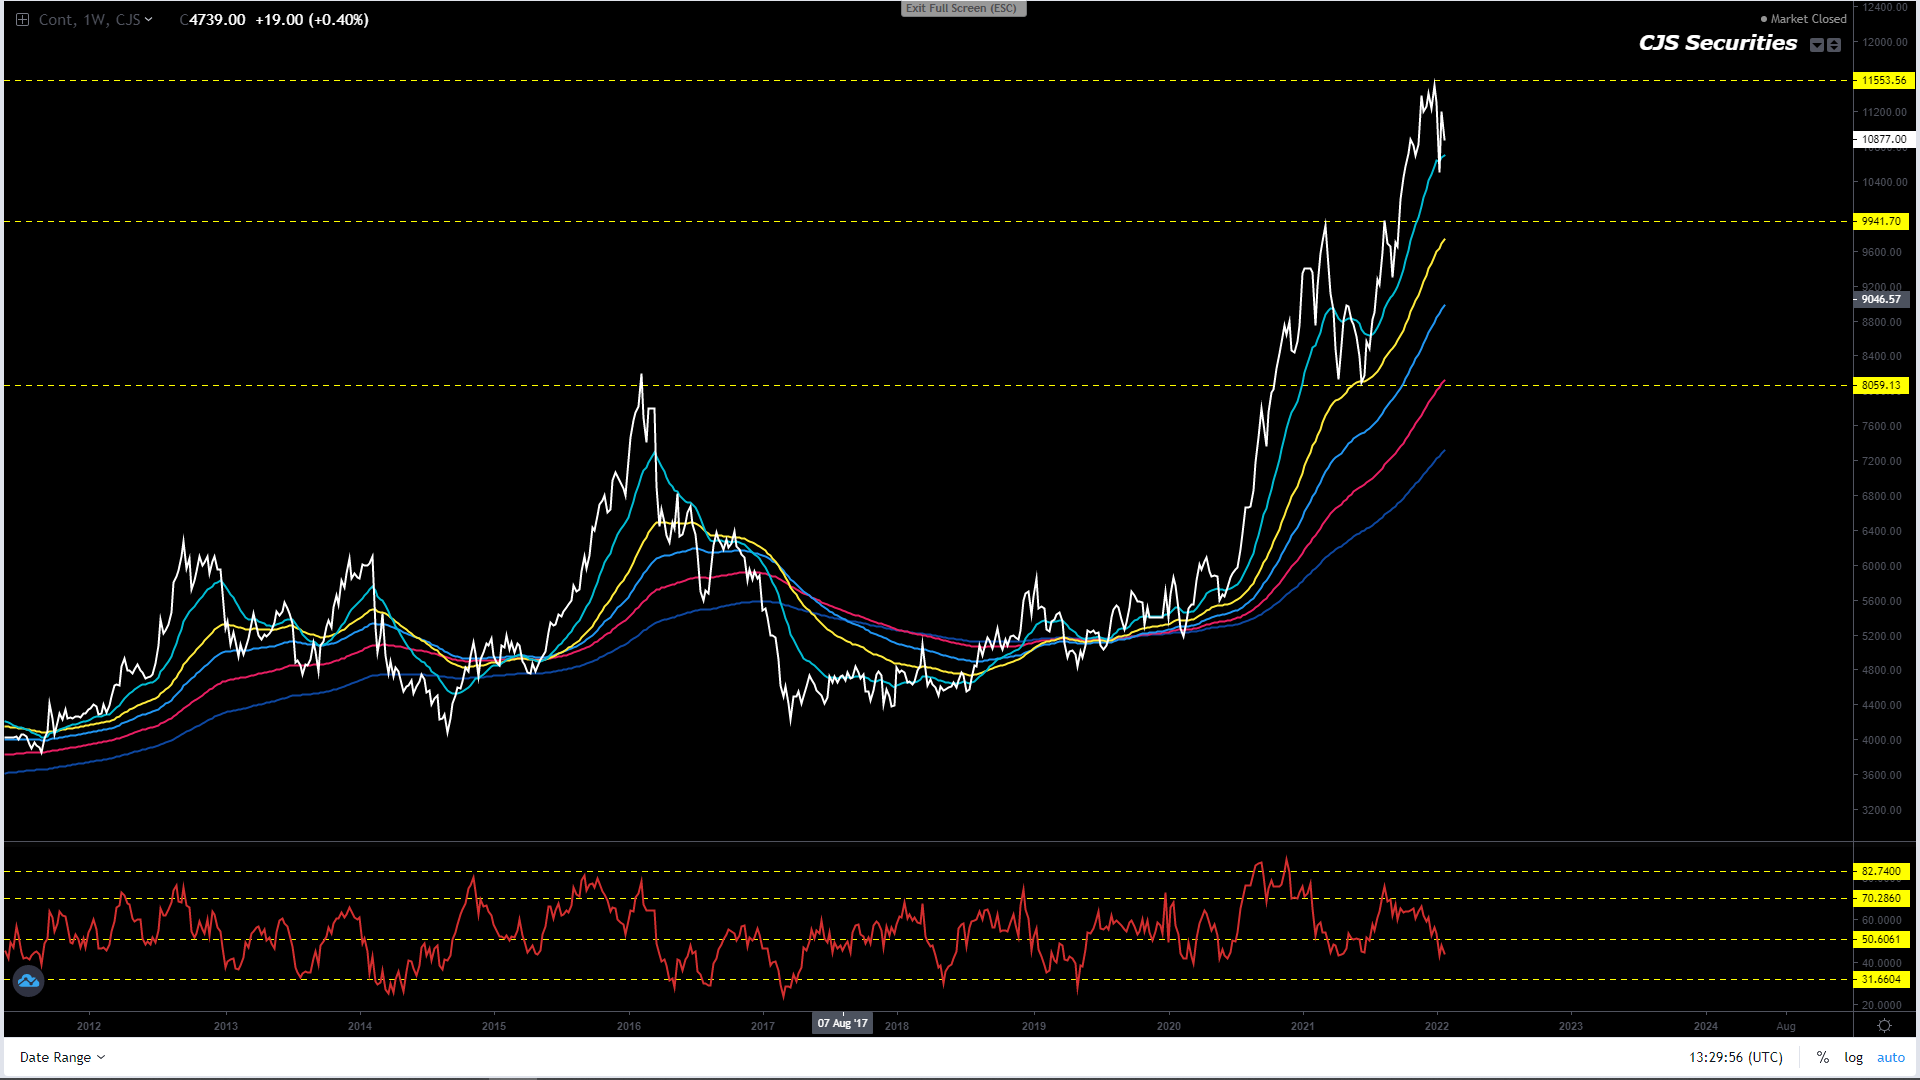
Weekly SAF Suns Continuous Close
This chart is not a true refection of the Suns market and hence I don’t have any commentary.
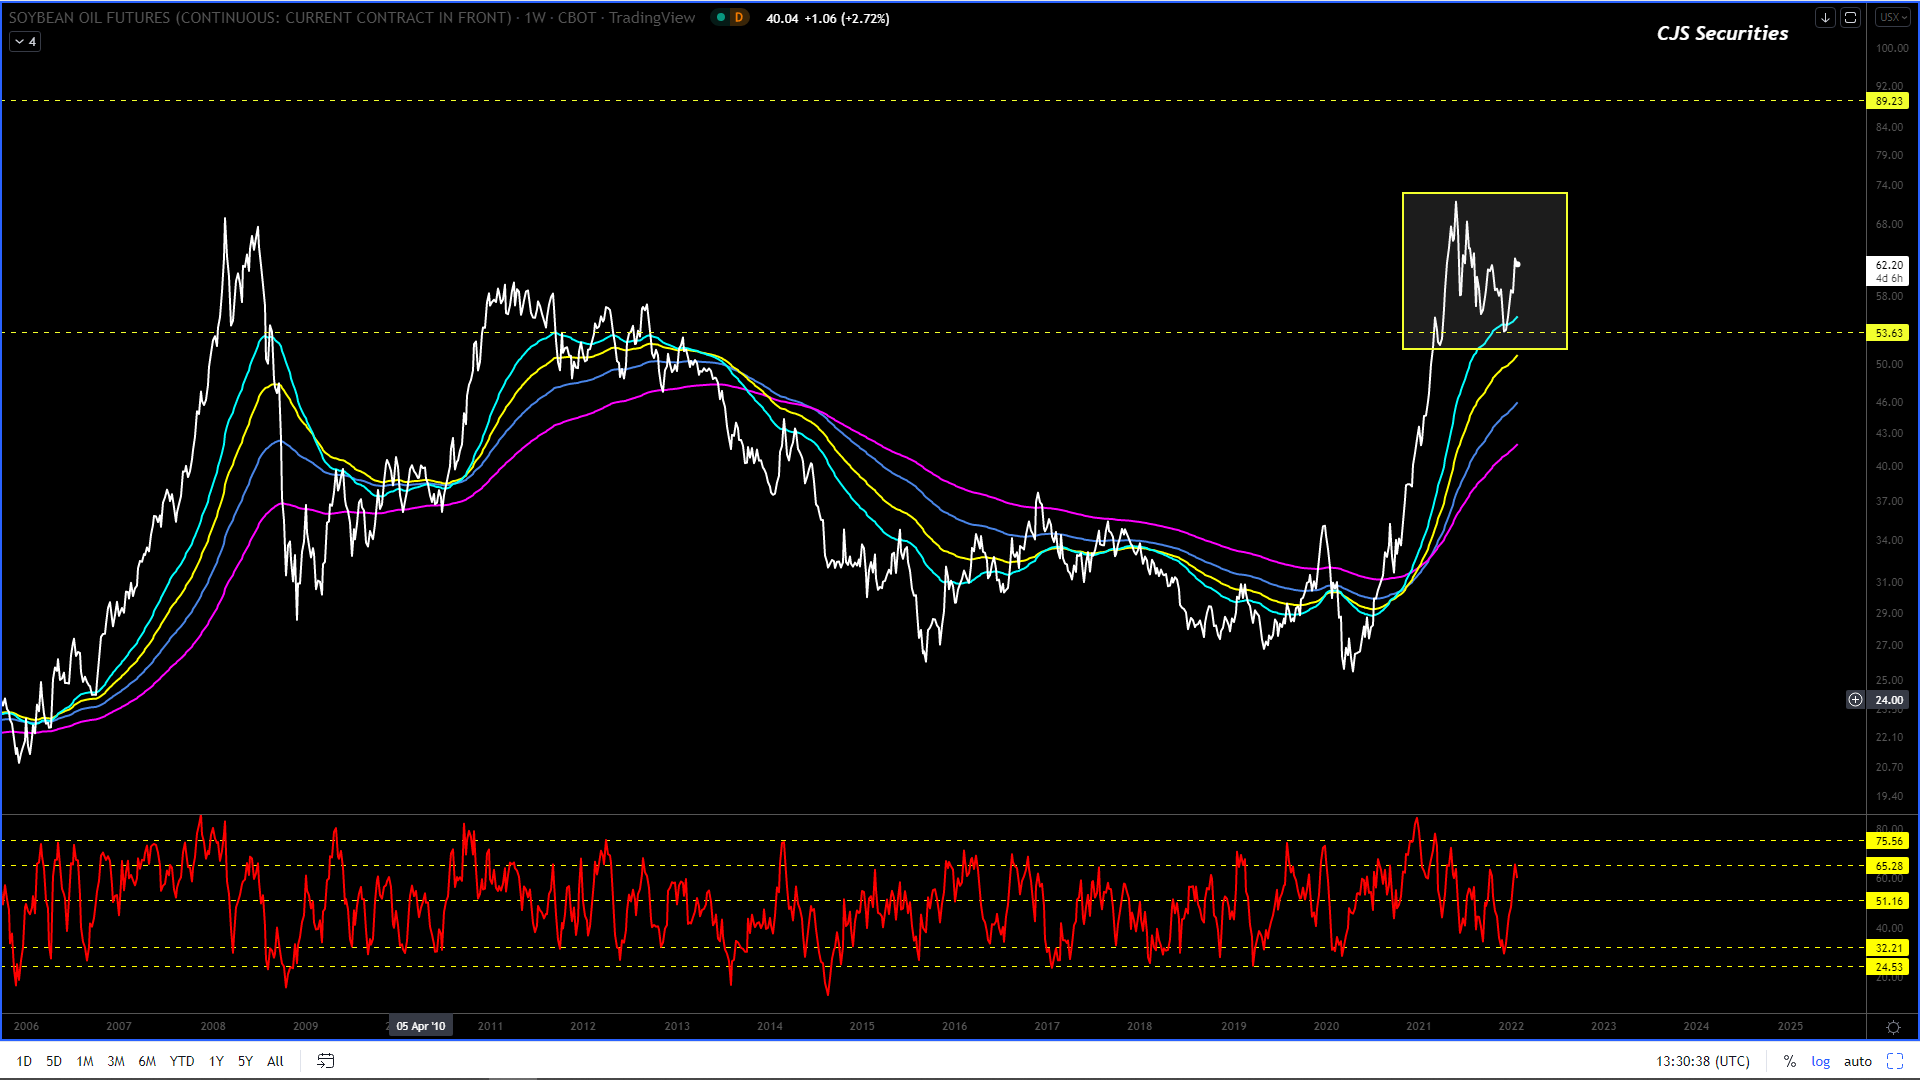
Weekly CBOT Soy Oil Continuous Close
Ok the below is all the commentary from last year and we have still not been stopped, lucky more than anything else, but as the great Gary Player says “the more I practise the luckier I get” and this chart is headed north over the next few weeks.
I seem to have this wrong and although we are long, this chart is now grossly oversold on a weekly basis and we need to dig deep and buy more scale down with a stop under $0.52 as the rally is coming, even if its only a kick!
I feel the correction is done (it had another leg lower), and all the pullbacks from here are buying opportunities with upside targets between $0.85 -$0.89! – the correction was obviously not done.
I almost feel that we don’t have enough cash to get as long as we should, buy at best and scale down, this is budget making stuff with sprinkling of retirement!!!! – hope we don’t go broke before retiring.
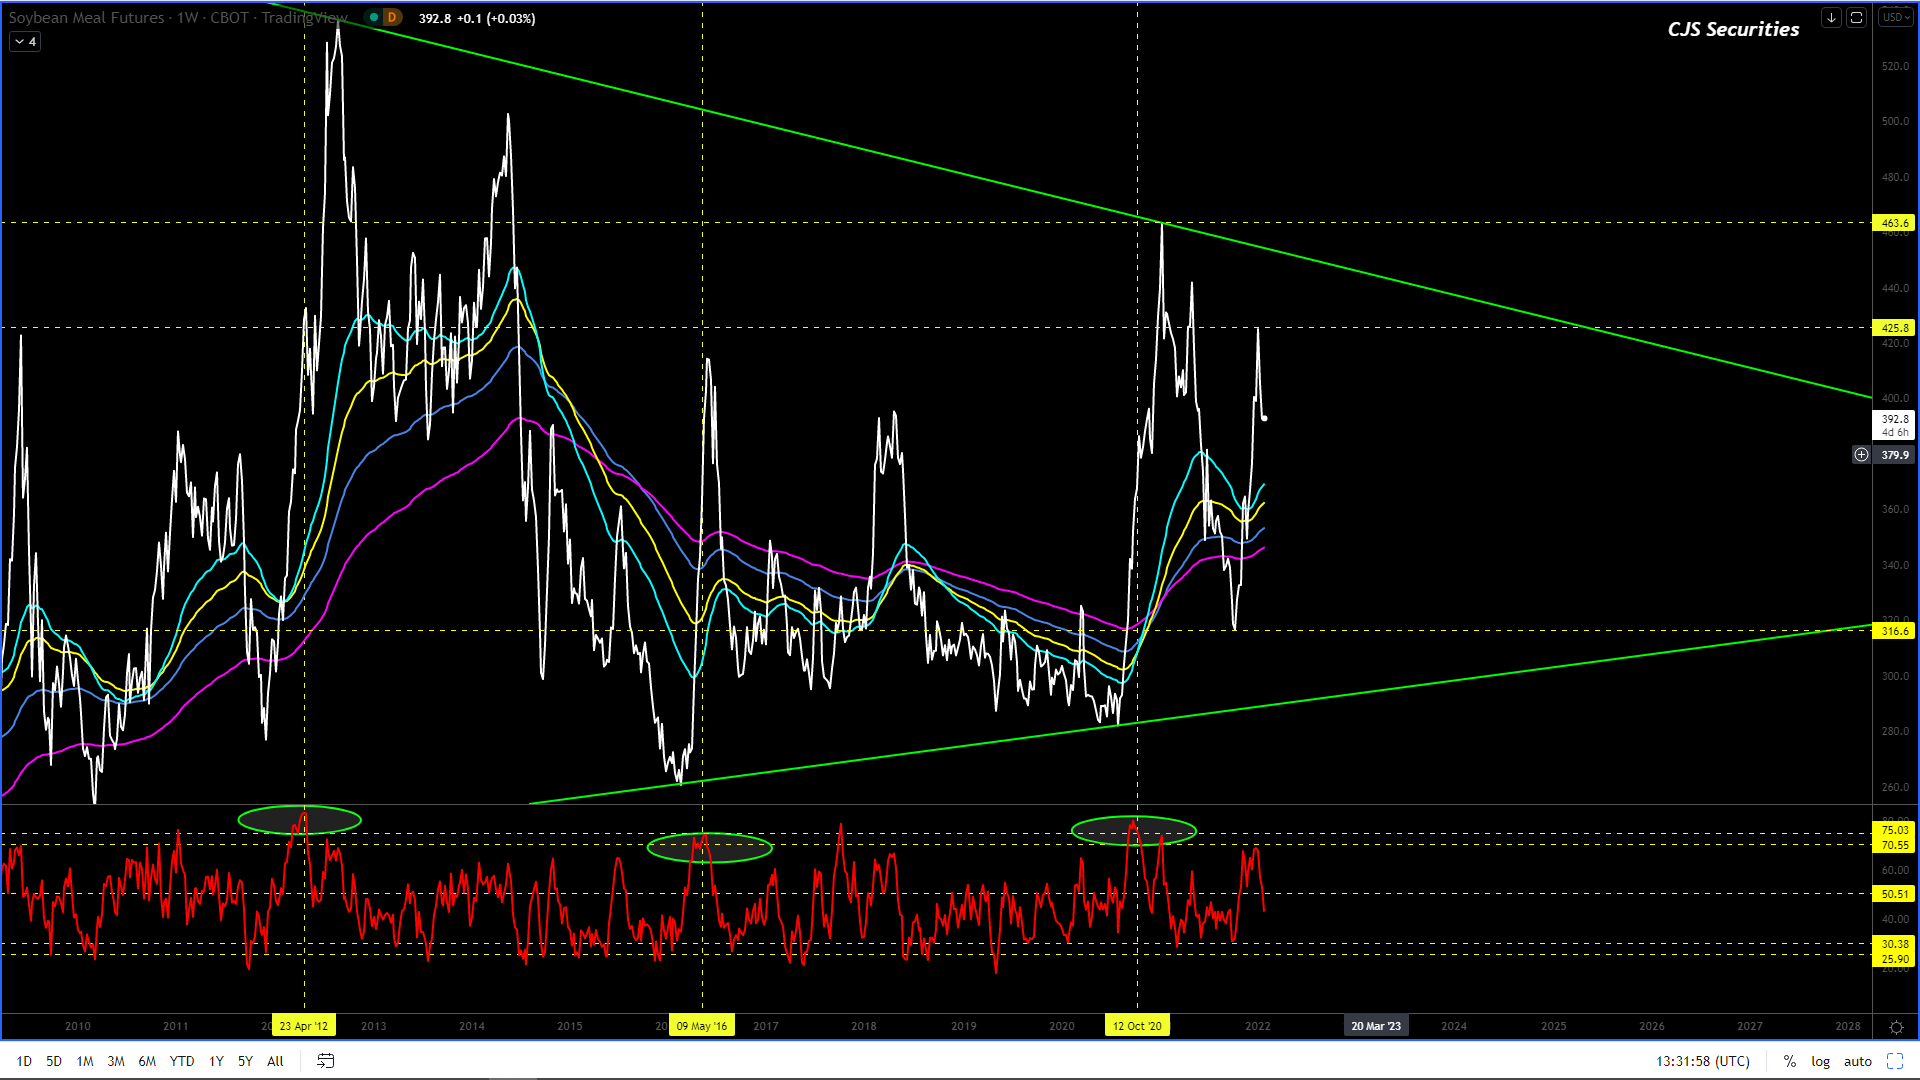
Weekly CBOT SBM Continuous Close
After
a great trade, we will once again be looking at getting long, but are happy to
stay square for now until further notice.
“I
love the chart, and after confirming a low, all the pullbacks are a chance to
BTFD’s!
$400 +here we come! – what a
trade, what a call! ”