Firstly, this will be the last report until the new year, and with that, I wish you and your families a blessed Xmas, and may 2022 be a year of happiness and prosperity.
Weekly, very little has changed, although the chart looks to have completed its pullback to the high R15.60’s.
The Weekly Close remains bullish until we have a close under R15.35 and its with this in mind that I would look to get long from R15.70 – R15.35.
The only thing that I do not like about this chart is that currently we are sitting at overbought levels.
This however can last longer than your patience and squeeze you out of your positions as we are working on a weekly close.
Dollar/Rand Daily Candle
The chart remains strictly bullish, and the pullback could easily be completed having traded into the “pullback zone.”
Should this chart trade under R15.47 the bullish technical action would be negated.
This chart is super volatile and R0.25 intra day moves are the norm, so again please keep your stops tight and only ever trade when you are comfortable and not because you have FOMO!
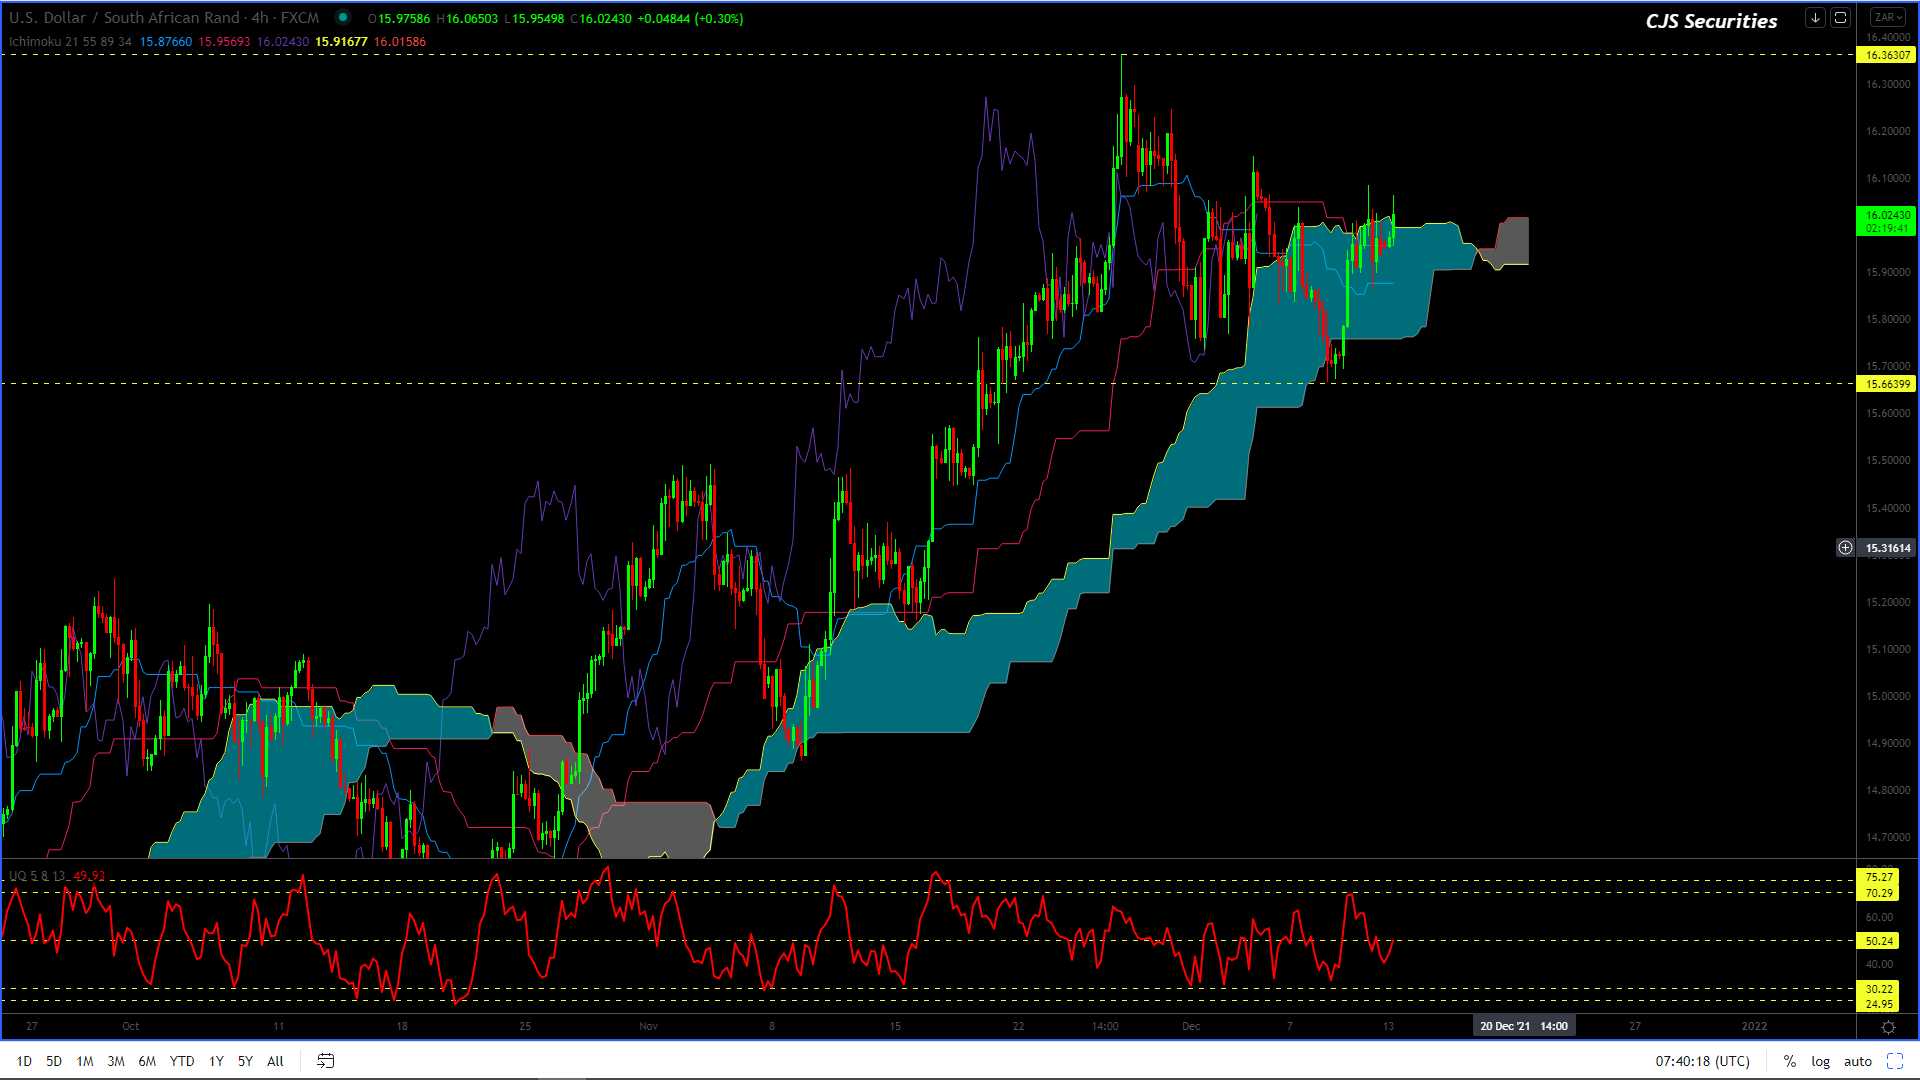
Dollar/Rand 240 min Candle
The R16.20 sell trade never materialized.
However, we have a new trade on the cards that I have high hopes and a firm conviction!
Buy R15.88 – R15.73 with a stop under R15.66 with targets at R16.48.
This trade will have a RR of 46/10.
As always keep your stops tight, with zero emotion!
If this plays out the bottom of the cloud should provide some serious support
Euro/USD Weekly Close
#No change in the commentary.
The $1.1250 proves just how massive a support level it is, and if she goes, we might print sub $1.10 before this chart even thinks about kicking.
As things stand though, it is very unclear whether or not this chart is completing a correction that will turn up from current levels or if it is taking a breather, but what I do know that a pullback from here is on the cards no matter the greater outcome.
US Dollar Index Weekly Candle
We areSTILL waiting patiently to see if the below plays out.
The only thing I can add to the below is that if the last candle plays out this chart might have had a false break.
But it is early days and should take 3 – 6 weeks to playout.
We are long at 95.32 and will keep a tight stop under 95.
The road map is playing out very well and the sky is the limit.
SA Government Bond 30 Year Yield Daily Close
#No Change in the commentary.
HUGE double tops!!!!
However, as it stands I can still see 11.40% printing within the next 4 – 8 weeks.
Expect the 11% level to provide massive resistance! – this has aged pretty well.
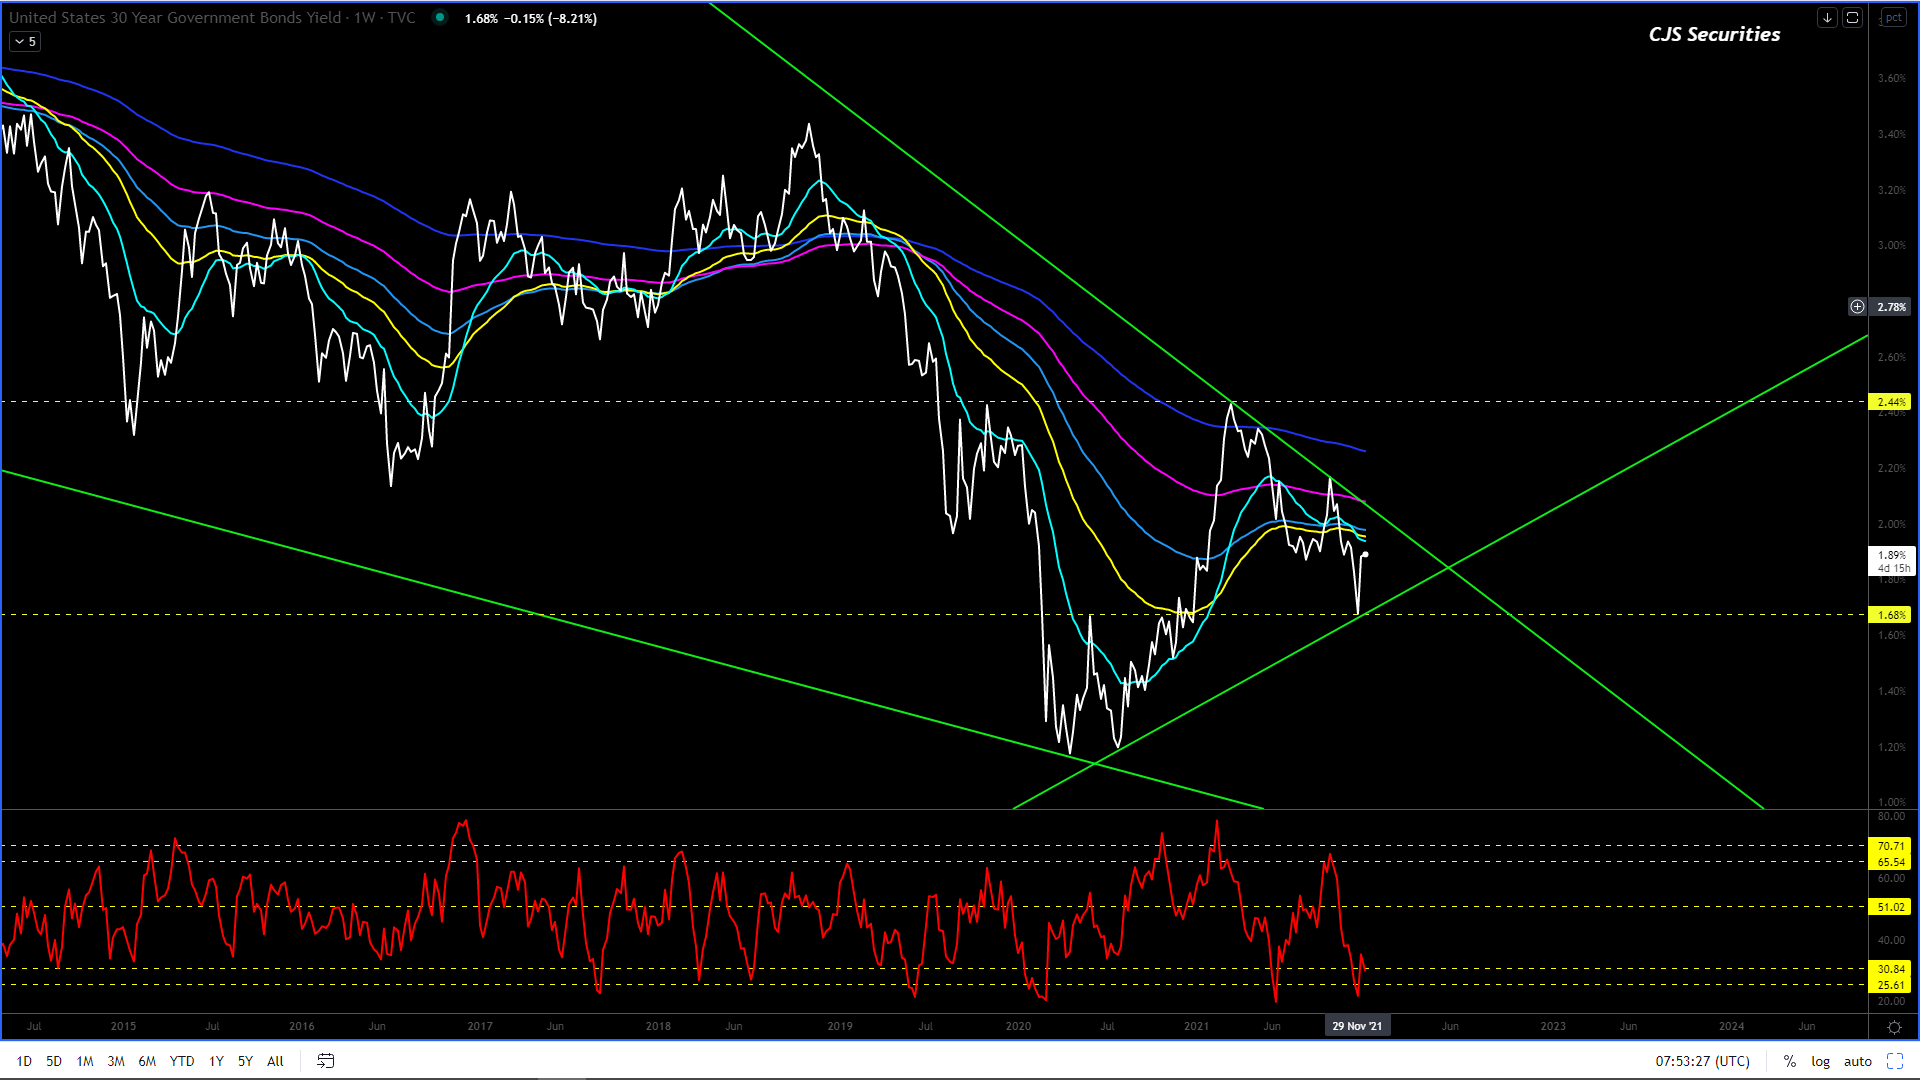
US Government Bond 30 Year Yield Weekly Close
All I can say is the
chart is kicking nicely after being super oversold.
I have no strong view
and will need the chart to play out over the next few weeks.