The last time this report was sent, WAR had not yet broken out.
I want to spare a thought for all the people that have been affected and displaced at this time.
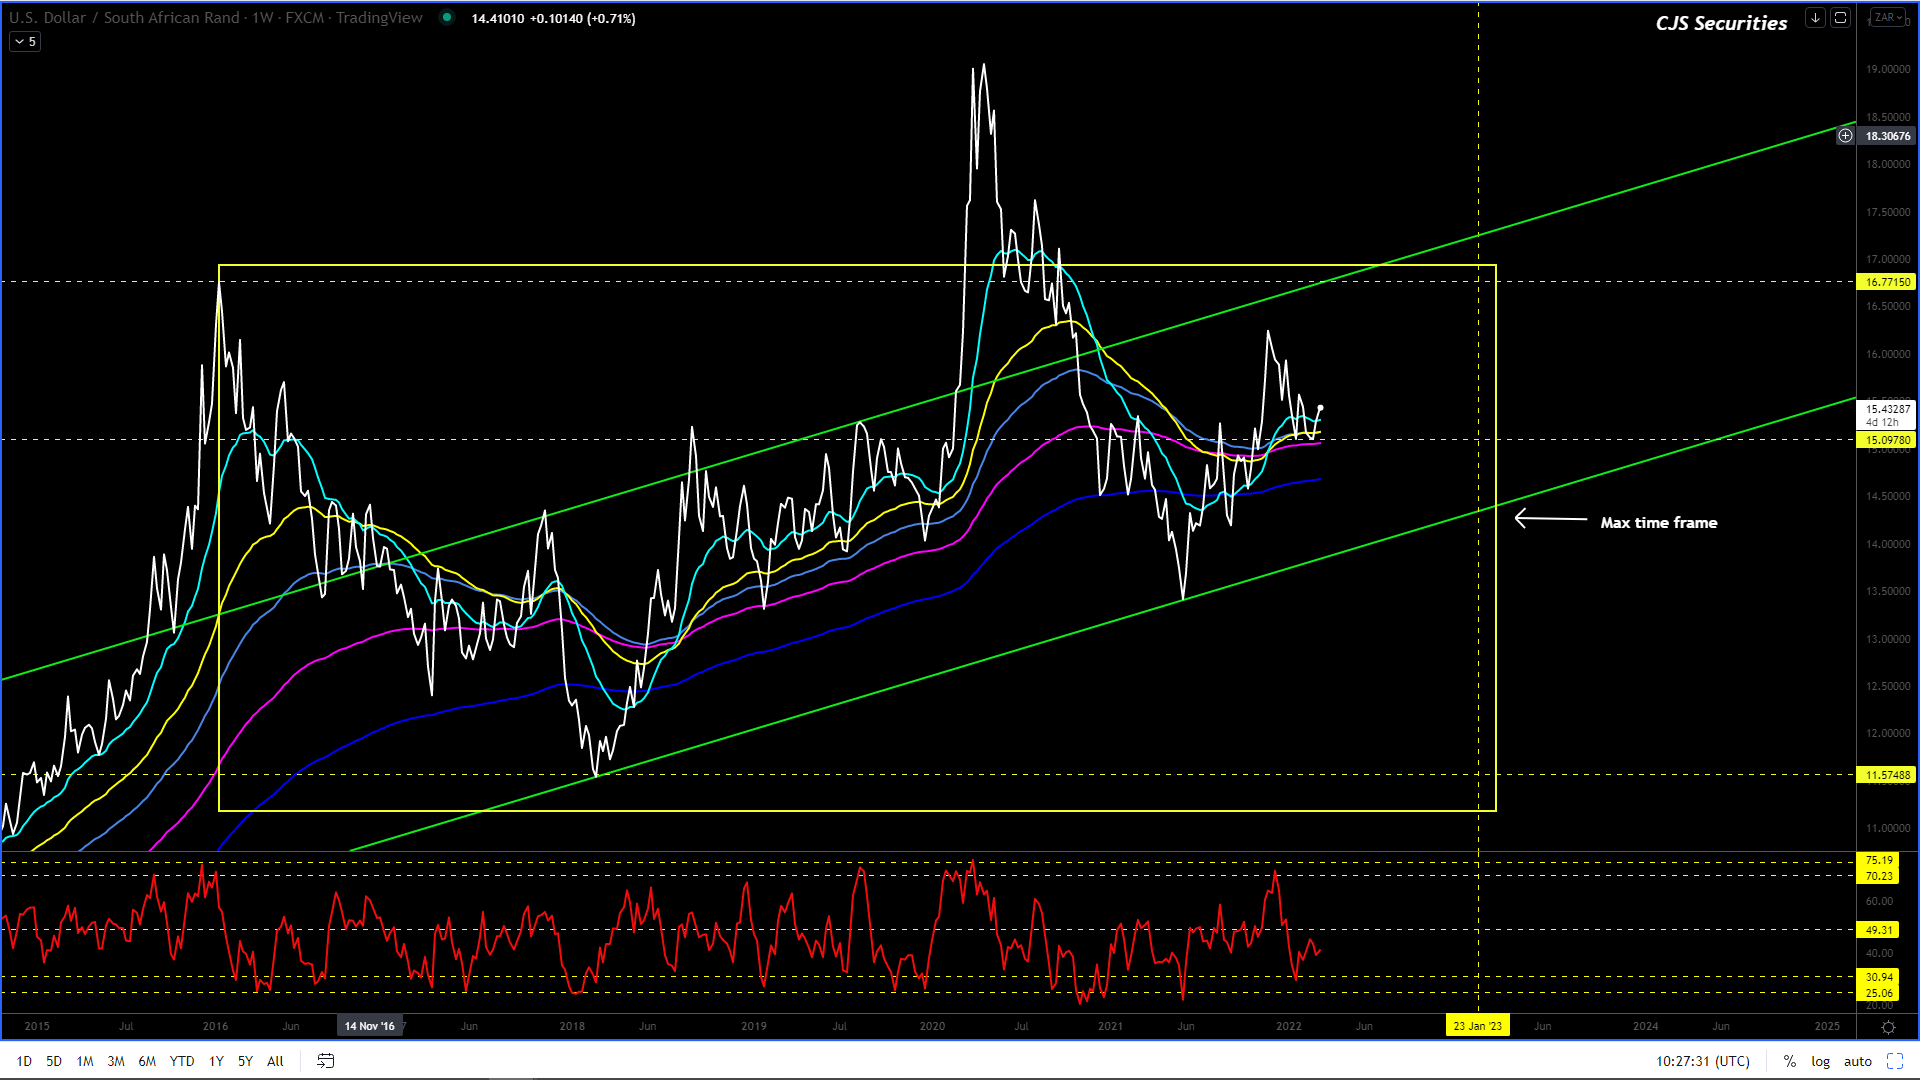
I still see the below taking place over time.
What I see is R11.50 over the next 17 months.
I am convinced that the ZAR is in a multi-year corrective phase vs. the USD and that from today on, all upward spikes on this chart are well worth a short!
This chart could easily have a leg higher and trade toward the R16.77 level in the coming weeks. – I would use this as a USD selling opportunity.
Until then, the range is likely to be R14.88 – R15.50 and I would seriously consider owning the bottom of the range! – hopefully some of you bought the sub R15’s, even as just a ST hedge against war.
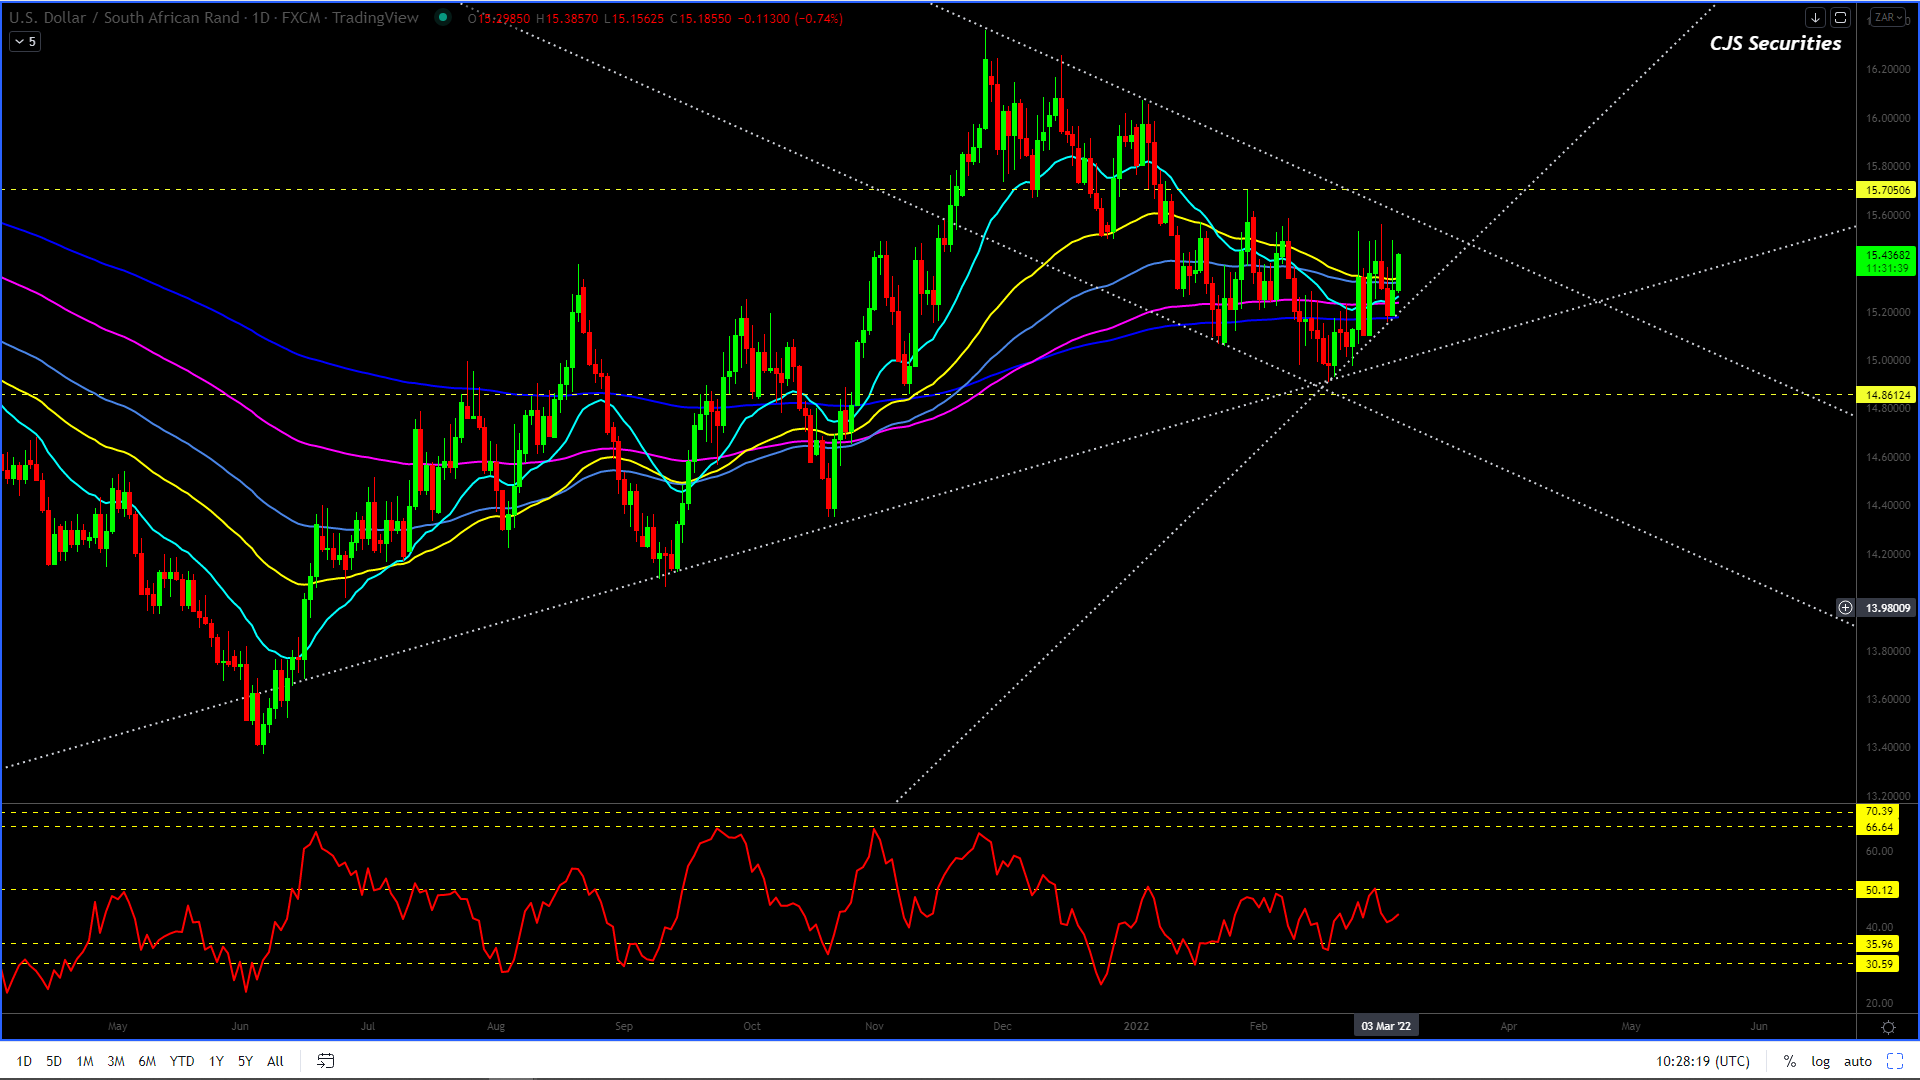
Dollar/Rand Daily Candle
Overall, the chart formation is corrective, needs a leg higher, and fits my weekly view.
I want the last leg higher into the R16’s to complete the chart.
I cannot stress enough how important patience is and keeping your mind clear as emotions are sure to get the better of many this year.
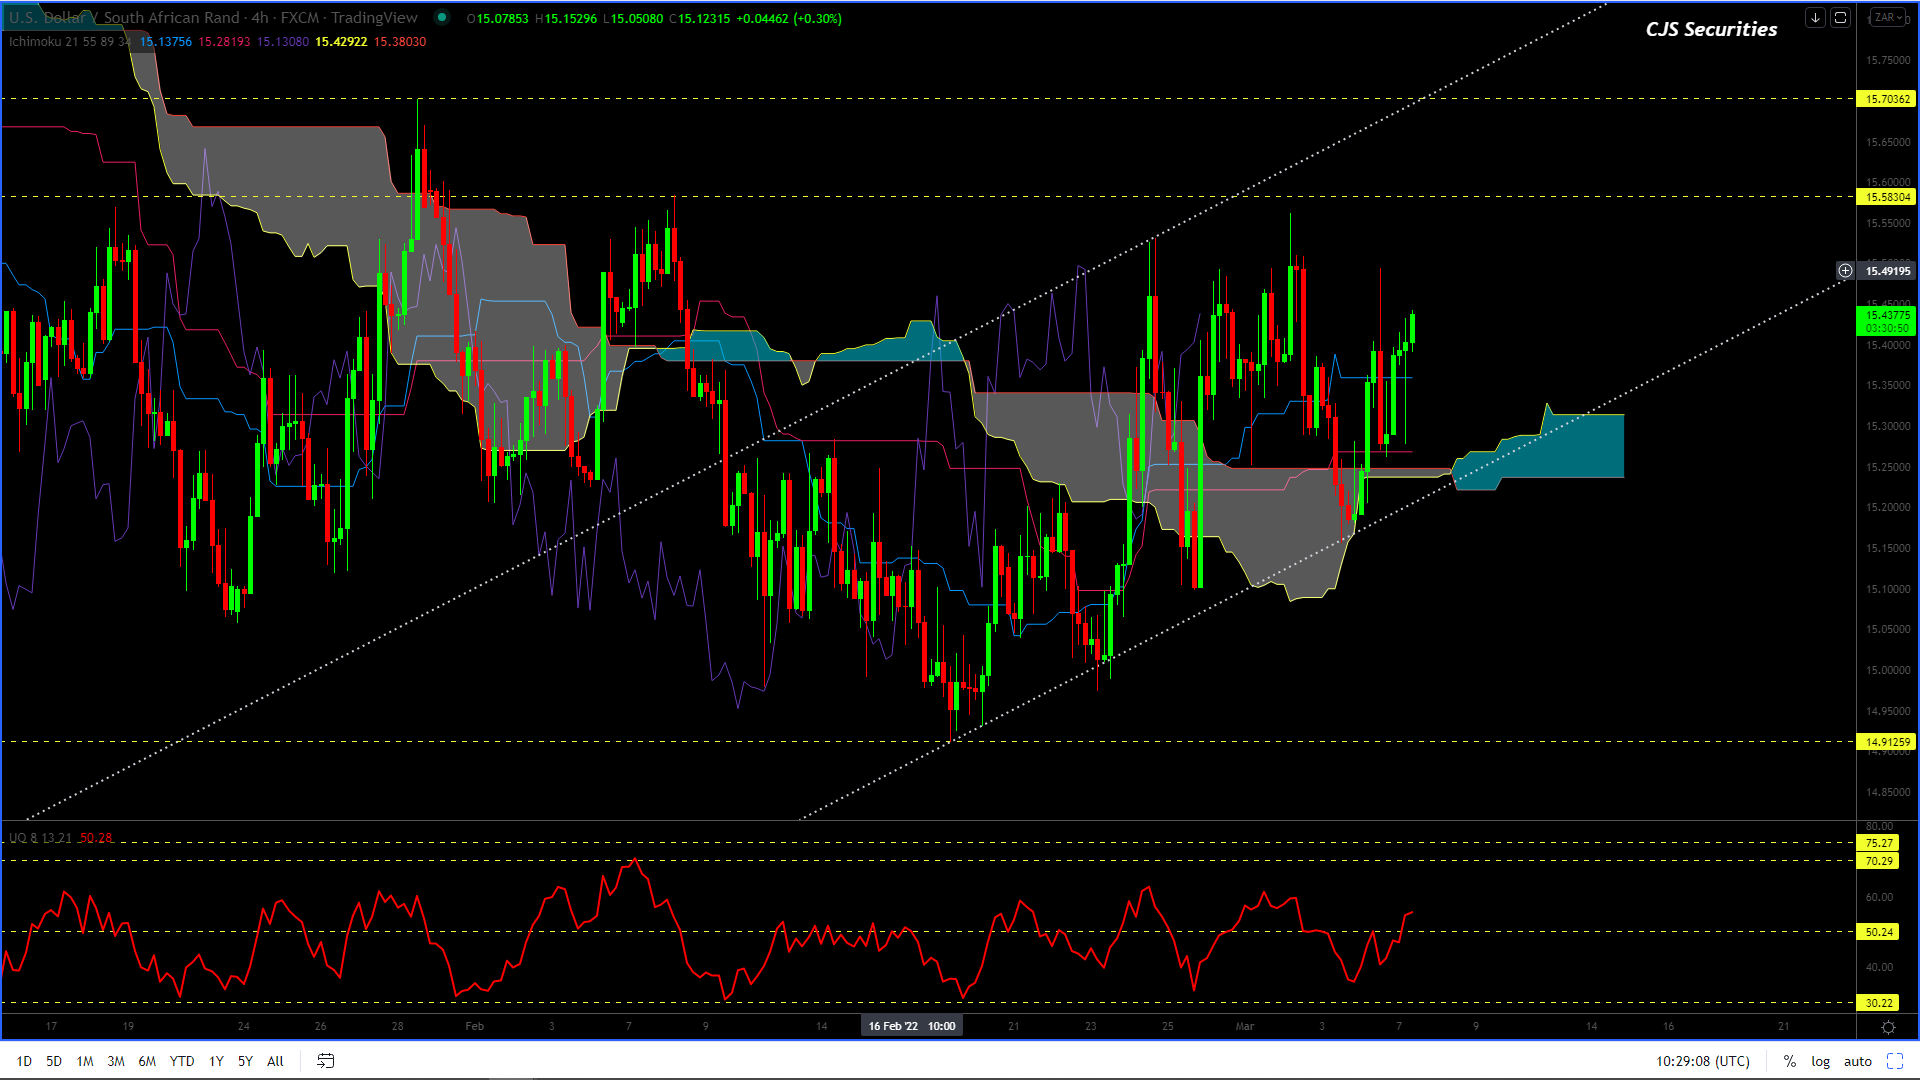
Dollar/Rand 240 min Candle
#No Change in commentary
Currently, there is no decent trade that I can see on an RR basis, as I always require a 3/1 ratio.
However, this chart’s current formation leads me to believe that we will see a trade toward R15.70 and potentially higher.
So, I have decided to get long and stay long until either R15.70 or until I am stopped out through R15.00!– long at R15.22
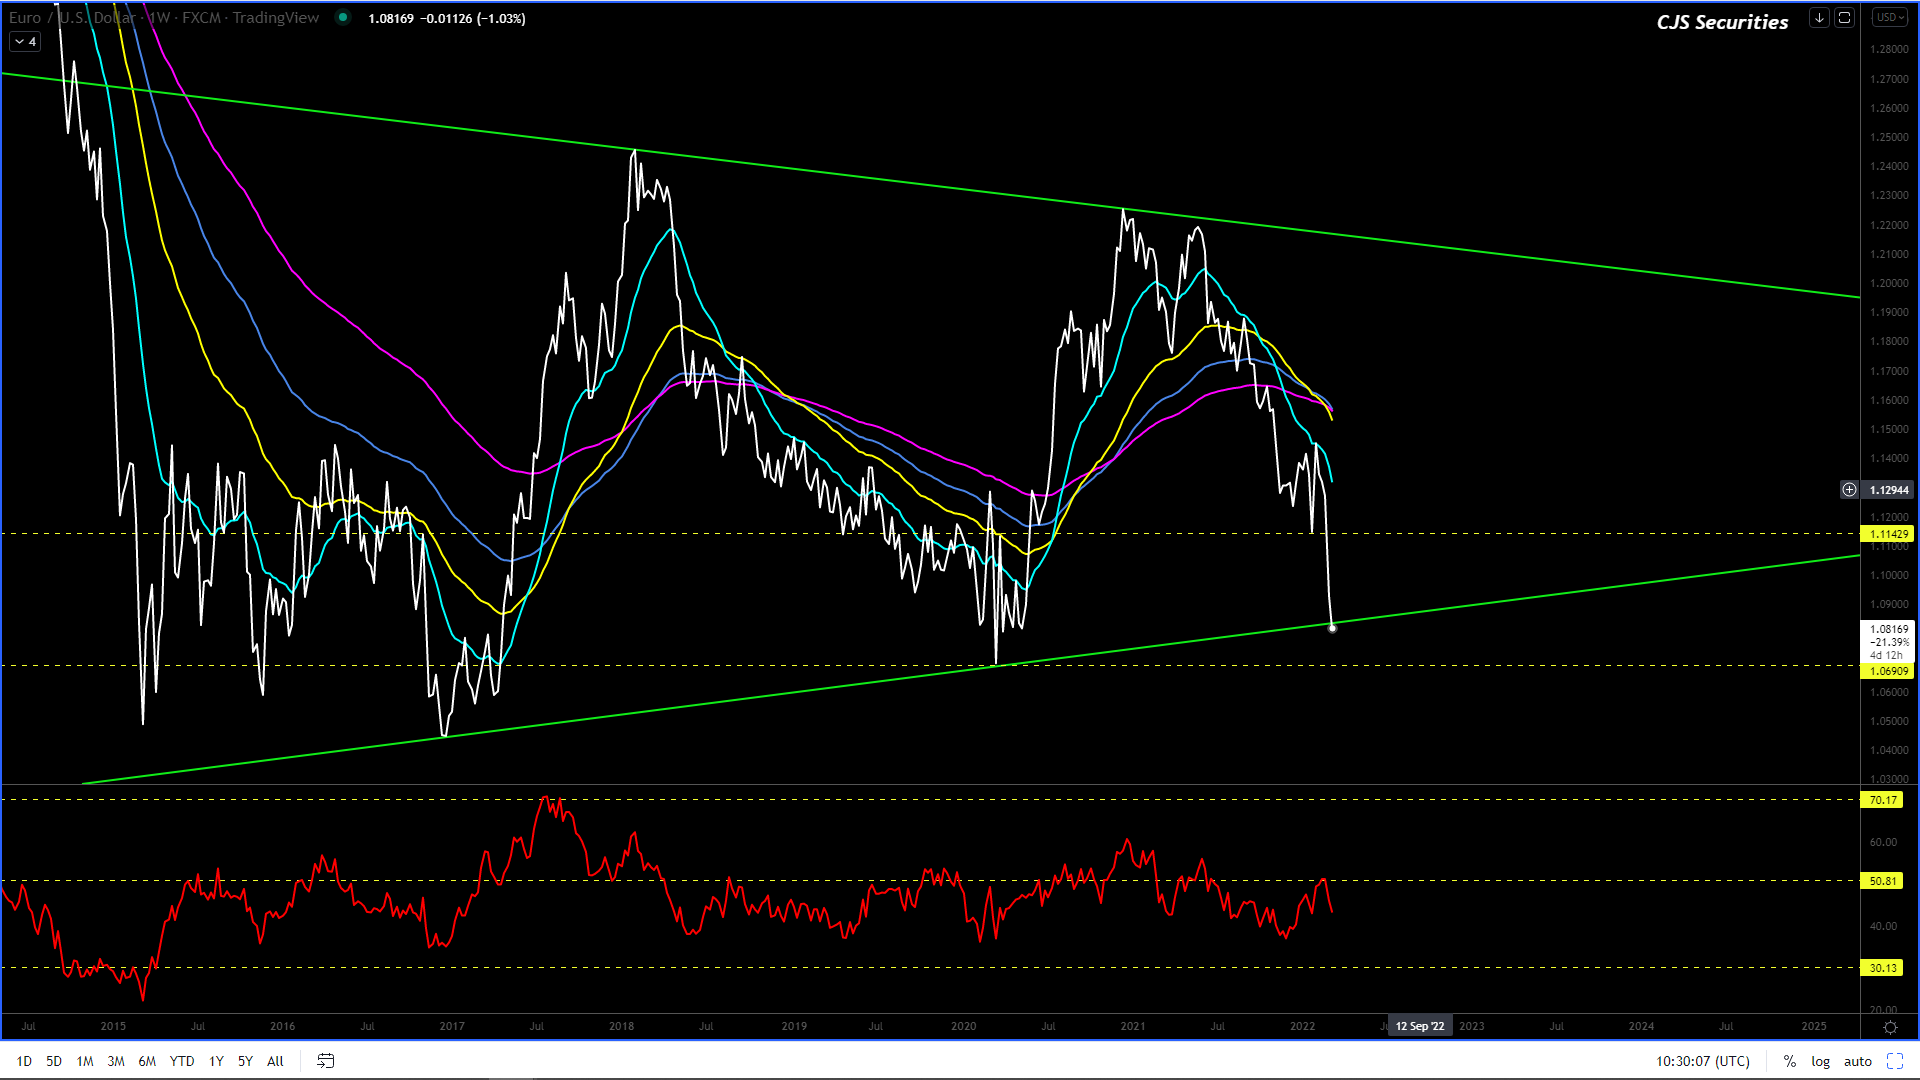
Euro/USD Weekly Close
All bets are off.
The Black Swan that is WAR has taken over, and I will need this chart to play out over the next few weeks before remotely thinking about taking a view.
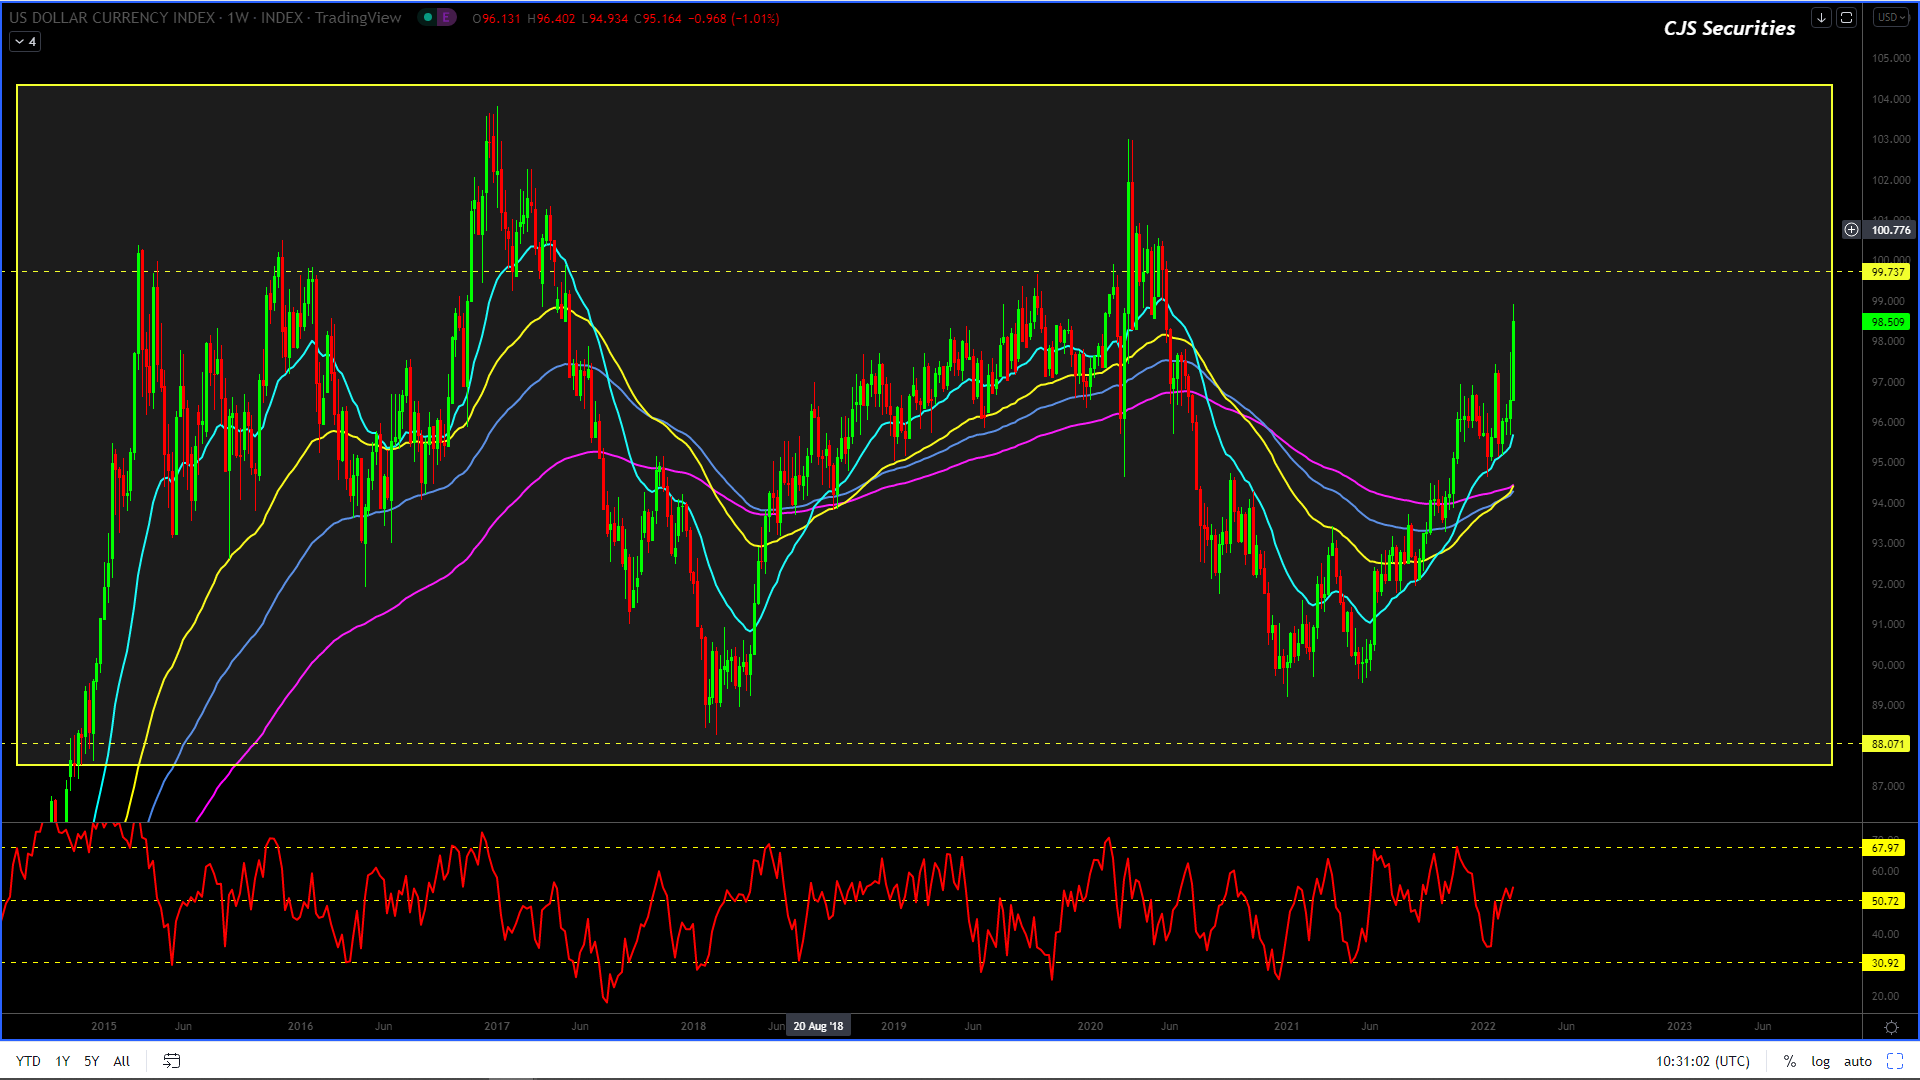
US Dollar Index Weekly Candle
So much for the chart’s upside momentum failing.
With the Black Swan of WAR taking over, I am very unsure of where to from here, and hence I would advise staying out.
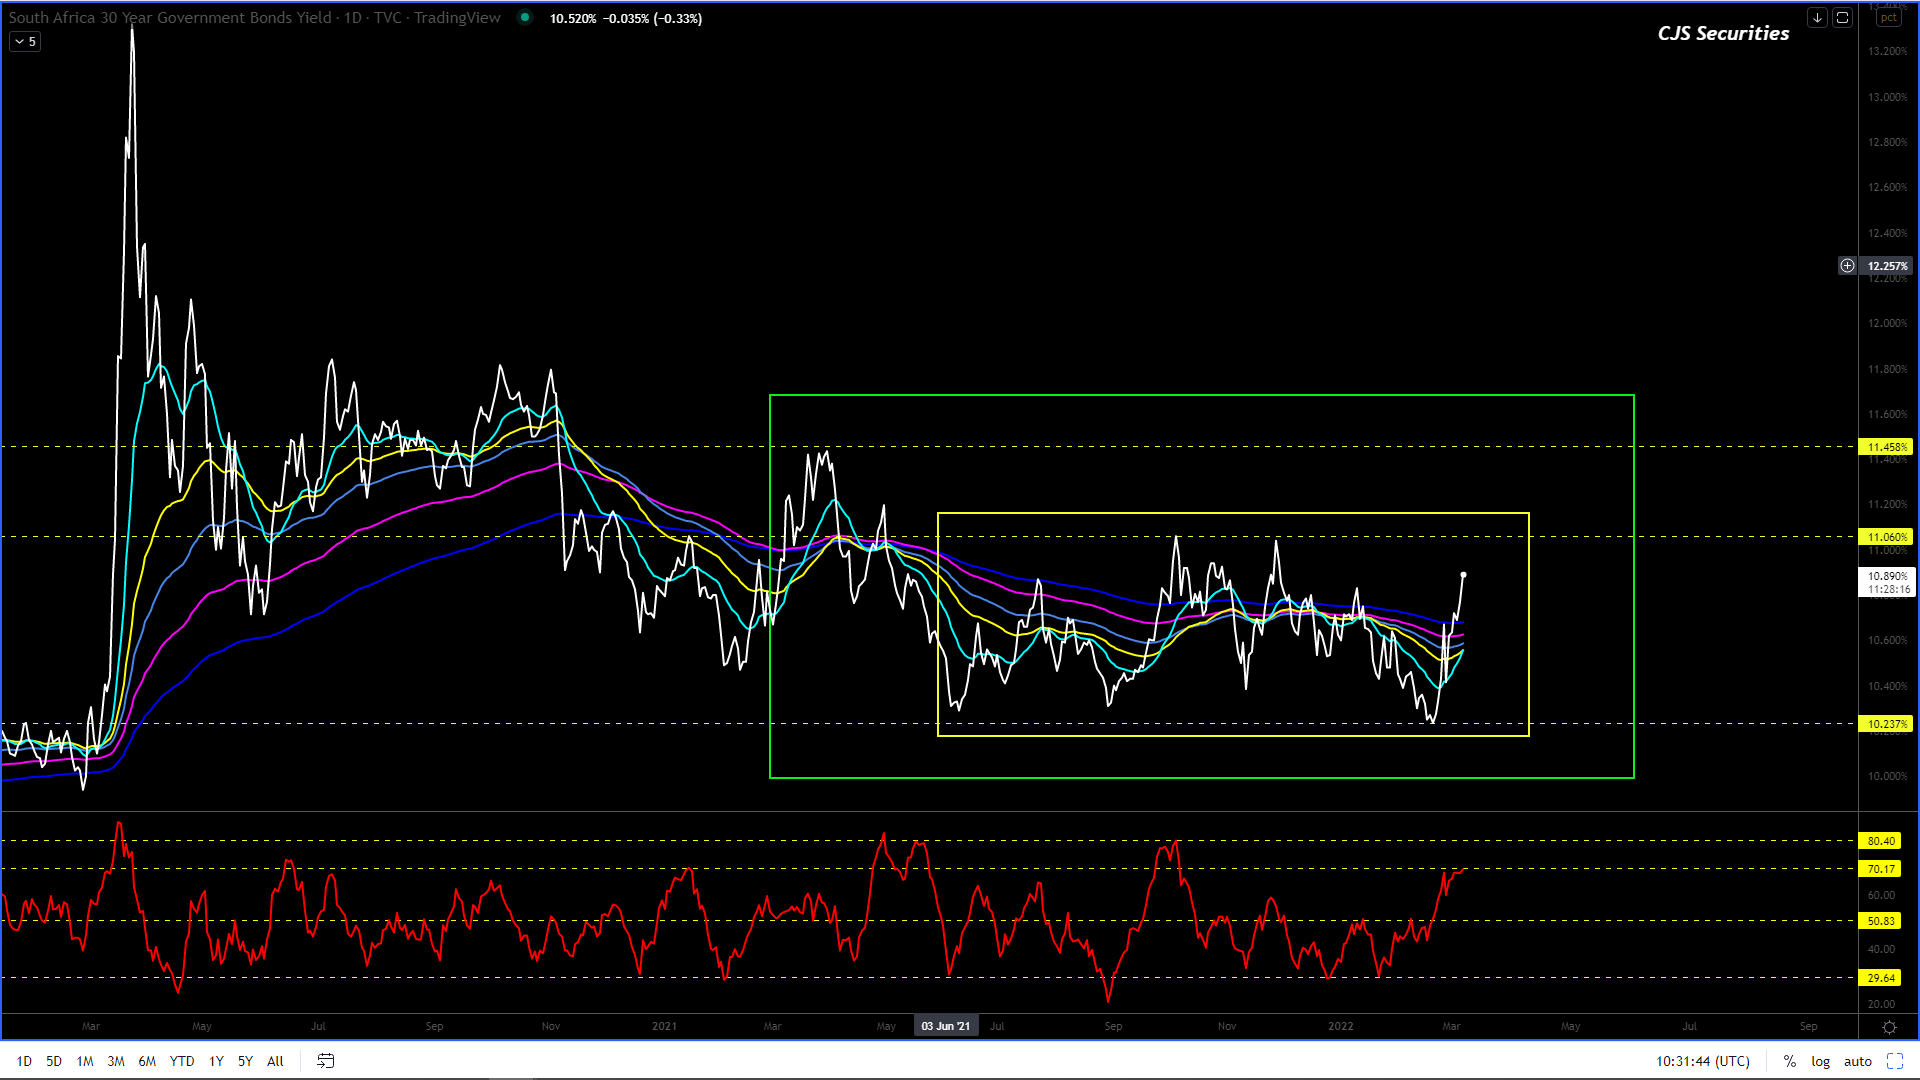
SA Government Bond 30 Year Yield Daily Close
#No Change in commentary
The chart has made a solid base around the 10.30% level.
The chart remains range-bound but we feel the move higher toward the top of the range at 11.40% is on the cards before looking to start a severe leg lower to sub 9.00%.