I have no words for the amount of volatility the ZAR is experiencing within the shortest time frames!
Hope you are all keeping a cool head?
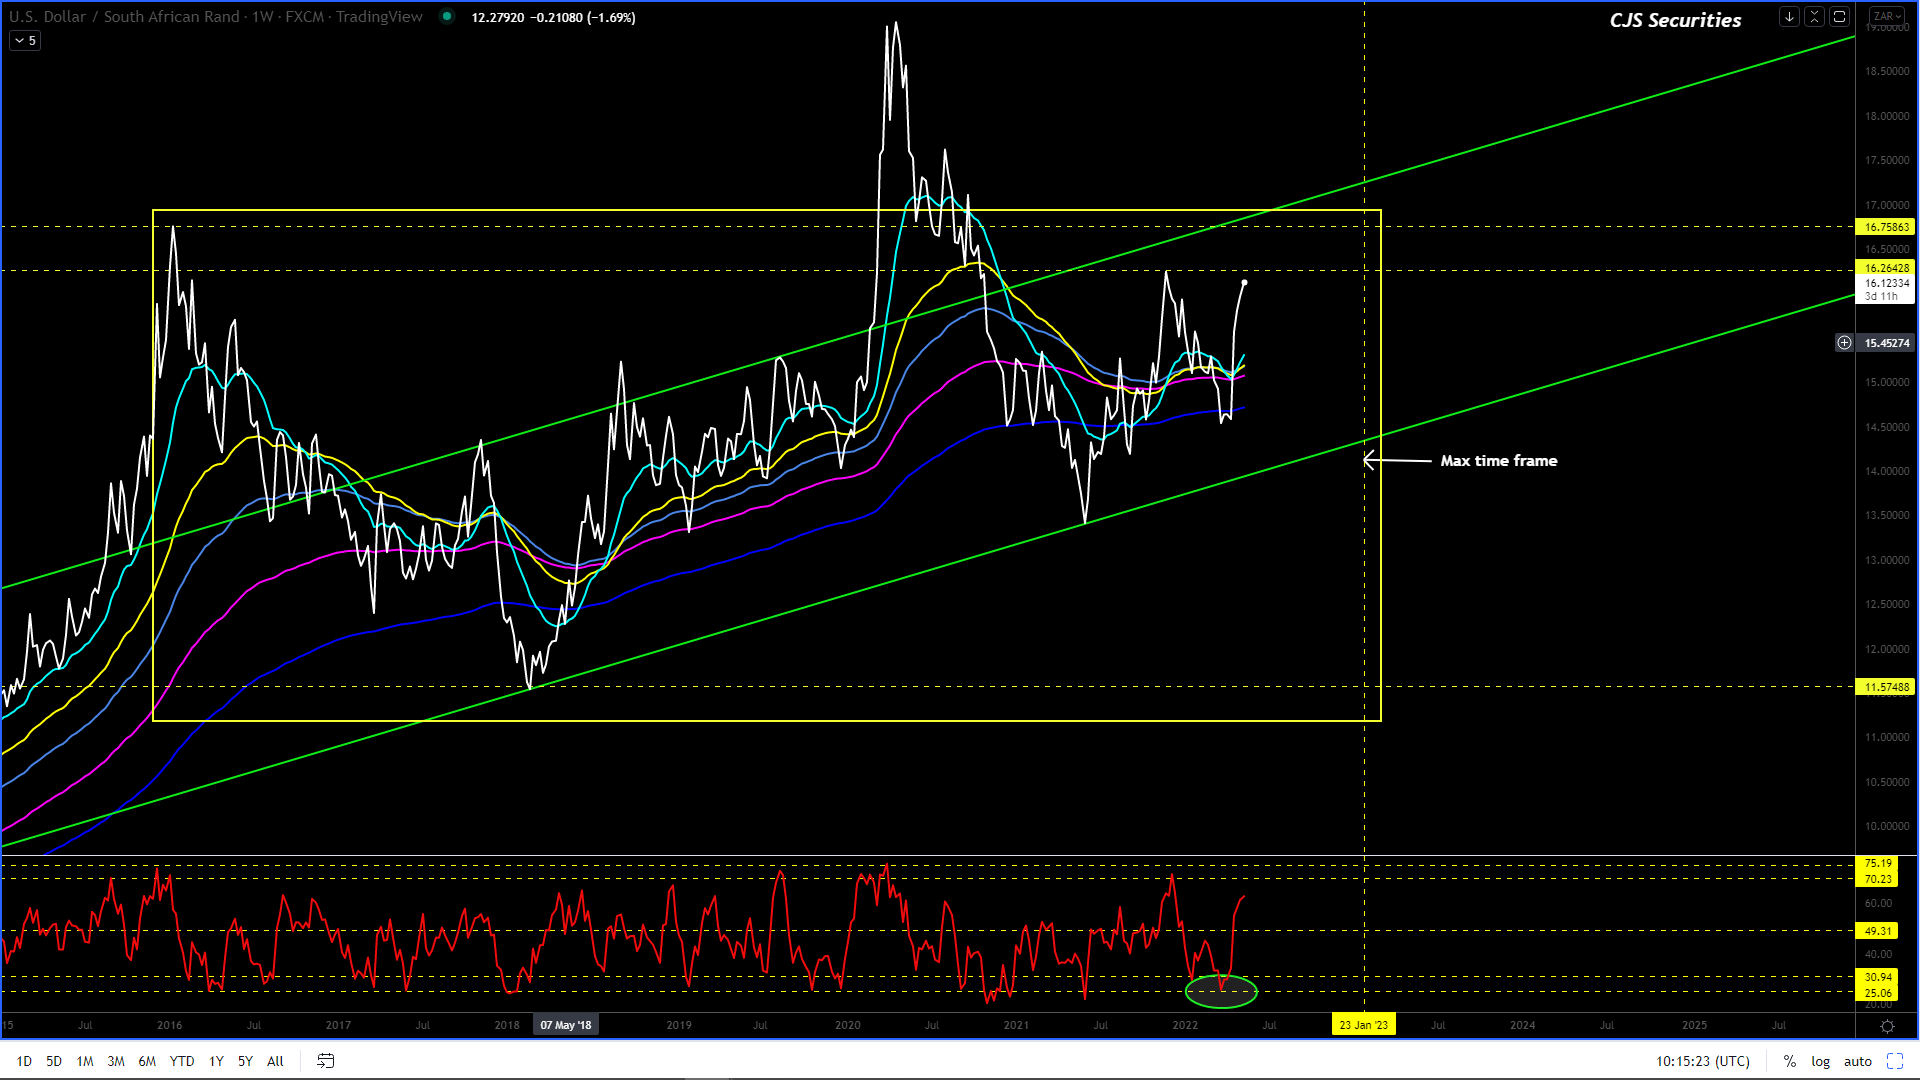
I still see the below taking place over time, with these comments having been posted here for many weeks!
What I see is R11.50 over the next 17 months.
I am convinced that the ZAR is in a multi-year corrective phase vs. the USD and that from today on, all upward spikes on this chart are well worth a short!
This chart could easily have a leg higher and trade toward the R16.77 level in the coming weeks. – I would use this as a USD selling opportunity. – we look well on our way to these levels!
I am happy to be long the Dollar down to the R14.40’s. – this view is playing out brilliantly and we would only take profit at R16.44!
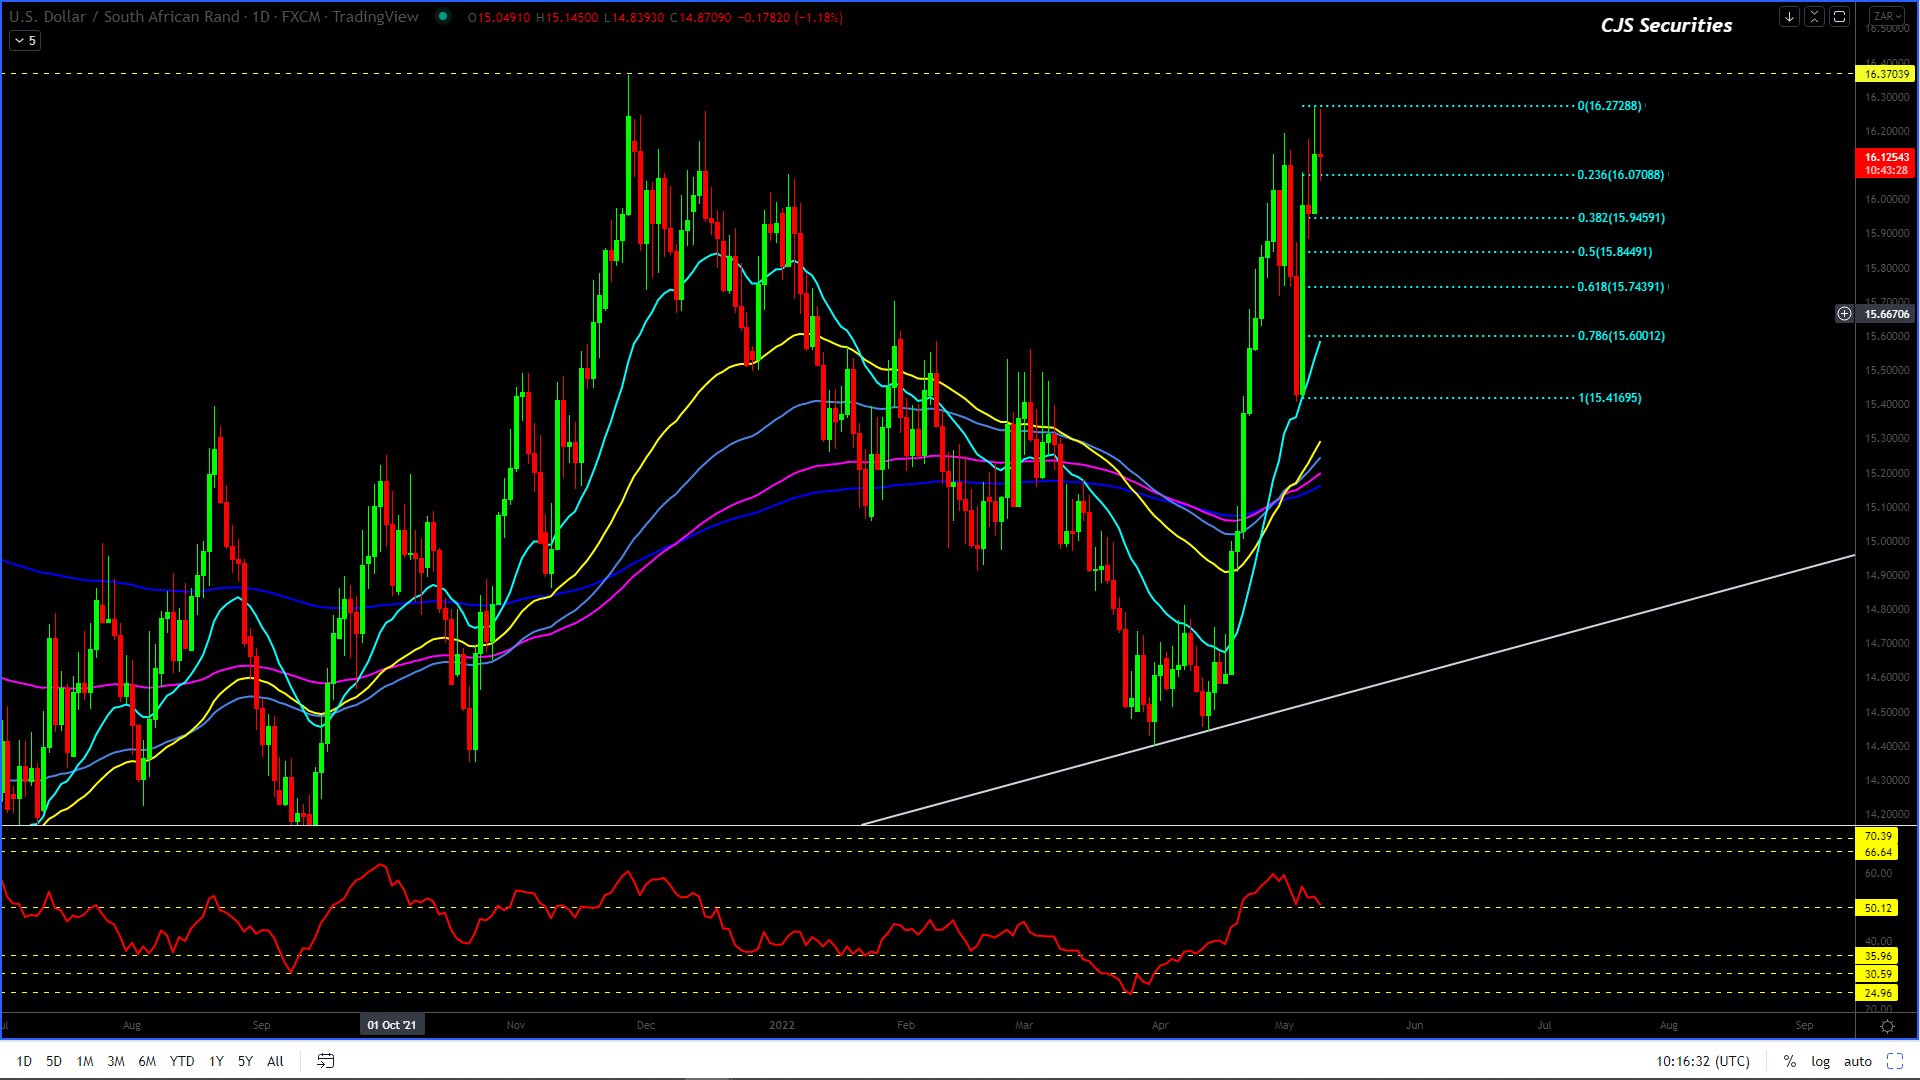
Dollar/Rand Daily Candle
WOW, I am catching my breath after a week’s volatility rarely experienced without significant local political turmoil.
I expect R16.33 to provide some good ST resistance and now that the rally is extending, the pullback level has been raised to R15.56 from R15.30.– this pullback level was spot on!
The last leg higher that I have been waiting for and the one we are currently in could see the chart trade as high as R17.29.
I am sure should this transpire, the pundits will be screaming for R22.00 and above, do not get sucked in as we could turn around at anytime and this remains my LT view that once this leg higher is done we will strengthen significantly.
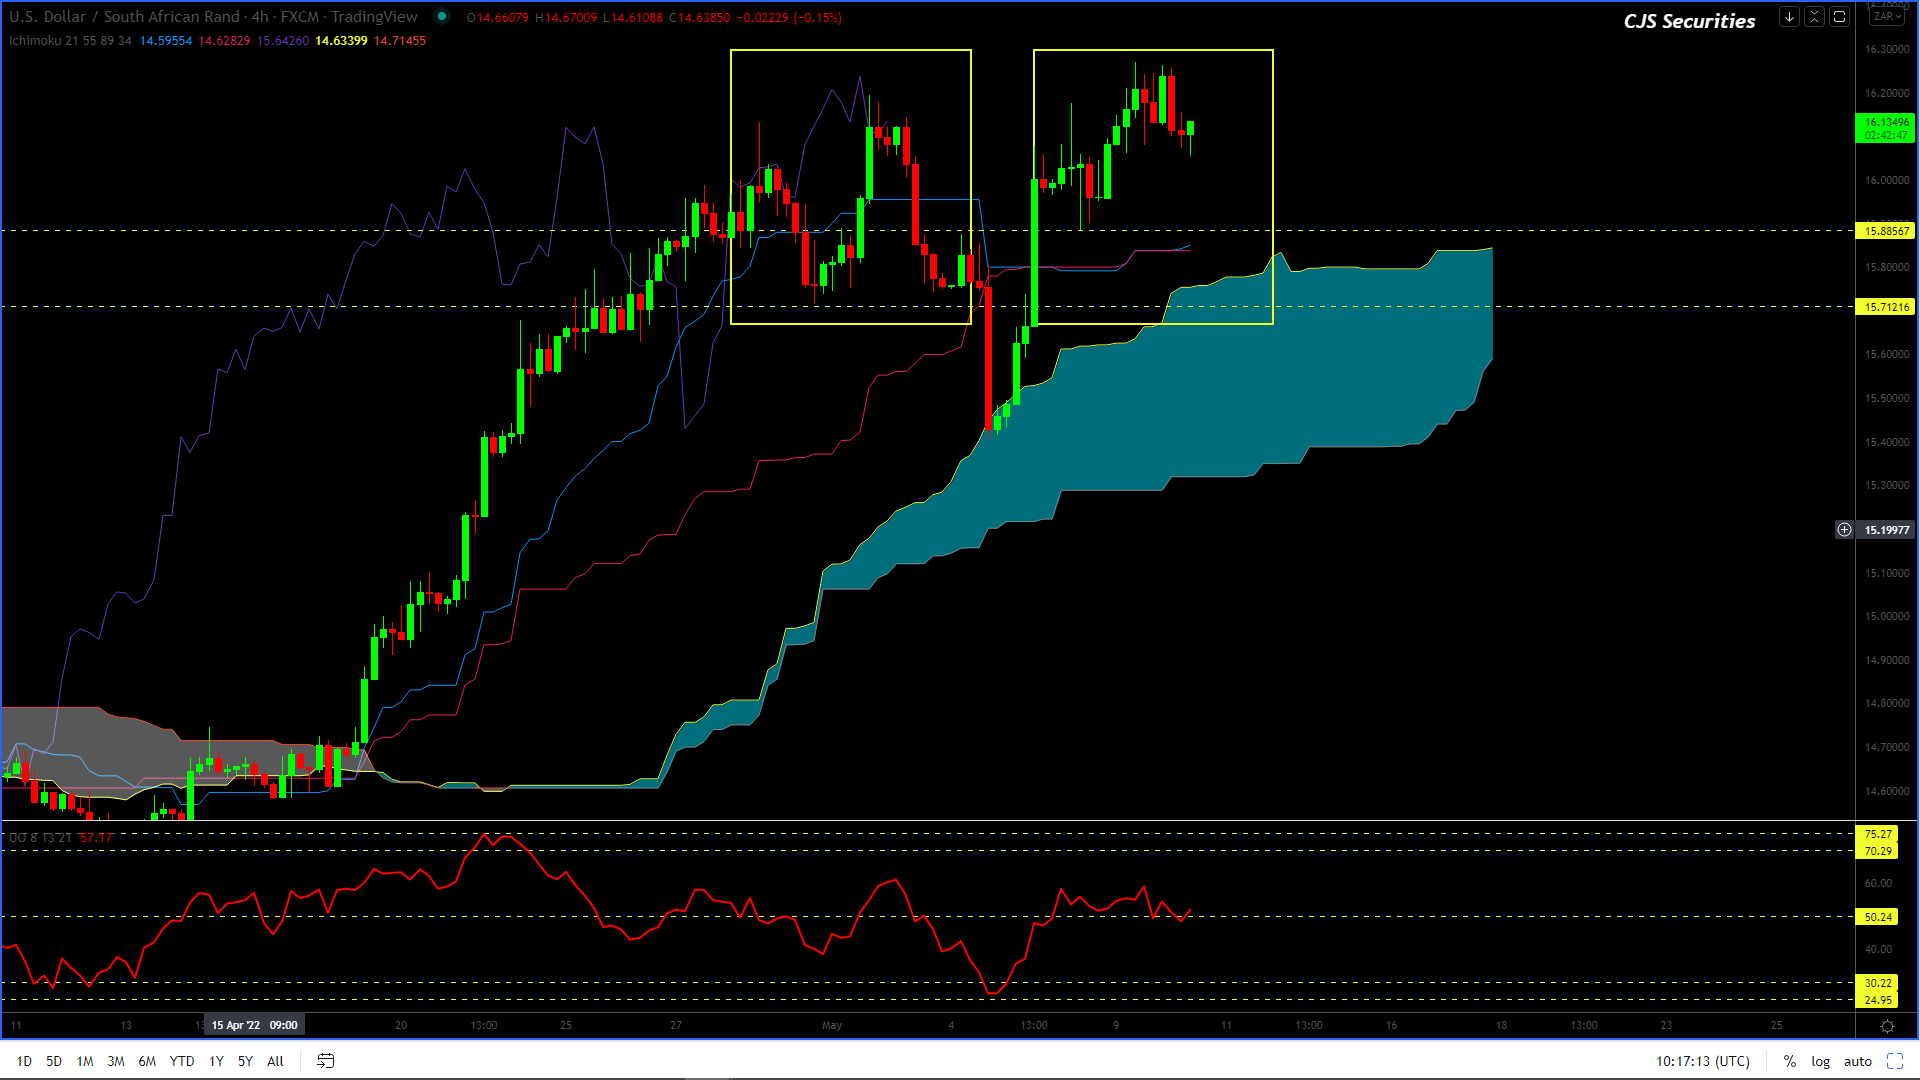
Dollar/Rand 240 min Candle
We have had to move the pullback level up to R15.71 – R15.56 due to the extended rally. We would most certainly look to buy a pullback! – traded as low as R15.41 and we are now long and looking to sell at R16.44.
This chart is super bullish and should it have another pullback from R15.88 – R15.70, the chart will have formed a massive inverted H&S and this would be considered another massive buying opportunity!
Euro/USD Weekly Close
#No Change in Commentary
This chart is on a tear but does have some really good support around $1.0452.
The chart is oversold on a Weekly basis and this combined with the support would rather have me square here.
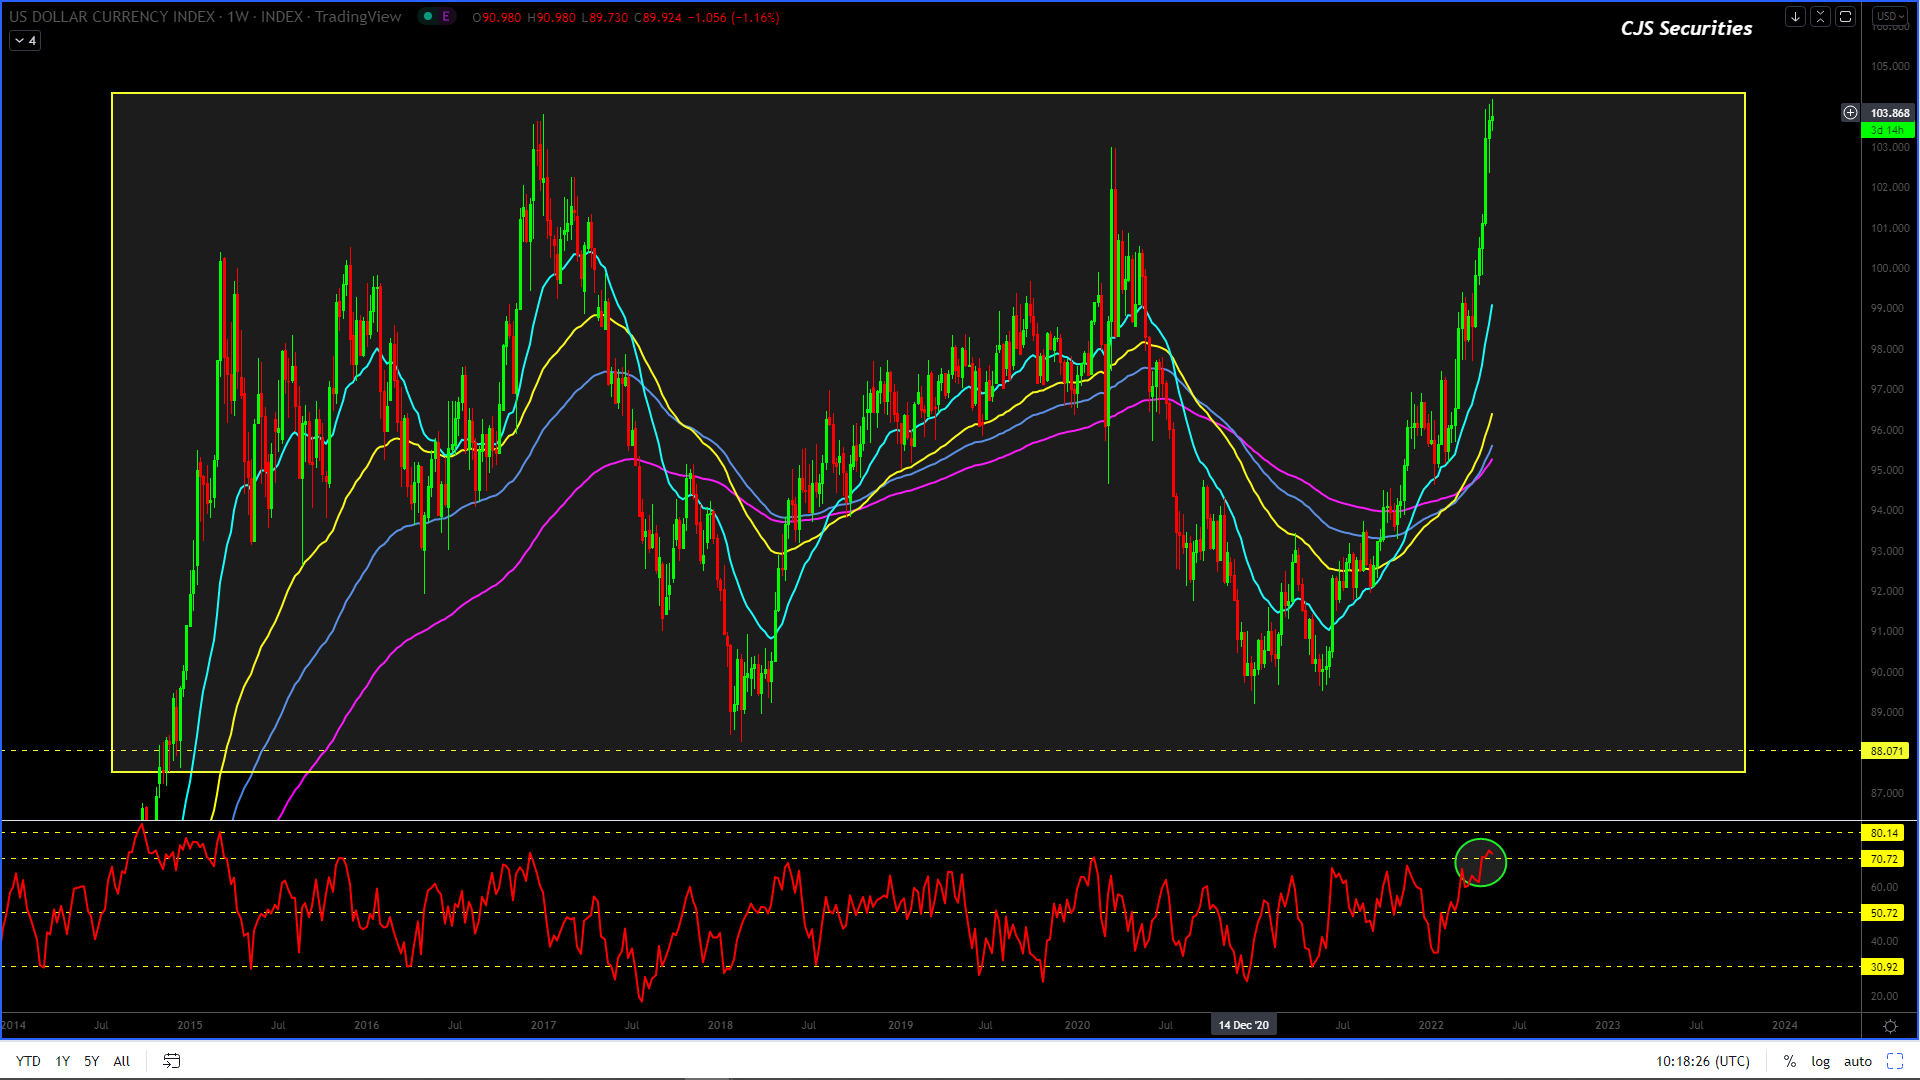
US Dollar Index Weekly Candle
#No Change in Commentary
New highs last witnessed 16 years ago, wow!
All I can say is that this chart is now grossly overbought but that I would not pick tops!
SA Government Bond 30 Year Yield Daily Close
The chart remains range-bound but we feel the move higher towards the top of the range at 11.40% and even as high as 12.00% is on the cards before looking to start a severe leg lower to sub 9.00%.The chart remains range-bound but we feel the move higher towards the top of the range at 11.40% and even as high as 12.00% is on the cards before looking to start a severe leg lower to sub 9.00%.
US Government Bond 30 Year Yield Weekly Close
This chart remains
grossly overbought.
This combined with the
need for a pullback and potential divergence, screams stay out for now!