The speed at which
this market moves would even have Max Verstappen struggling to keep up.
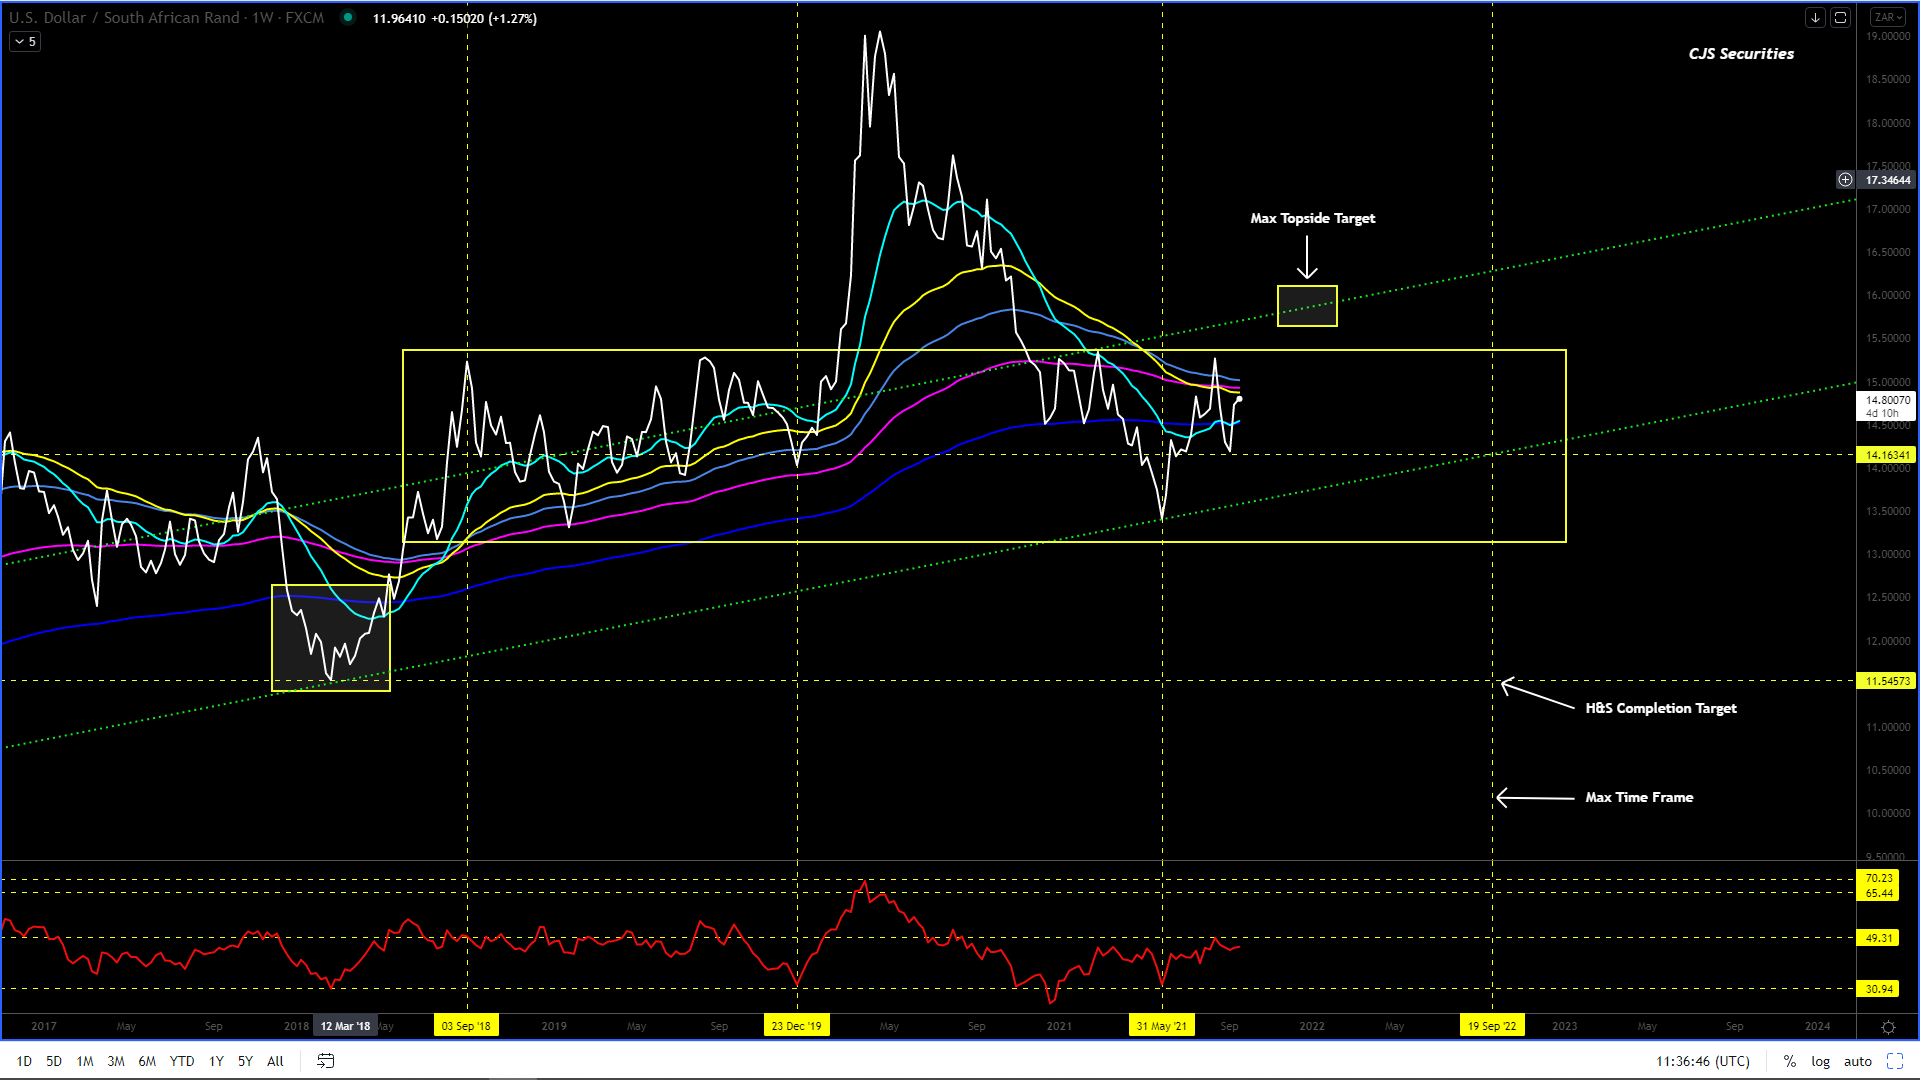
The chart has now
failed to the upside as well, as the downside with the ranges remaining
MASSIVE!
The possibility still
exists that we have another leg higher to the R15.86level, and after thinking it was a low probability,
the chart now has made an inverted H&S formation within a much bigger
H&S formation with the latter having a target at R11.77.
Good luck out there,
these markets are all wild, focusing on preserving capital and live to fight
another day!
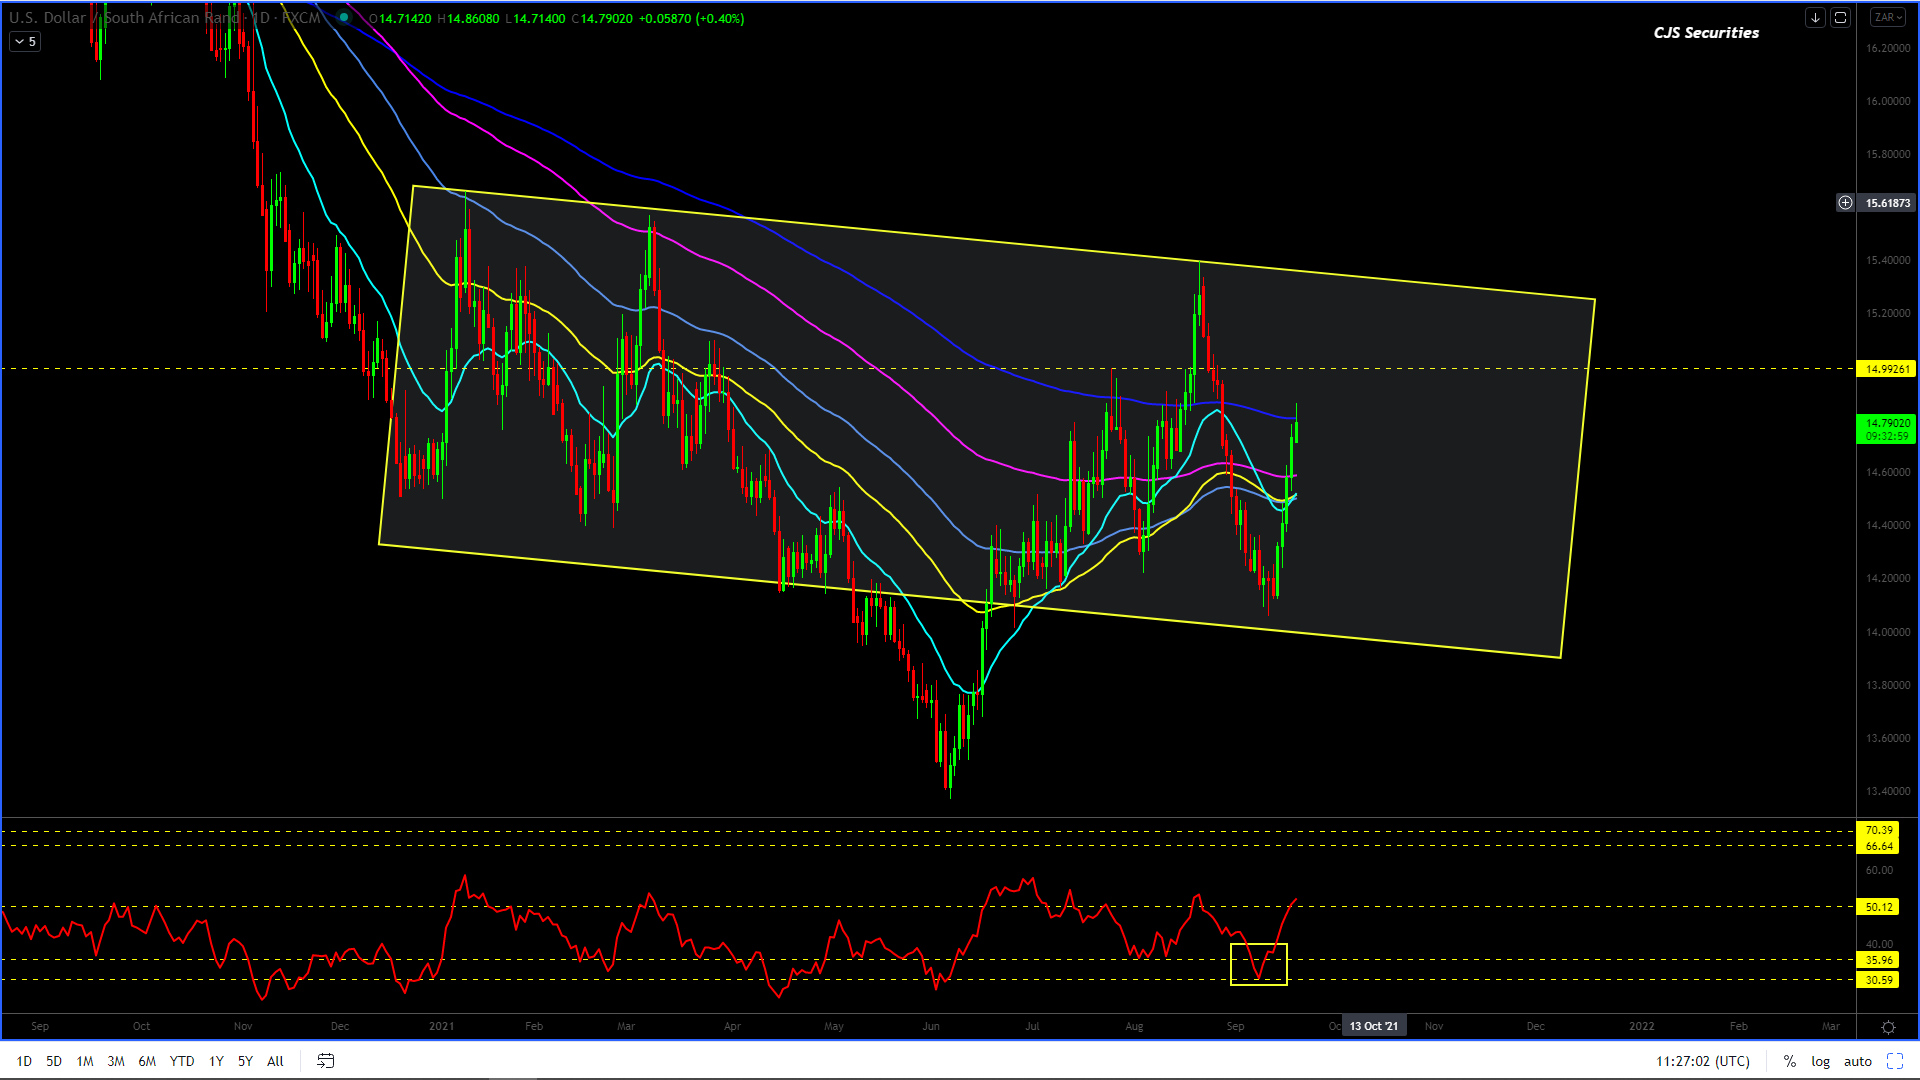
Dollar/Rand Daily Candle
Straight down followed by straight up, I can’t catch my breath, let alone form a solid view.
With this chart making a decent inverted H&S, Scenario #2(from 3 Mondays ago) is still on the cards.
Scenario #2.
The current formation is an irregular flat bear correction that trades back to the R14.20’s, then trades up hard and fast to print between R15.70 – R15.86 to complete the correction while getting everyone and their dog long USD, only to collapse and come down to test the yearly lows and possibly print as low as R11.50.
Both scenarios will have one wondering because after the ferocity of last week’s fall, there is very little confidence in this chart.
Only a daily close over R15.62 would negate scenario #2.
As with the weekly chart, I would not hold any position now for more than R0.30.
Please don’t wipe yourself out as there will still be plenty of opportunities to come before year-end.
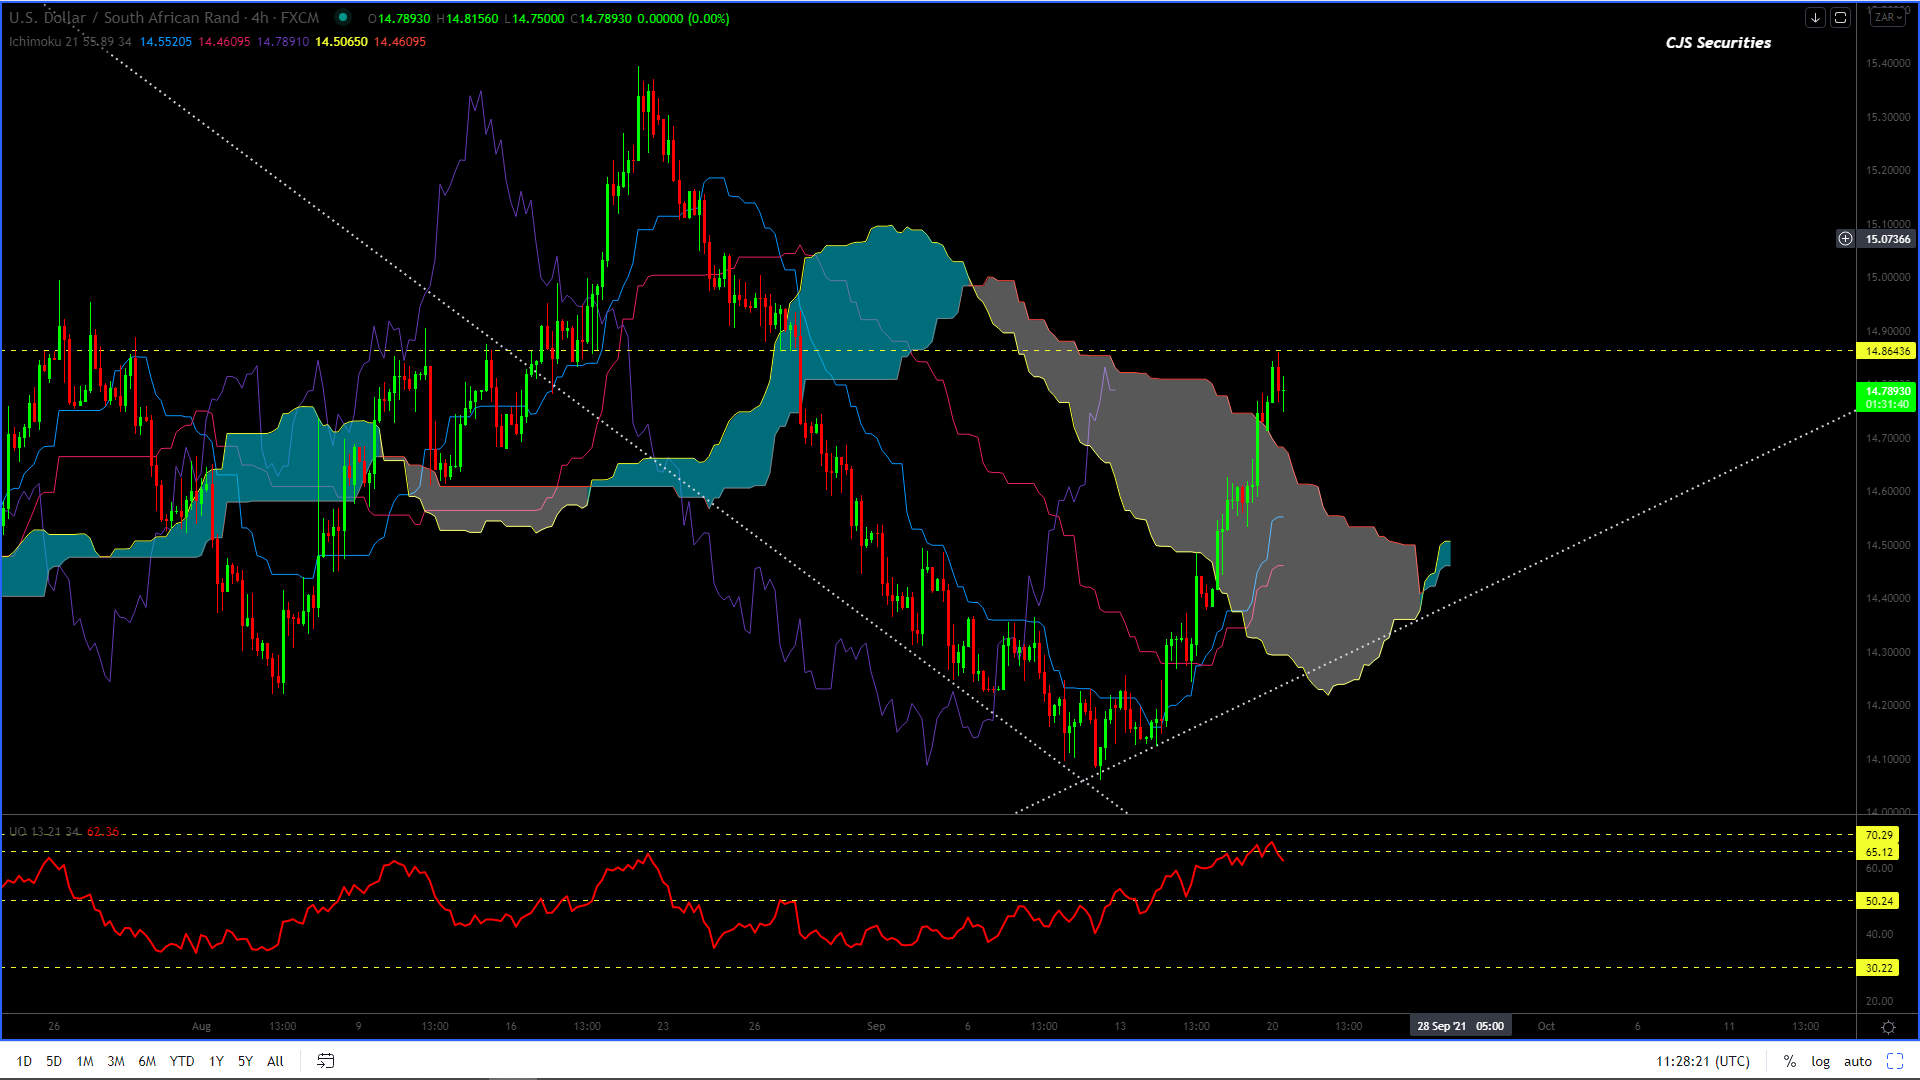
Dollar/Rand 240 min Candle
After a massive rally
there is potentially another R0.15 – R0.20in it, but overall I feel like R15.00will provide
some much need resistance and allow us all to take stock of what we have seen.
All time frames seem to
have decent resistance between R14.80 – R15.03.
I can see no trade
here worth taking and would strongly advise staying out until further notice.
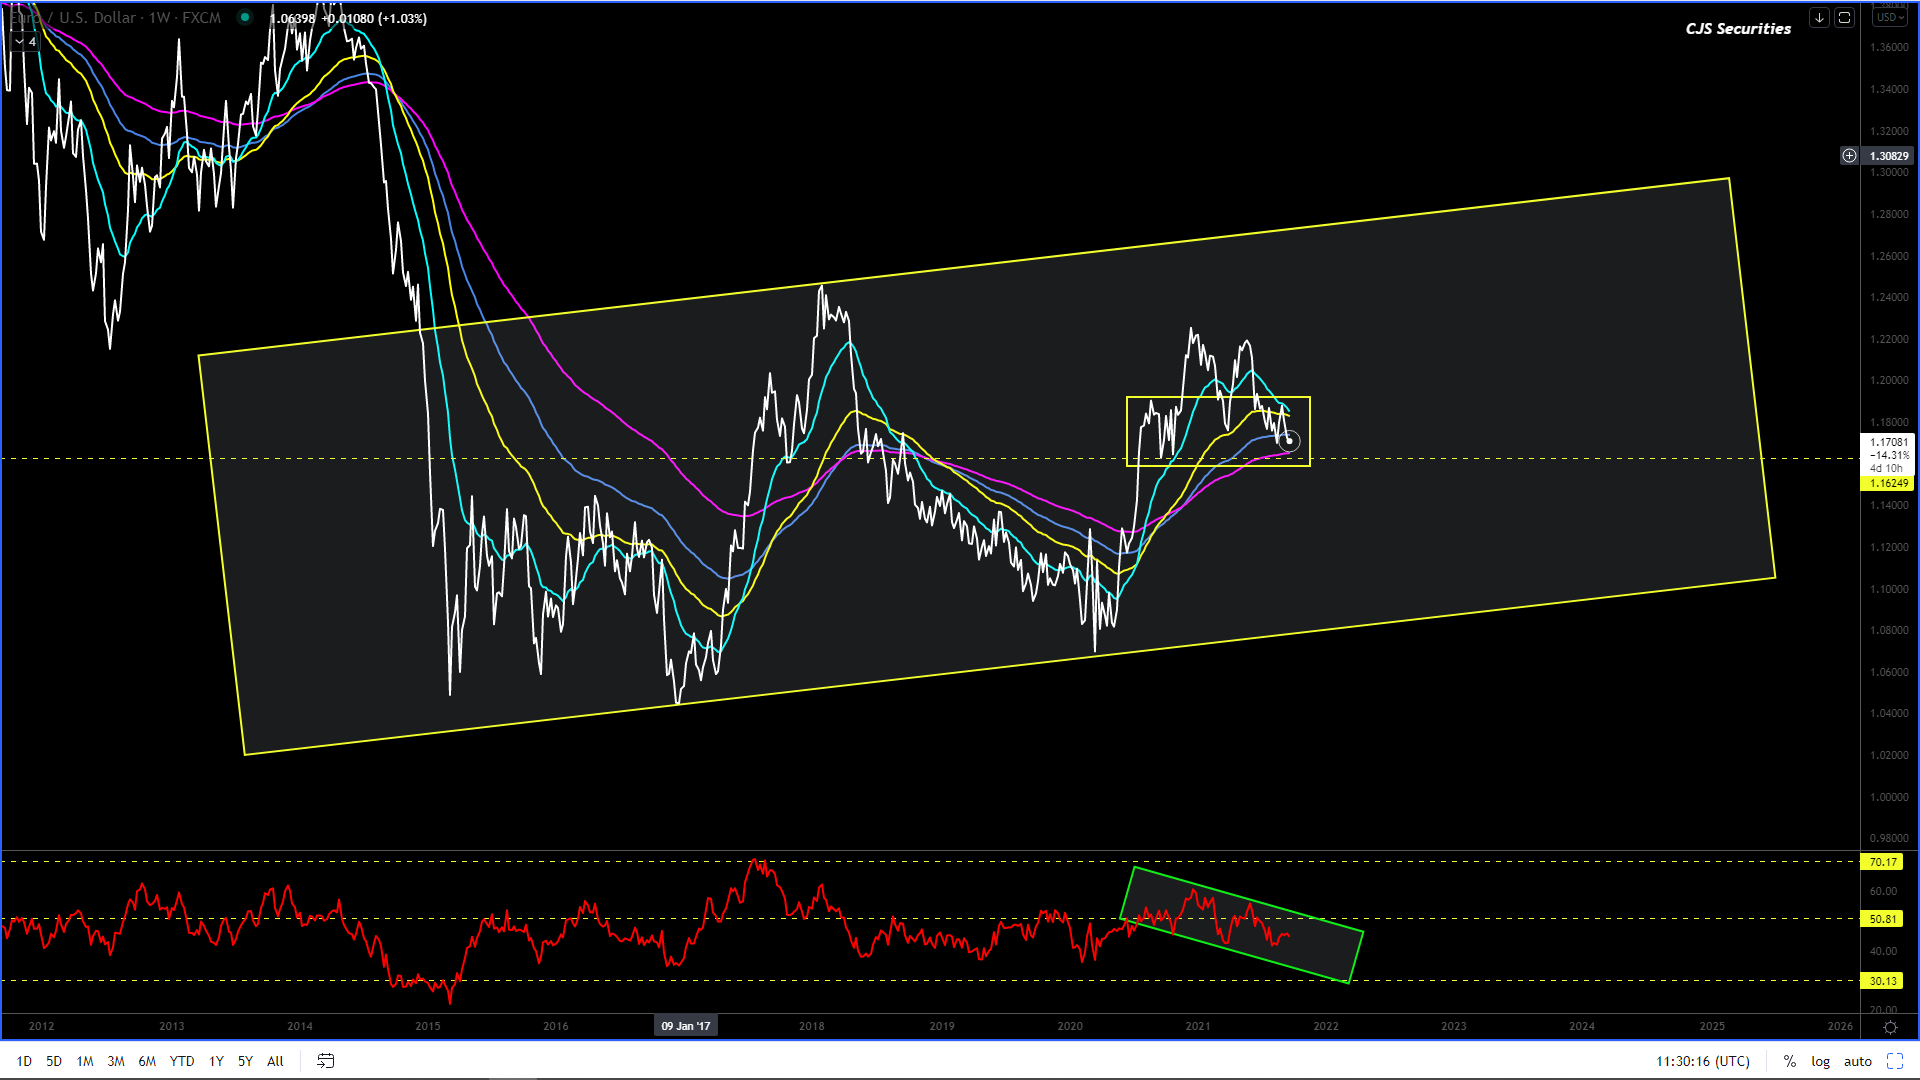
Euro/USD Weekly Close
The $1.16 level is in line with the 144 week EMA and holding tight.
I still like a move higher but I expect a move towards the $1.1650 level before going higher.
The general view is now long the EURO until we have a daily close under $1.16!
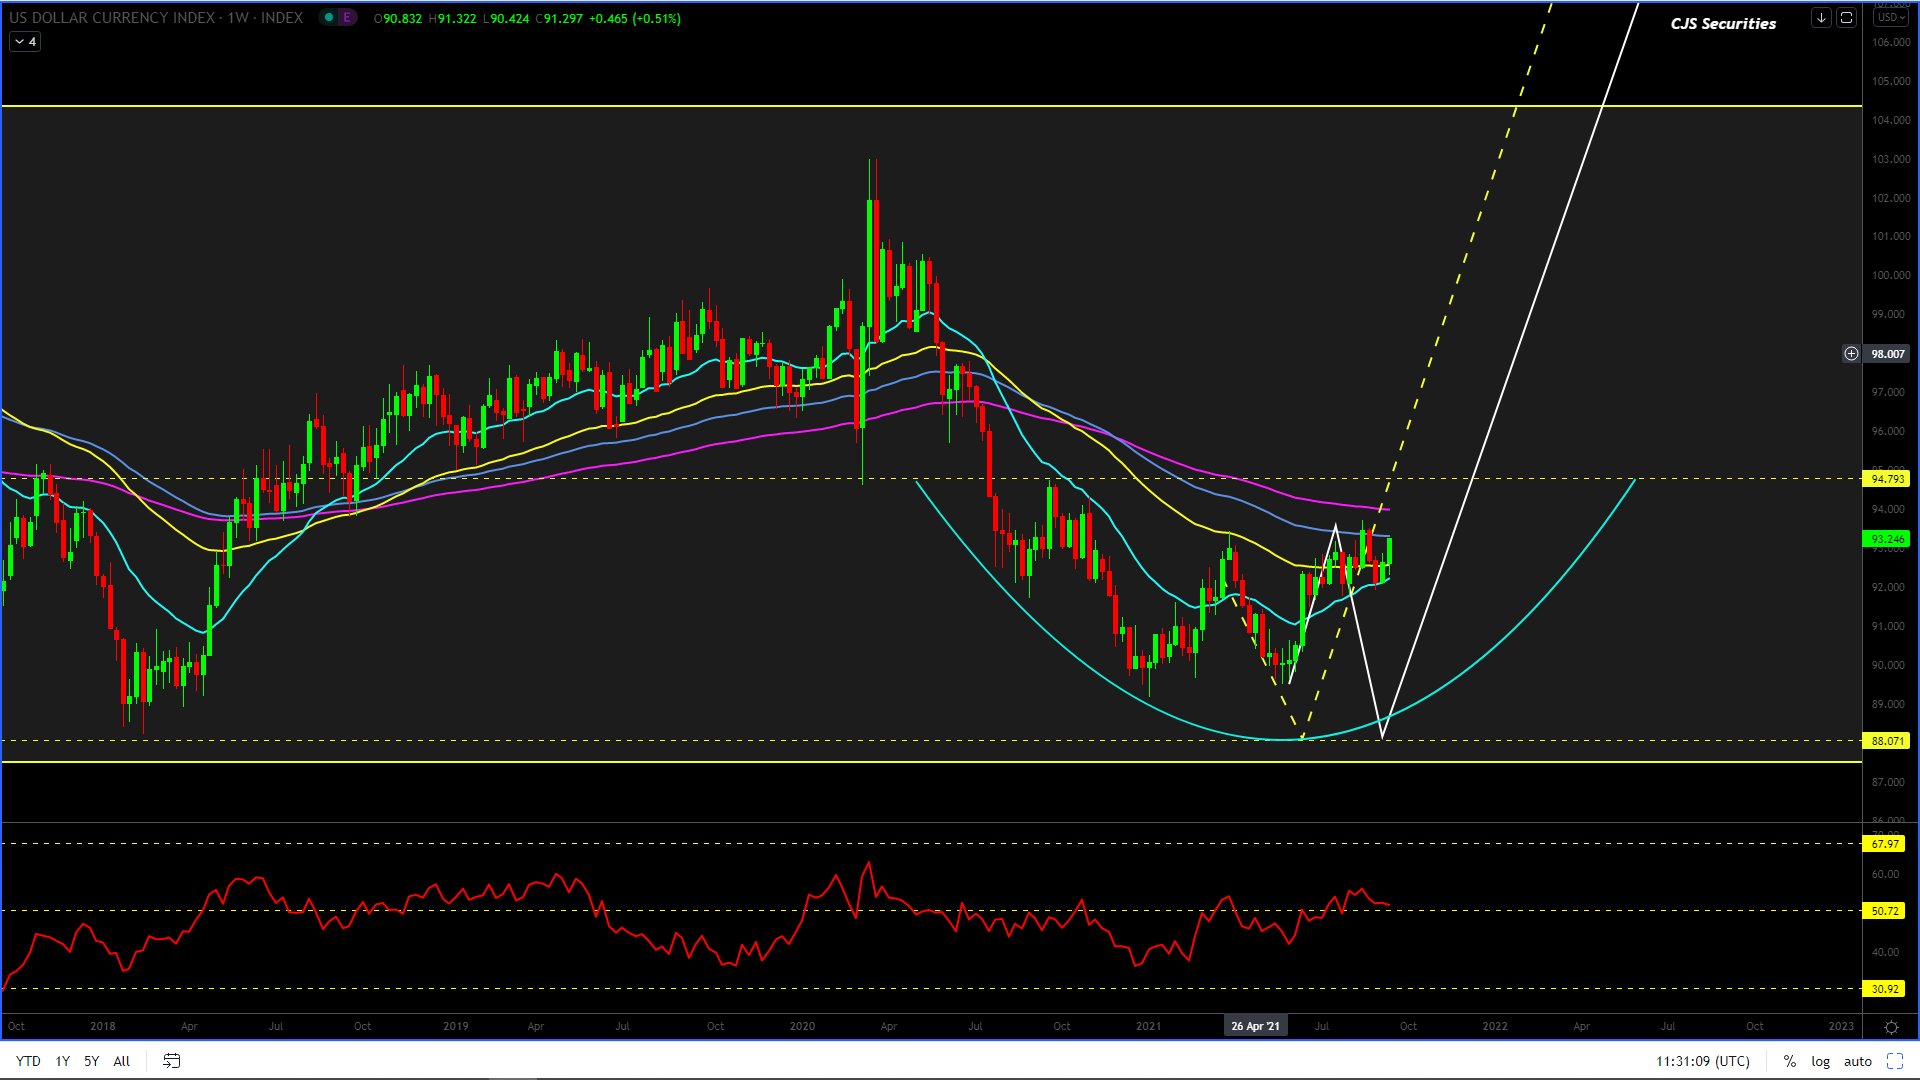
US Dollar Index Weekly Candle
This chart gives me the feeling of whiplashing in size within a small range and all I want to say to myself is DON’T DO IT!
The range is 95 -88 and a dip is a buy of note while a rally and daily close over 95 would aslo get me long also and until then we will sit on our hands and wait!
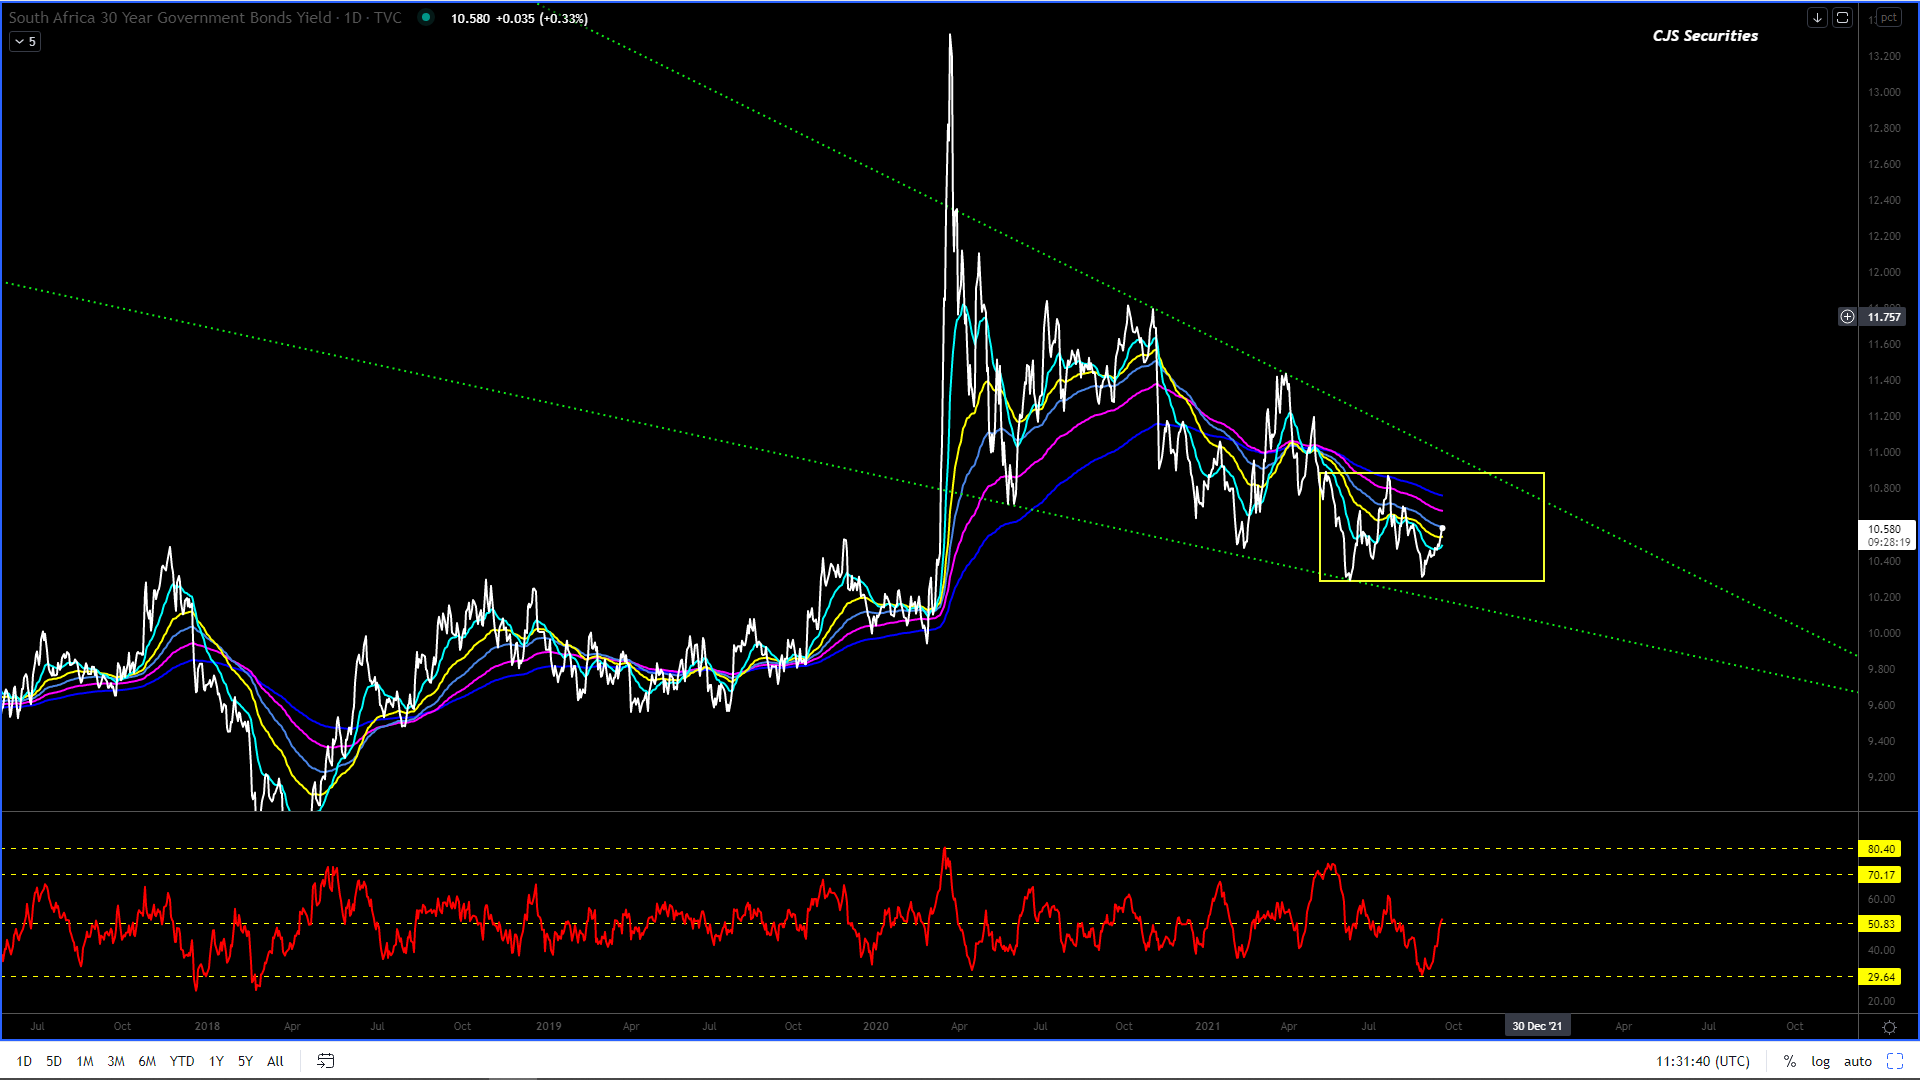
SA Government Bond 30 Year Yield Daily Close
#No Change in Commentary
This 10.30% level is sticky as hell, but if it does not hold, then there will still be a decent amount of downside in this chart over the next 12 months.
The ending diagonal formation will be off the table under 10.20%, and right now, I must confess that 9.22% looks very much on the charts.
Having said all of the above, don’t panic!
The chart is now oversold but can continue lower before kicking, but overall, I would expect a kickback to 10.90% before printing the 9.22%, so you should have time, at least I hope so! – ‘I truly hope this ages well.’
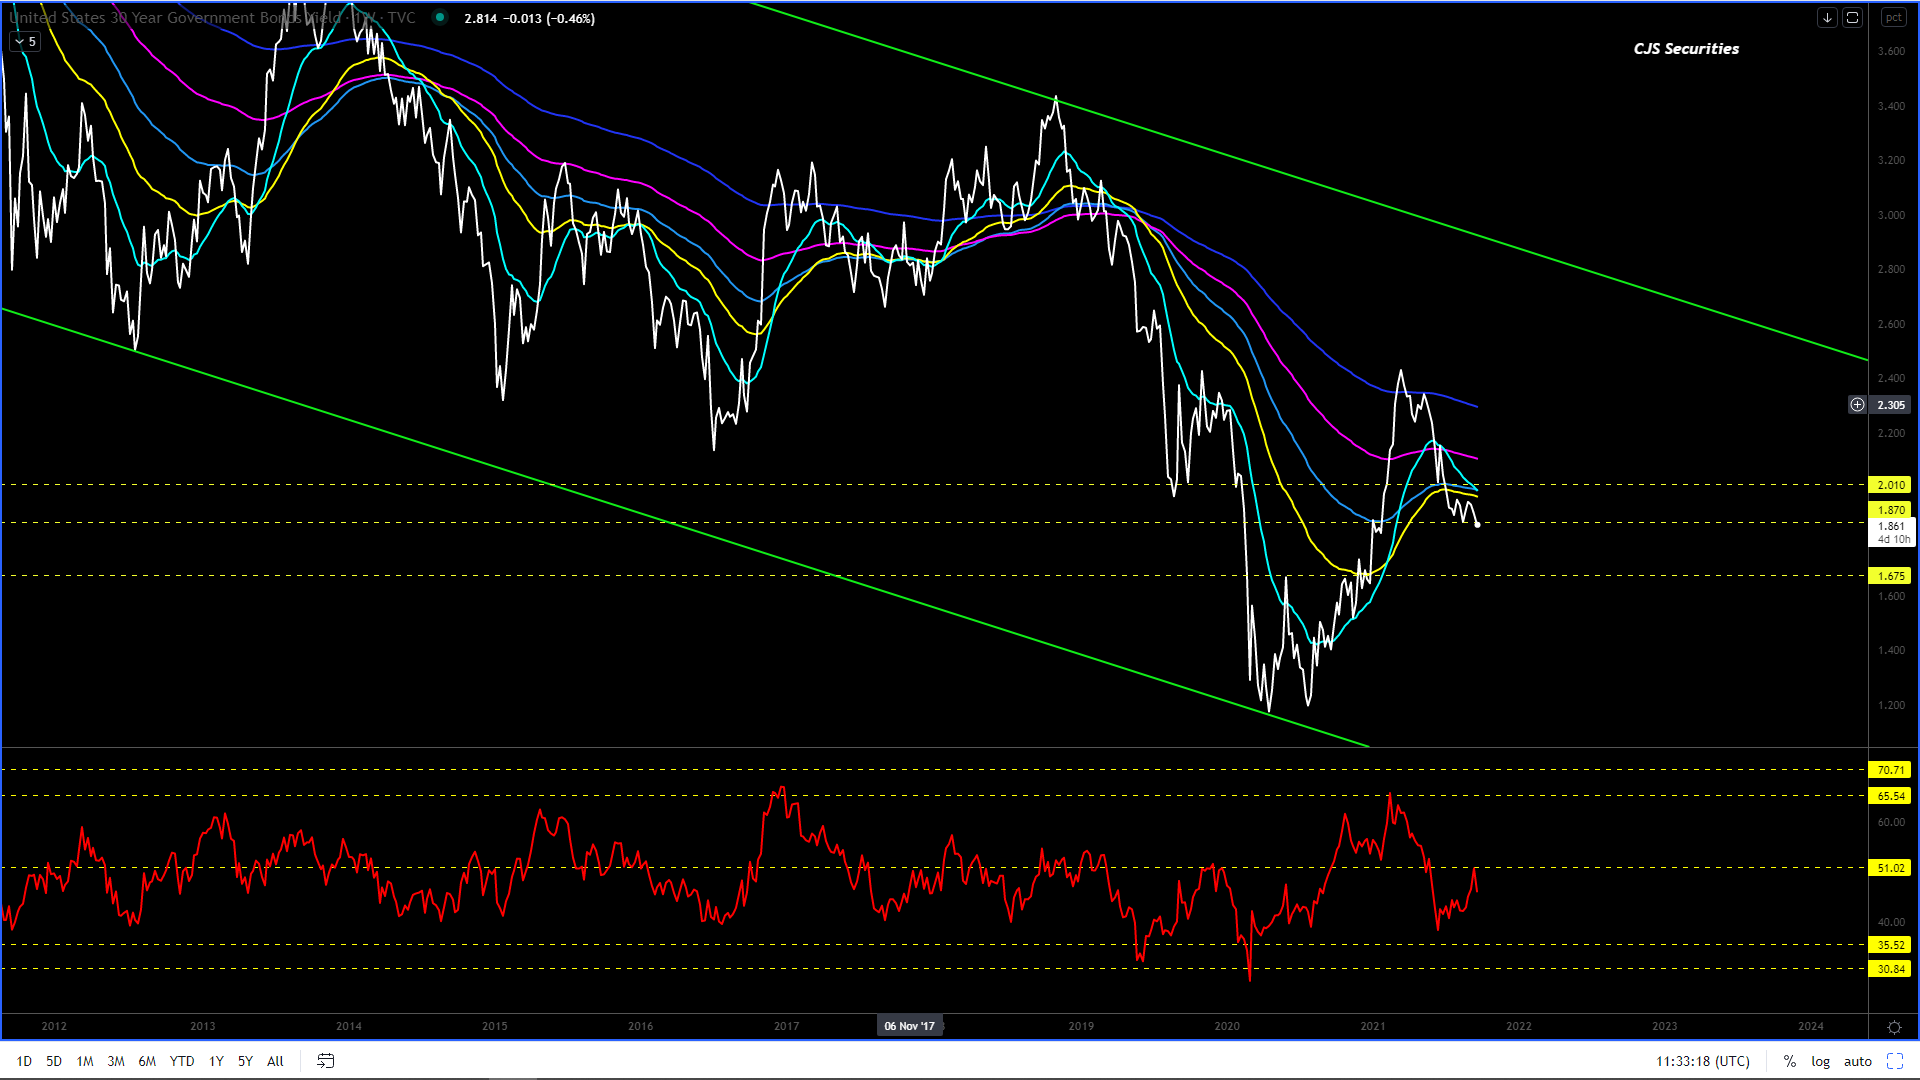
US Government Bond 30 Year Yield Weekly Close
#No Change in commentary.
I would look at buying a move back to 1.90% – 1.80%that will have upside targets from 2.58% – 2.71%.
Use an SL under 1.70%.
Please note that only a weekly close of over 3.50% will confirm that the trend has been broken.