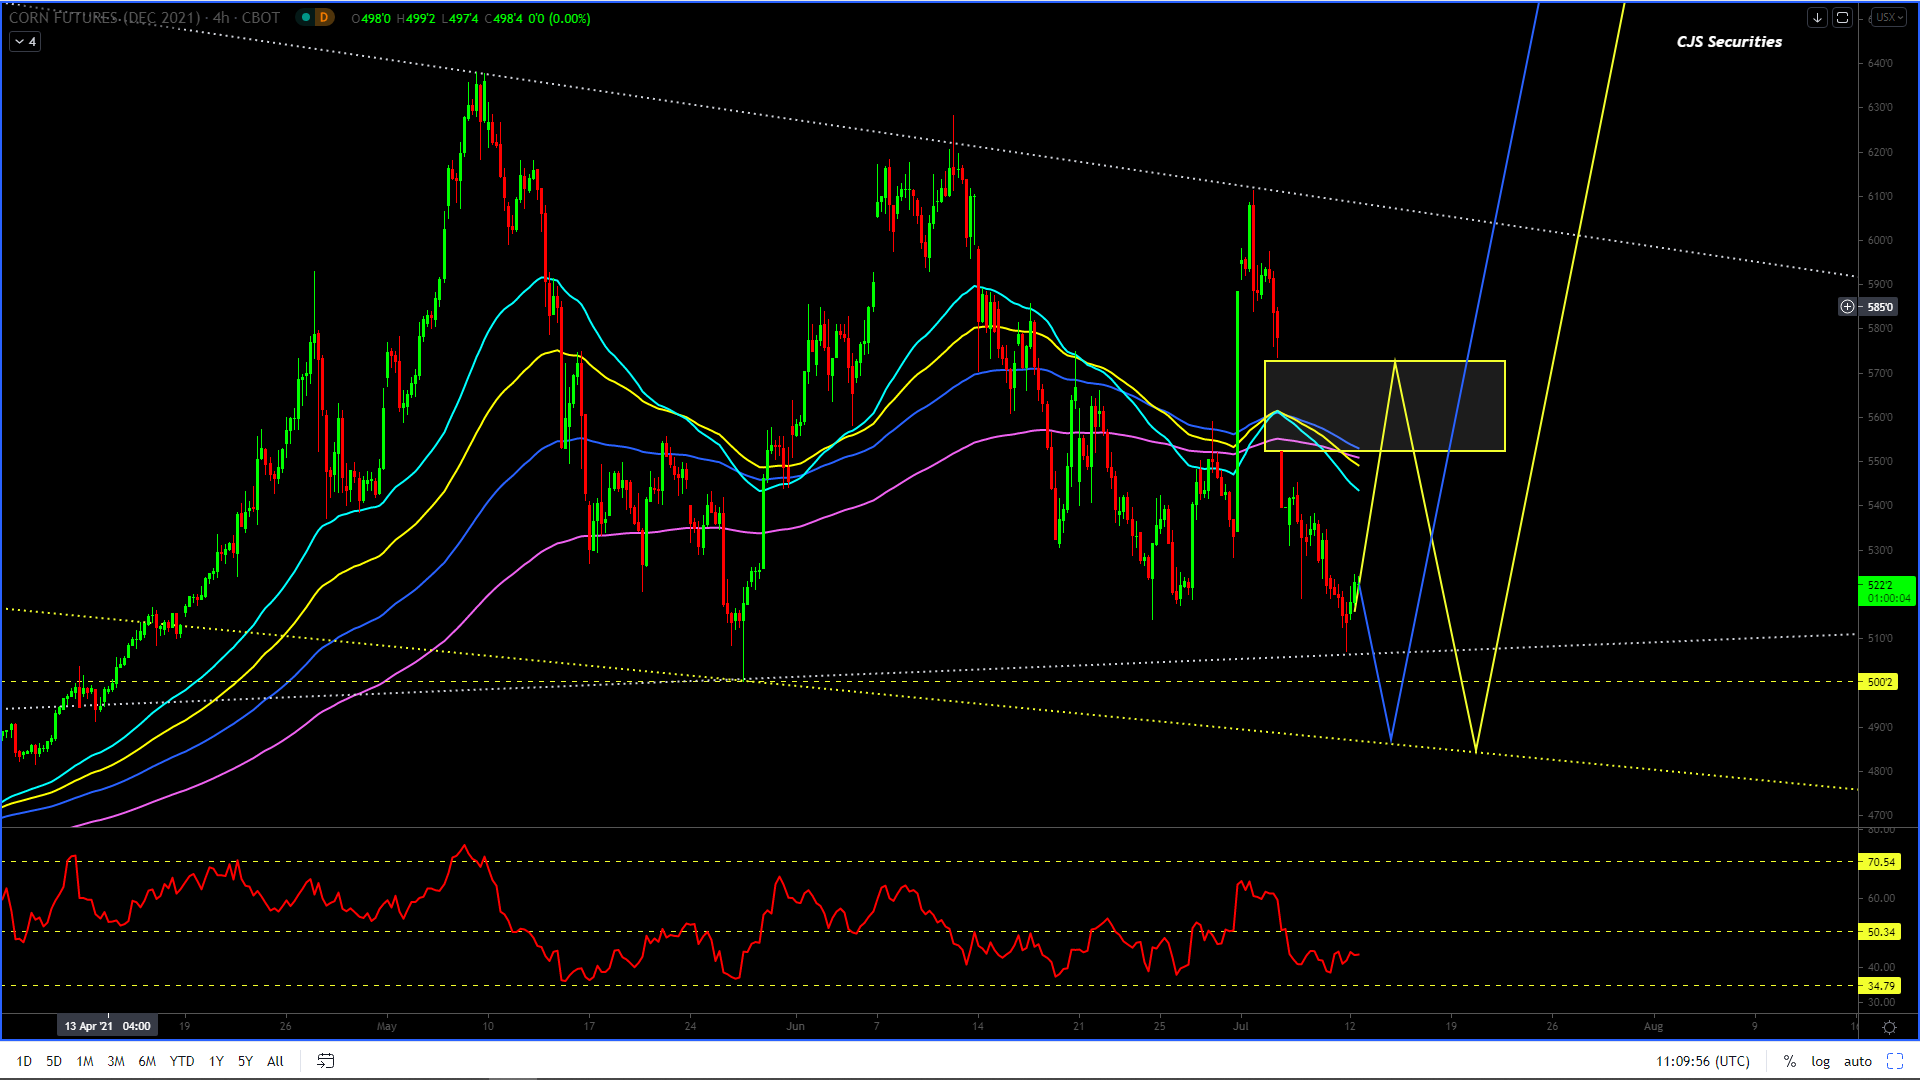
This chart has traded lower and made a 50% retracement of the whole rally, which has some people concerned about the end of the Bull story.
I would only consider the Bull story to be over should we have a Weekly close under $4.56.
Until then, all the deep dips are buying opportunities.
Due to the deeper pullback, the upside target should be lowered.
But the length of the correction will depend on how violent the rally is!
The rallies remain selling opportunities (profit taking) and buy the dips (getting long)!
240 Min December 21 Corn Candle Chart Close
Volatility is here to stay no matter which road map plays out, either the Triangle or ABC correction.
The dips and ‘if” there is a dip on the WASDE today would be an excellent ST / MT buy as the size of that gap is more significant than the Grand Canyon!
I would add to the longs I put on under $5.20, even if this position is to only close the gap!
I remain a proponent of BTD’s and take cash on the rallies!.
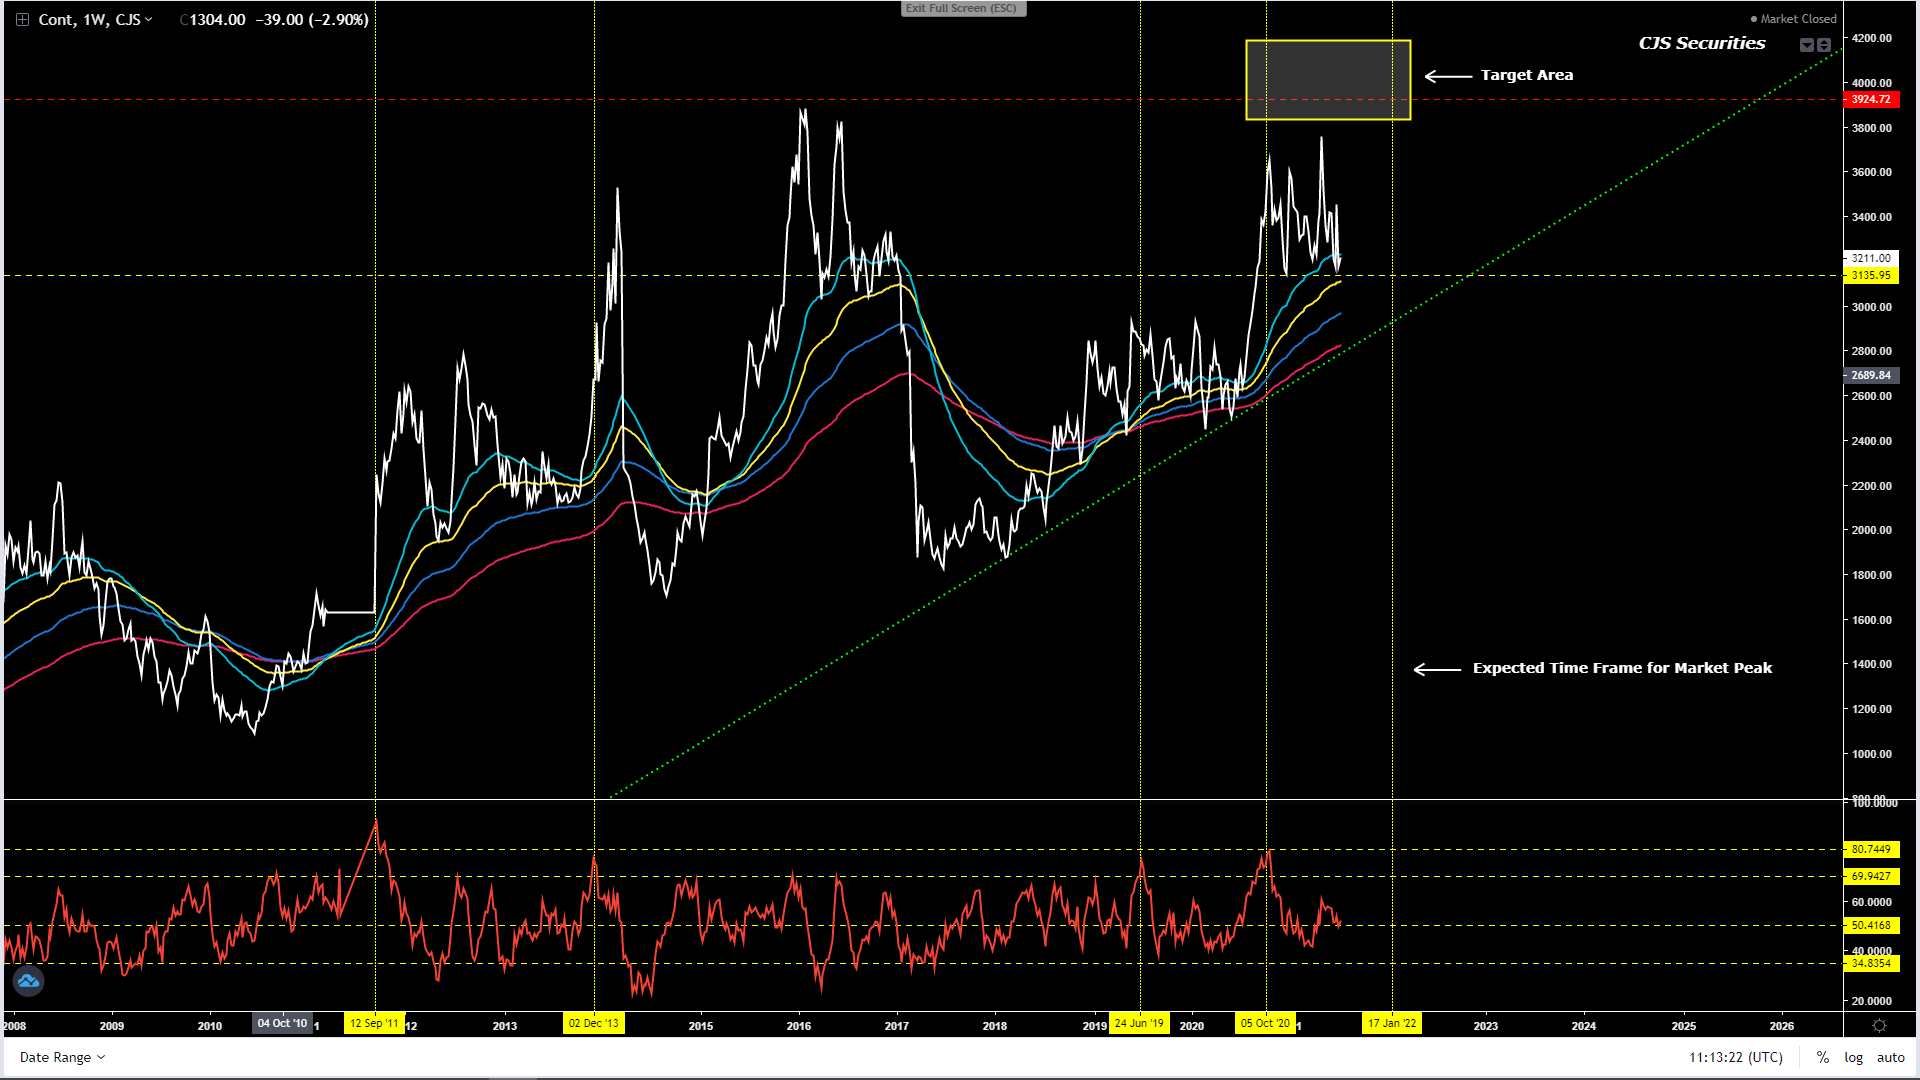
Weekly WM Continuous Close
This chart has made a perfect 38.20% correction, and although it has come back the chart is yet to take out the lows.
Continue to use the weakness to price, price & price some more with potential targets over R4000.
Weekly YM Continuous Close
After significant support at the 38.20% retracement, I REMAIN keen to buy all the dips!
The chart is in a corrective phase and looking to break out to the upside.
“Note I am not sure which expiry, but these charts lead me to believe that WM will rise like a Phoenix from the ashes to meet YM!” – starting to age better this is!
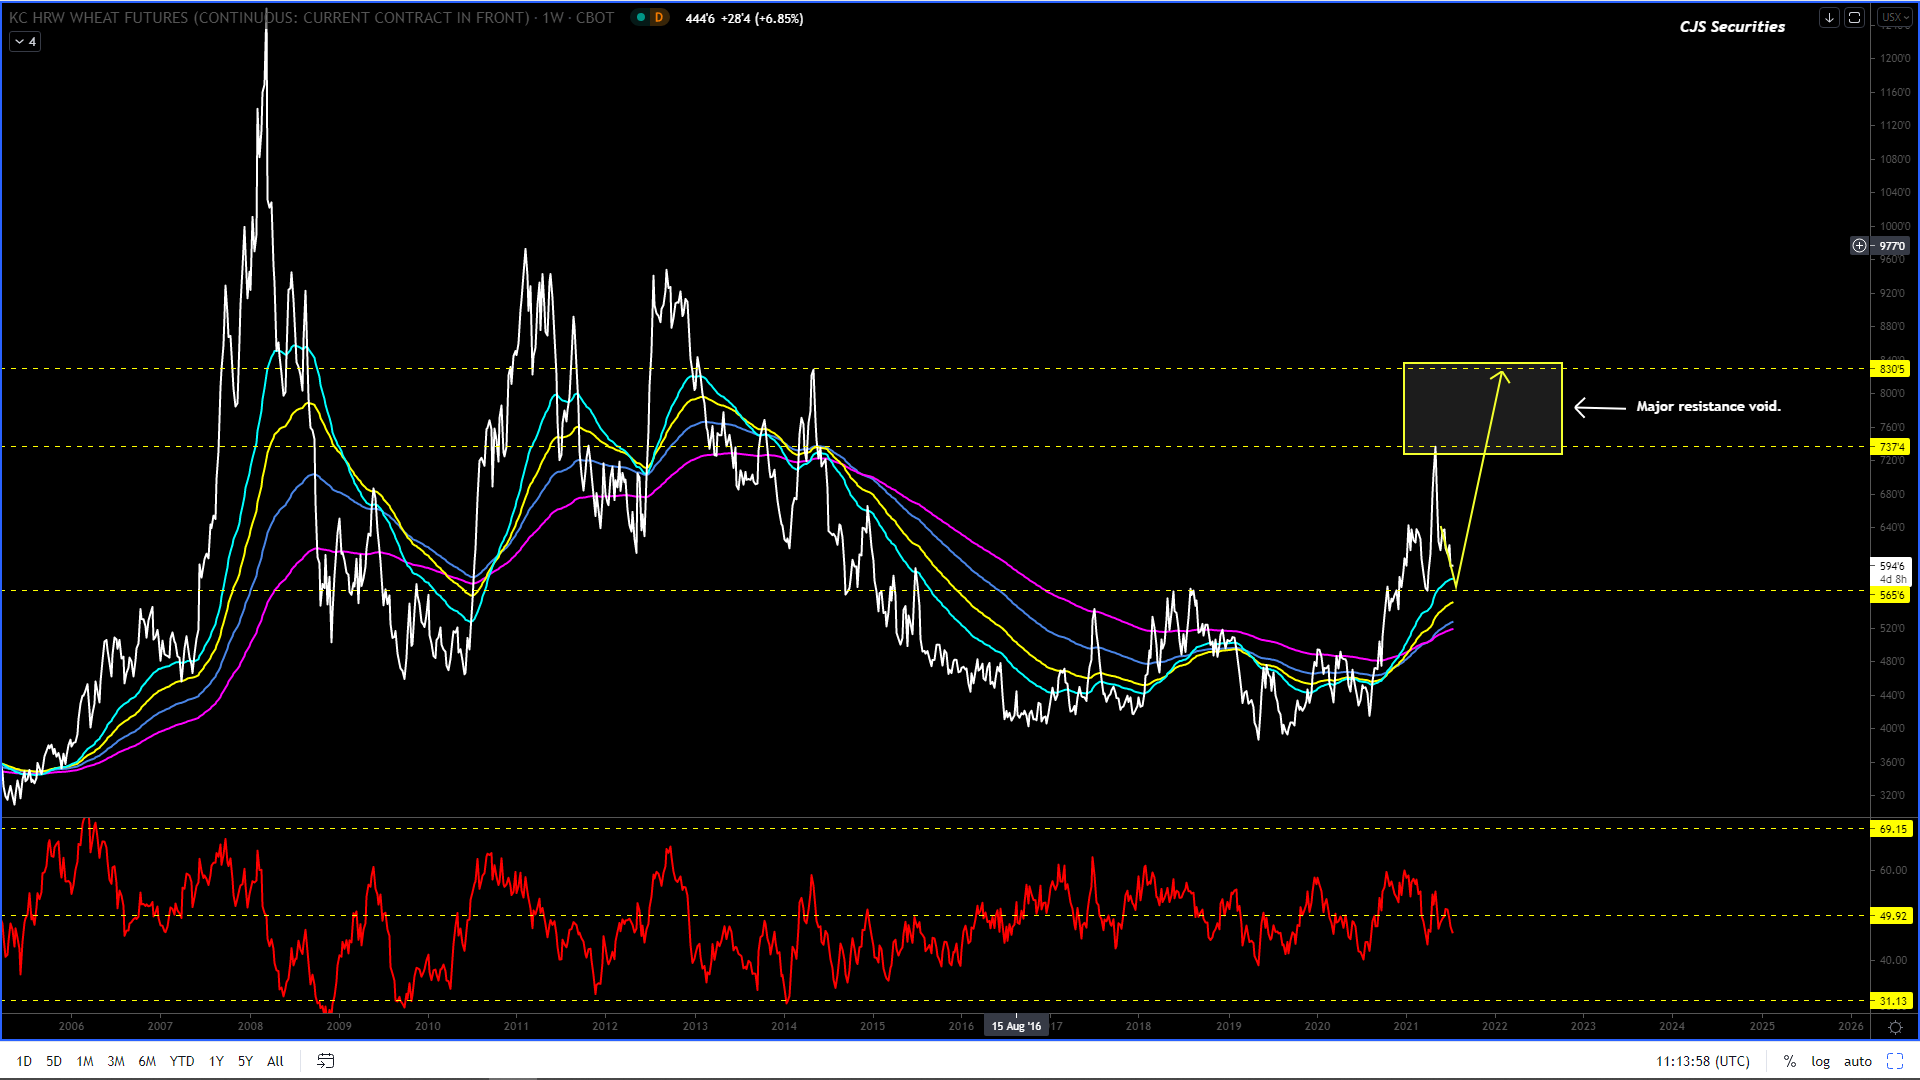
Weekly KC Wheat Continuous Close
#No Change on commentary
When trading US wheat, patience is the key, and we are waiting to buy until further notice.
However, if you have to partake in this market, I would buy the dip sub $5.70.
When this chart eventually rallies, it will rally hard and fast, and most won’t be able to get long!
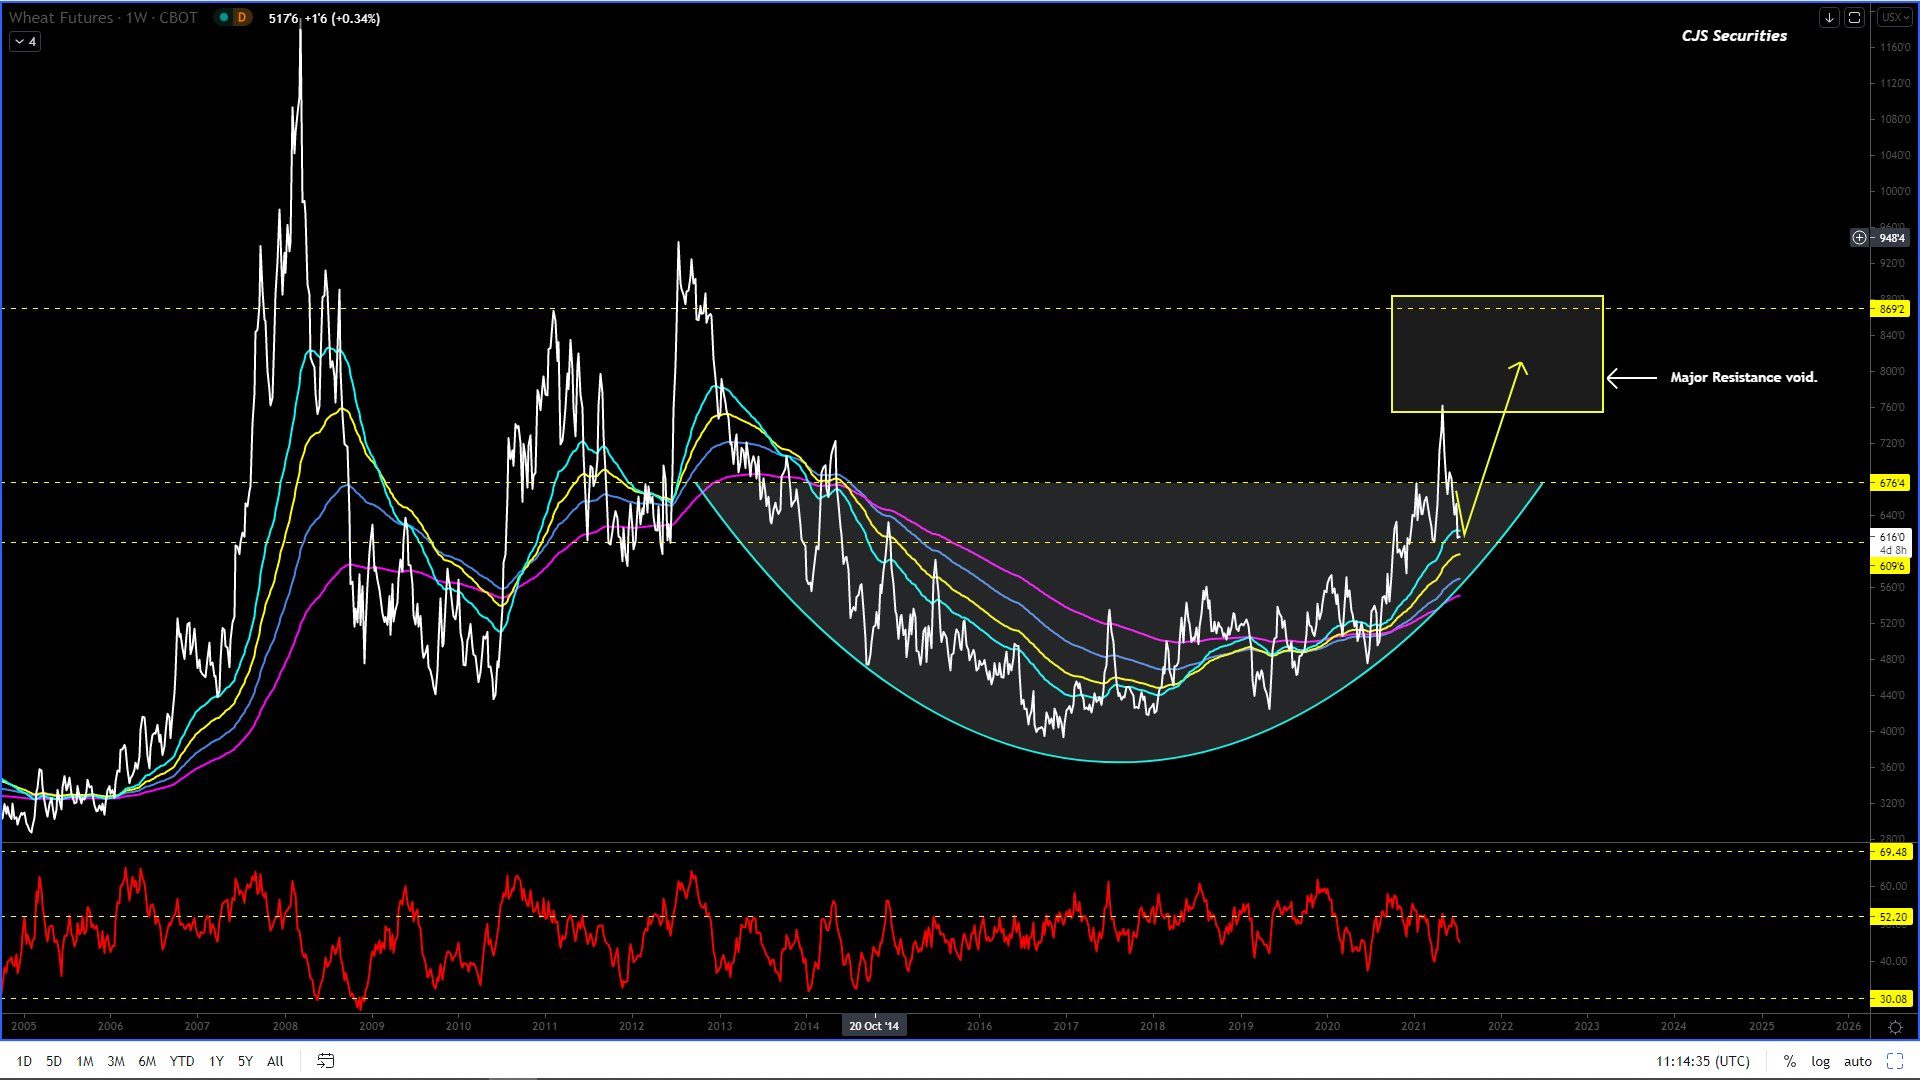
Weekly Chicago SRW Wheat Continuous
Buy down to $6.13 if the chart gets that low (we are close) and look to cut under $6.09 on a Weekly close.
I am super keen to own it!
Wheat is set to rally in the coming months, and opportunity beckons!
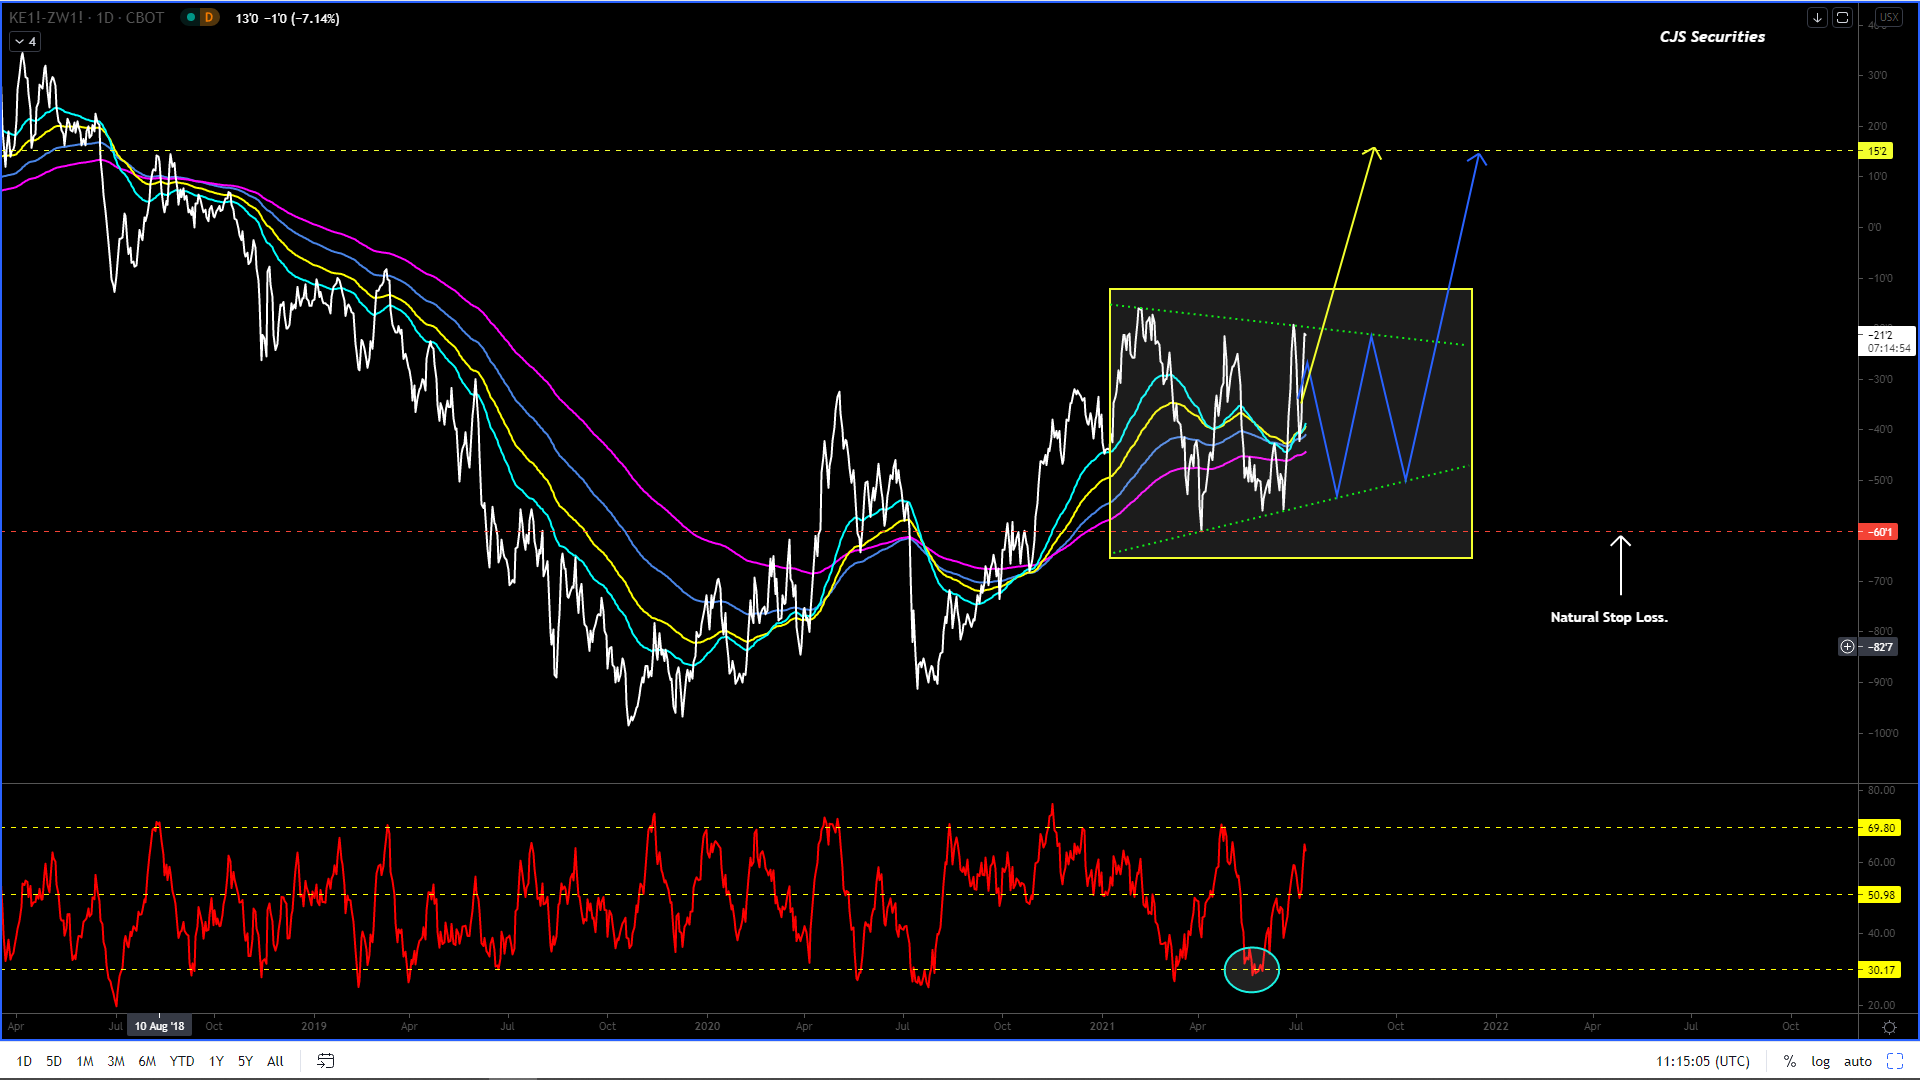
Daily Close KC Wheat v Chicago SRW Continuous Close
#No Change on commentary
This chart has two outcomes IMO, it’s either going to play out in a straight rally or take everyone to the cleaners in a triangle.
If it’s the rally, you can only get long on Daily close over -$0.19, and if it the triangle buy the dip as momentum buying will only get you killed!
Weekly SAF Wheat Continuous Close
#No Change on commentary
Continued consolidation on this chart still has me bullish, and I would not sell it at all.
This chart looks great!!!
We are patiently waiting to buy a decent dip!
Daily Matif Wheat Continuous Close
#No Change on commentary
I am sticking with both views, for now, hence the no change in the commentary.
This chart seems to be making a classical irregular flat formation.
Buy at best with upside targets at €215, and this is a very ST trade, as once the kick is done, there should be more downside. So – let’s see how this ages. (still in with a shout)
The leg lower will be the chart’s last lower before a decent rally of€30+.