I have a feeling we are in for a bumpy ride this year but I would like us all to make our trading theme this year, the year of patience!
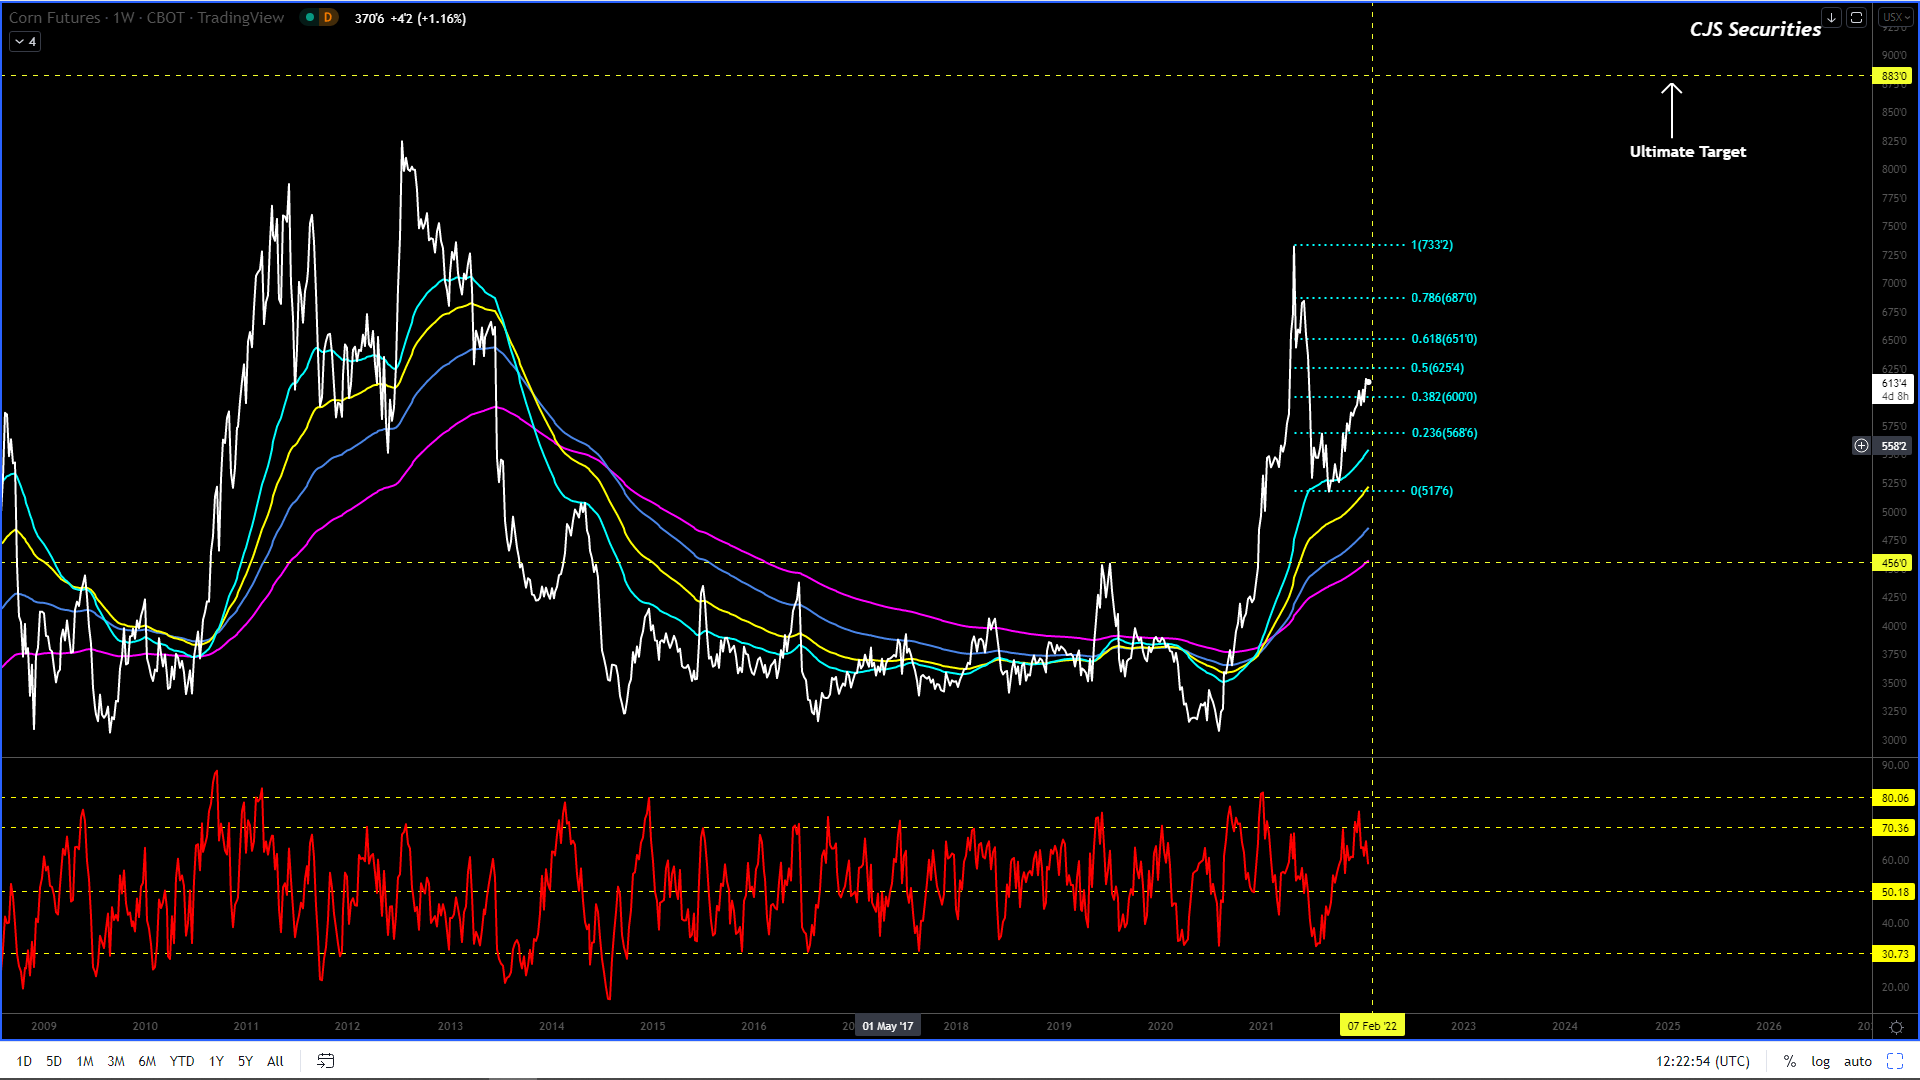
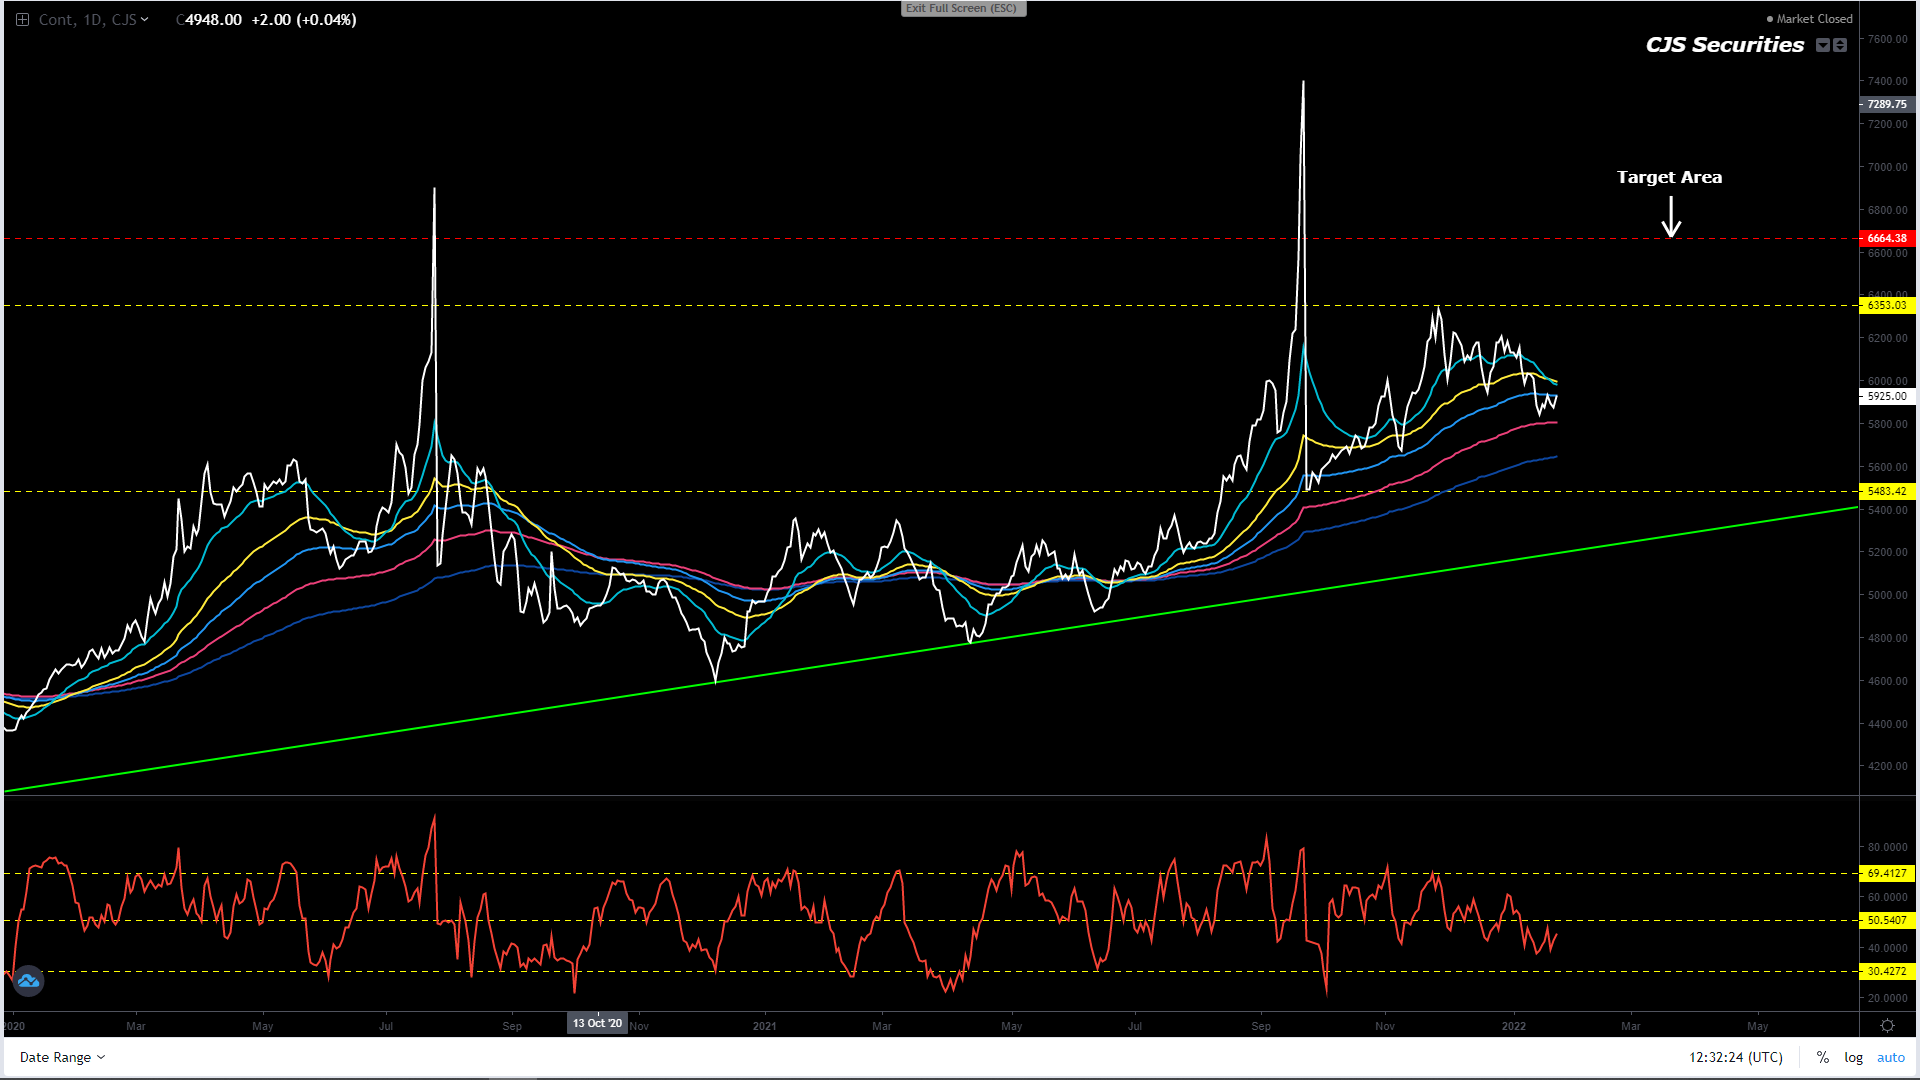
Not much has change over the last five weeks and I would STILL look to fade a rally from $6.10 – $6.25 for profit taking and further fade into a move to $6.50 getting short.
I am not convinced that the chart will turn into massive bull market from here and that my big picture view is that the next $1.00 move will be lower rather than higher (could be famous last words).
Should my above view be correct this chart could be in for a move back towards the low $5.00’s, before becoming a serious buying opportunity once again.
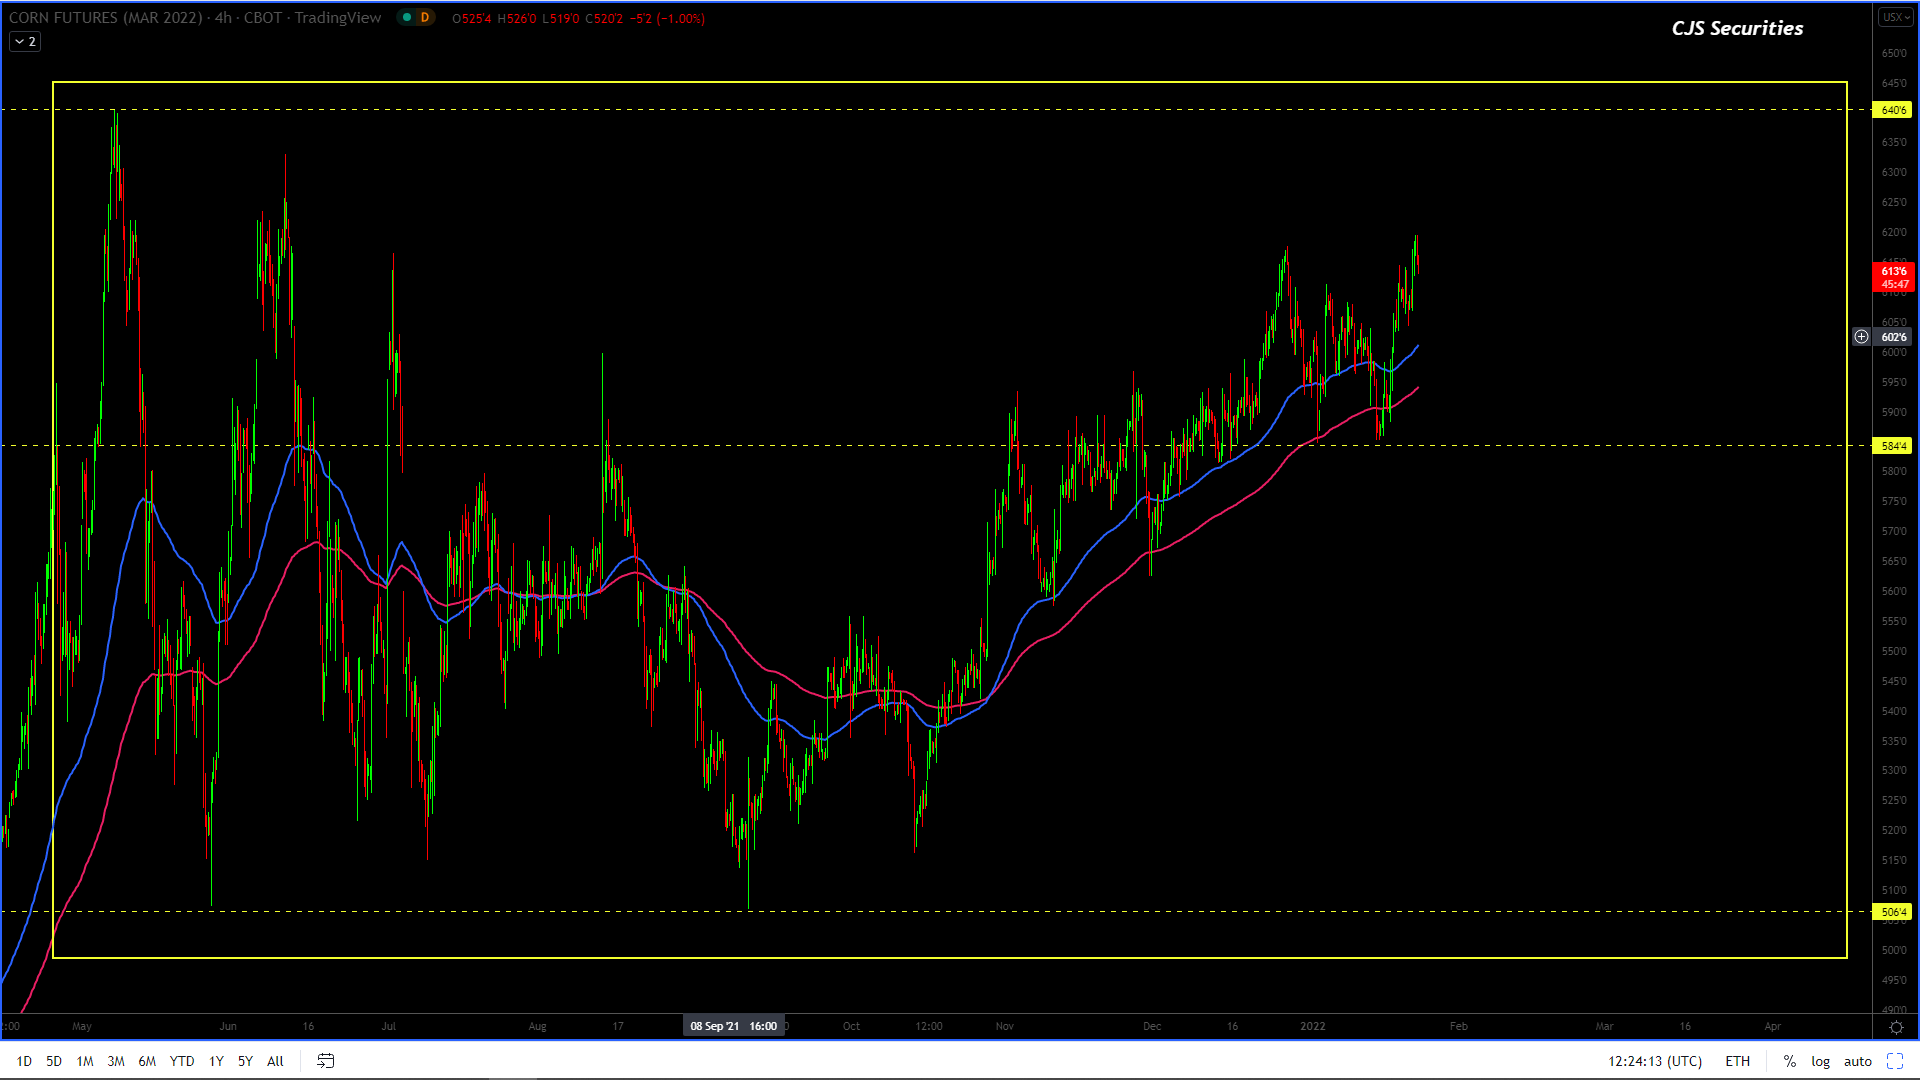
240 Min March 22 Corn Candle Chart Close
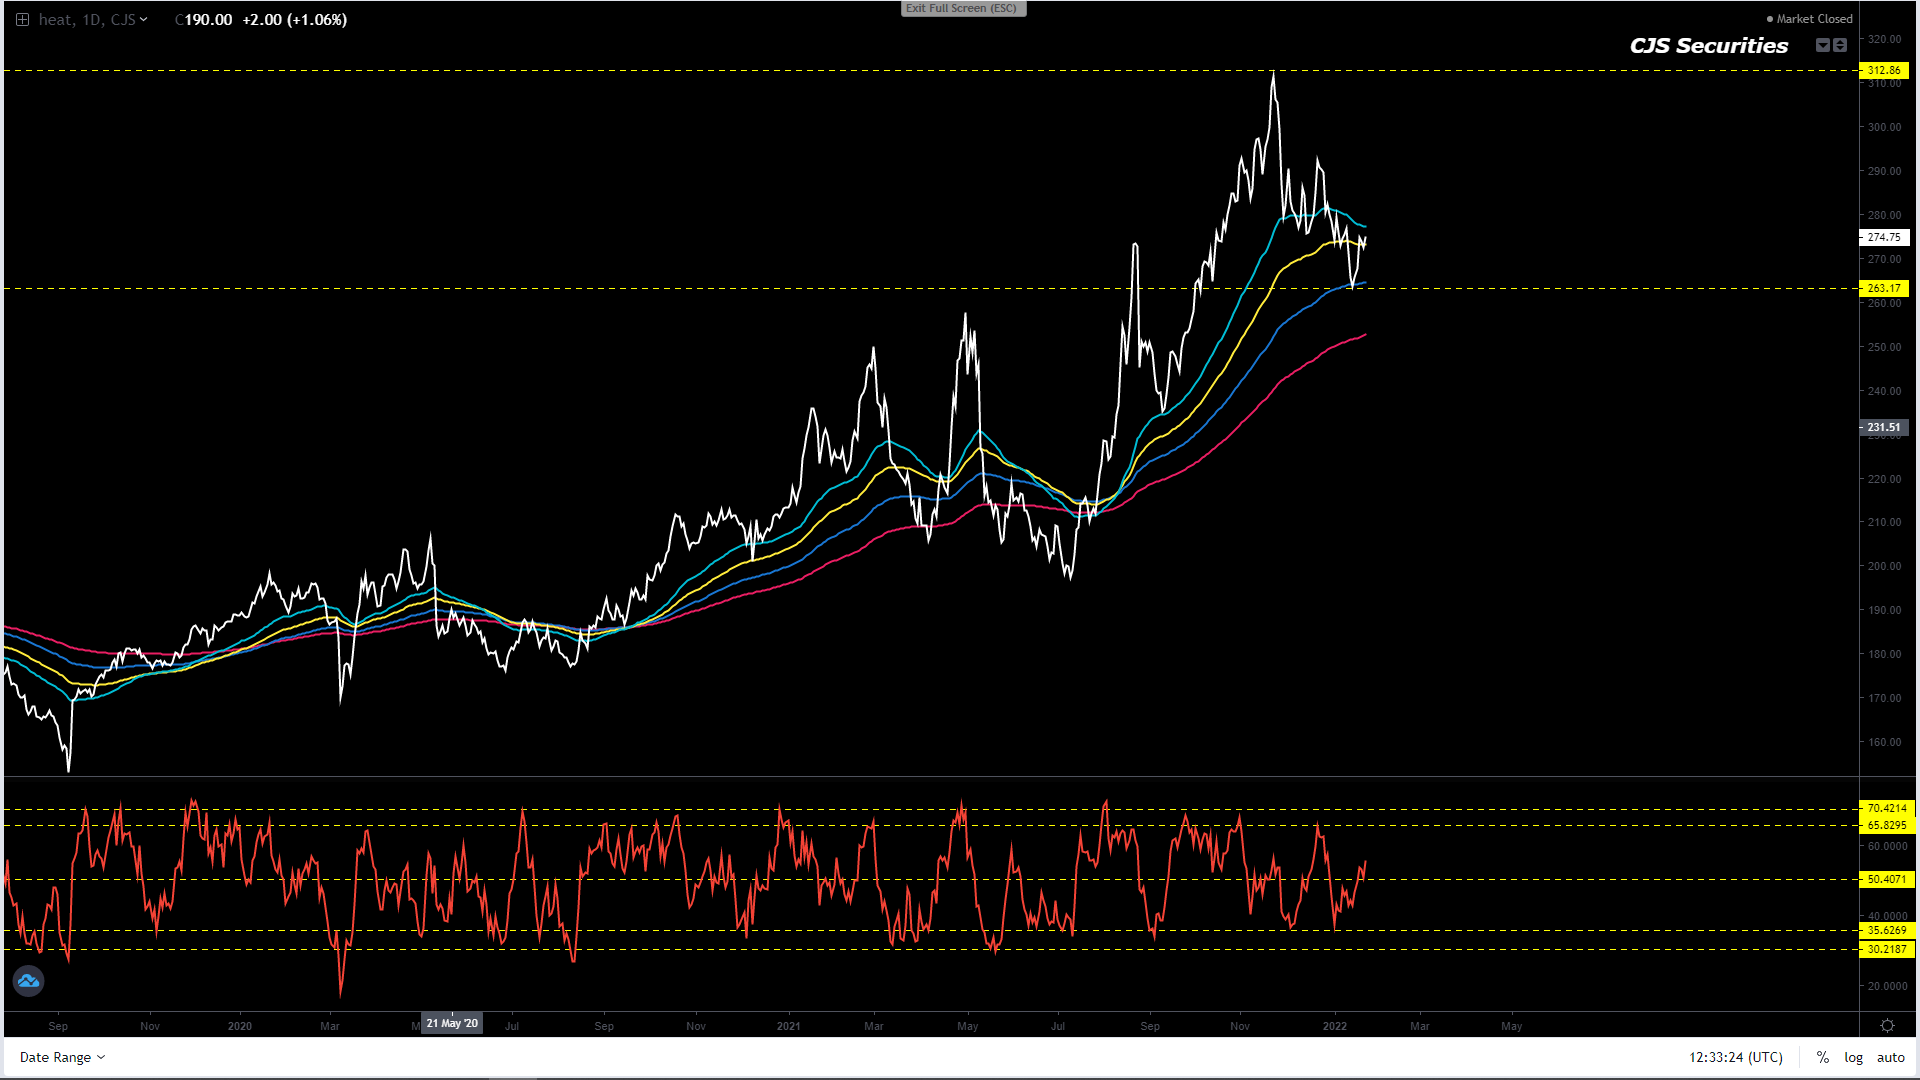
I REMAIN very uncertain of the ST view on this chart.
The long we had played out wonderfully, but now I feel that the chart could still look to test the high and potentially make a false break, but overall I would be looking to sell a rally of this nature.
If my above view is correct we could be in for a vicious ST bear market.
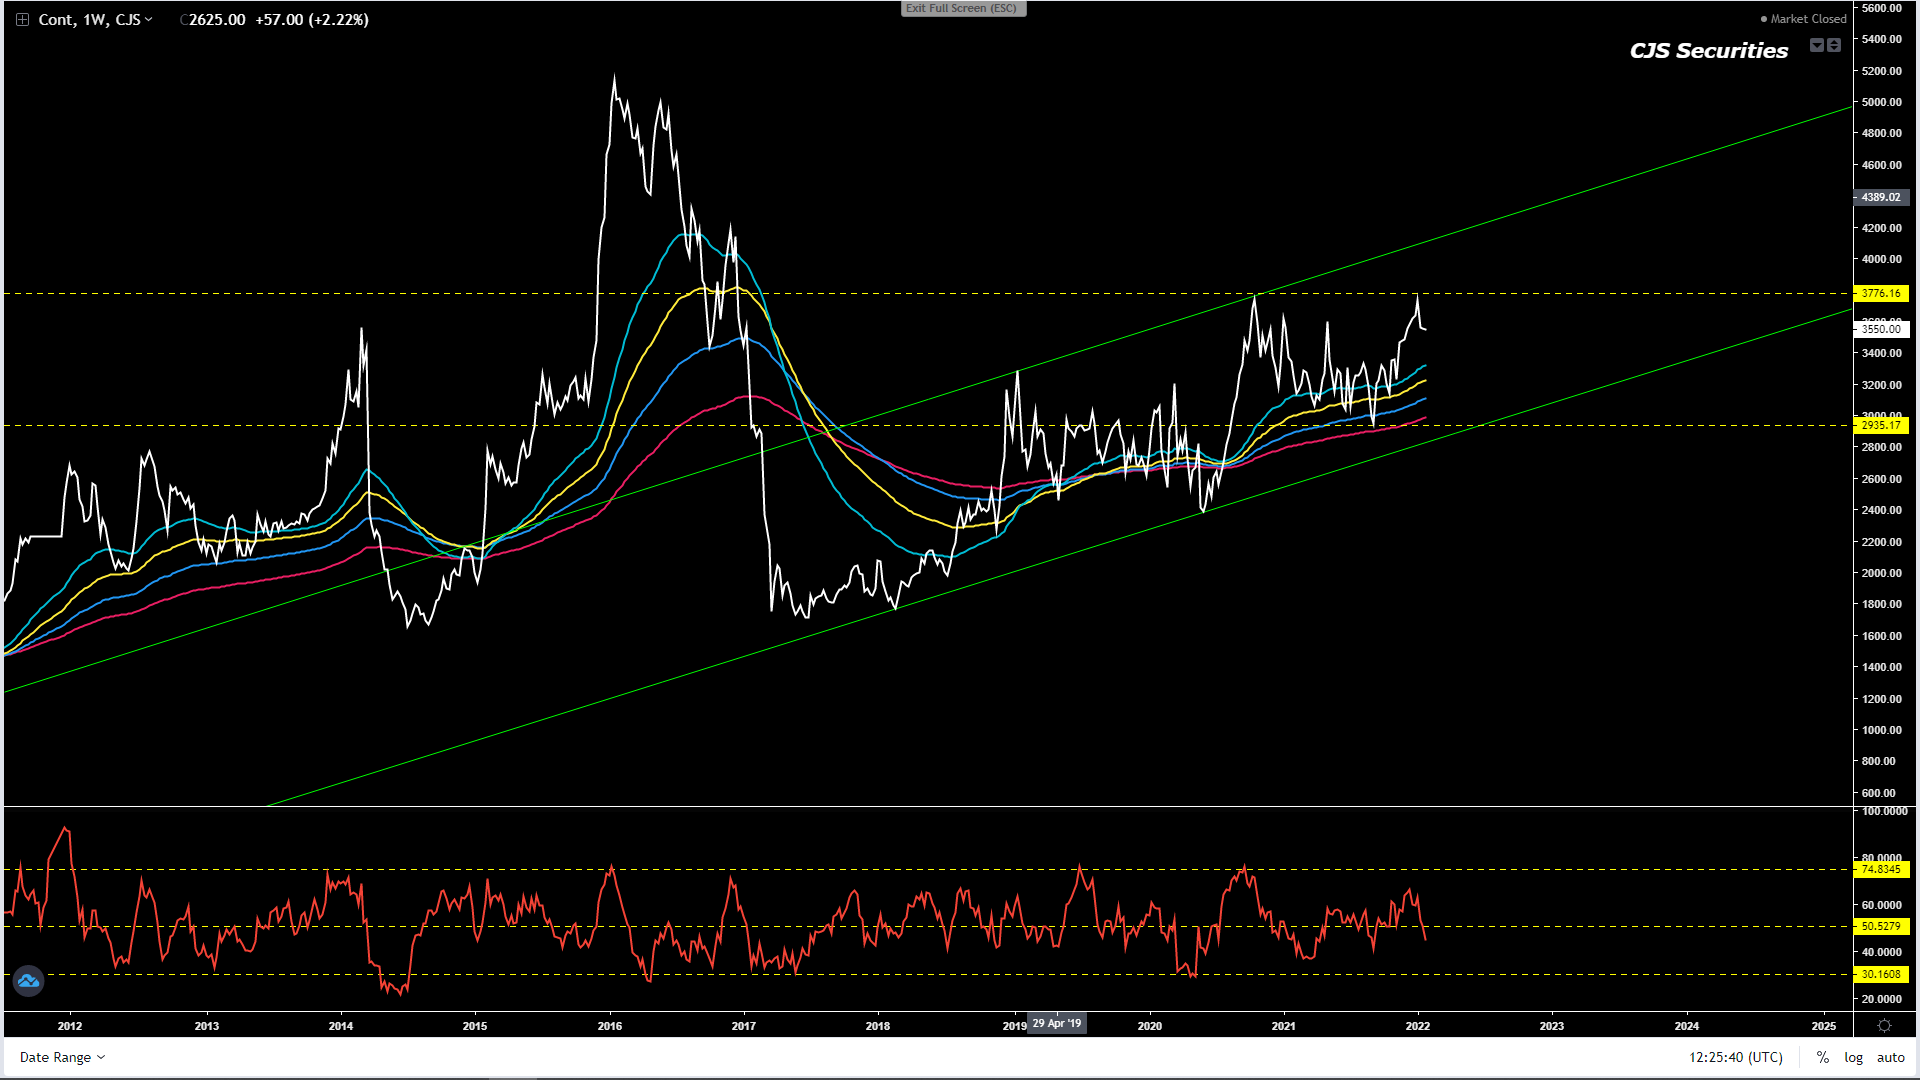
Weekly WM Continuous Close
For those that were long through the rally and made good cash, congratulations!
As for how this chart shapes up, I am very afraid as these double tops are as unfriendly as they could be and although the chart could still have another leg higher I would be looking to get short.
Right now IMO any rally back over R3770 would constitute a selling opportunity.
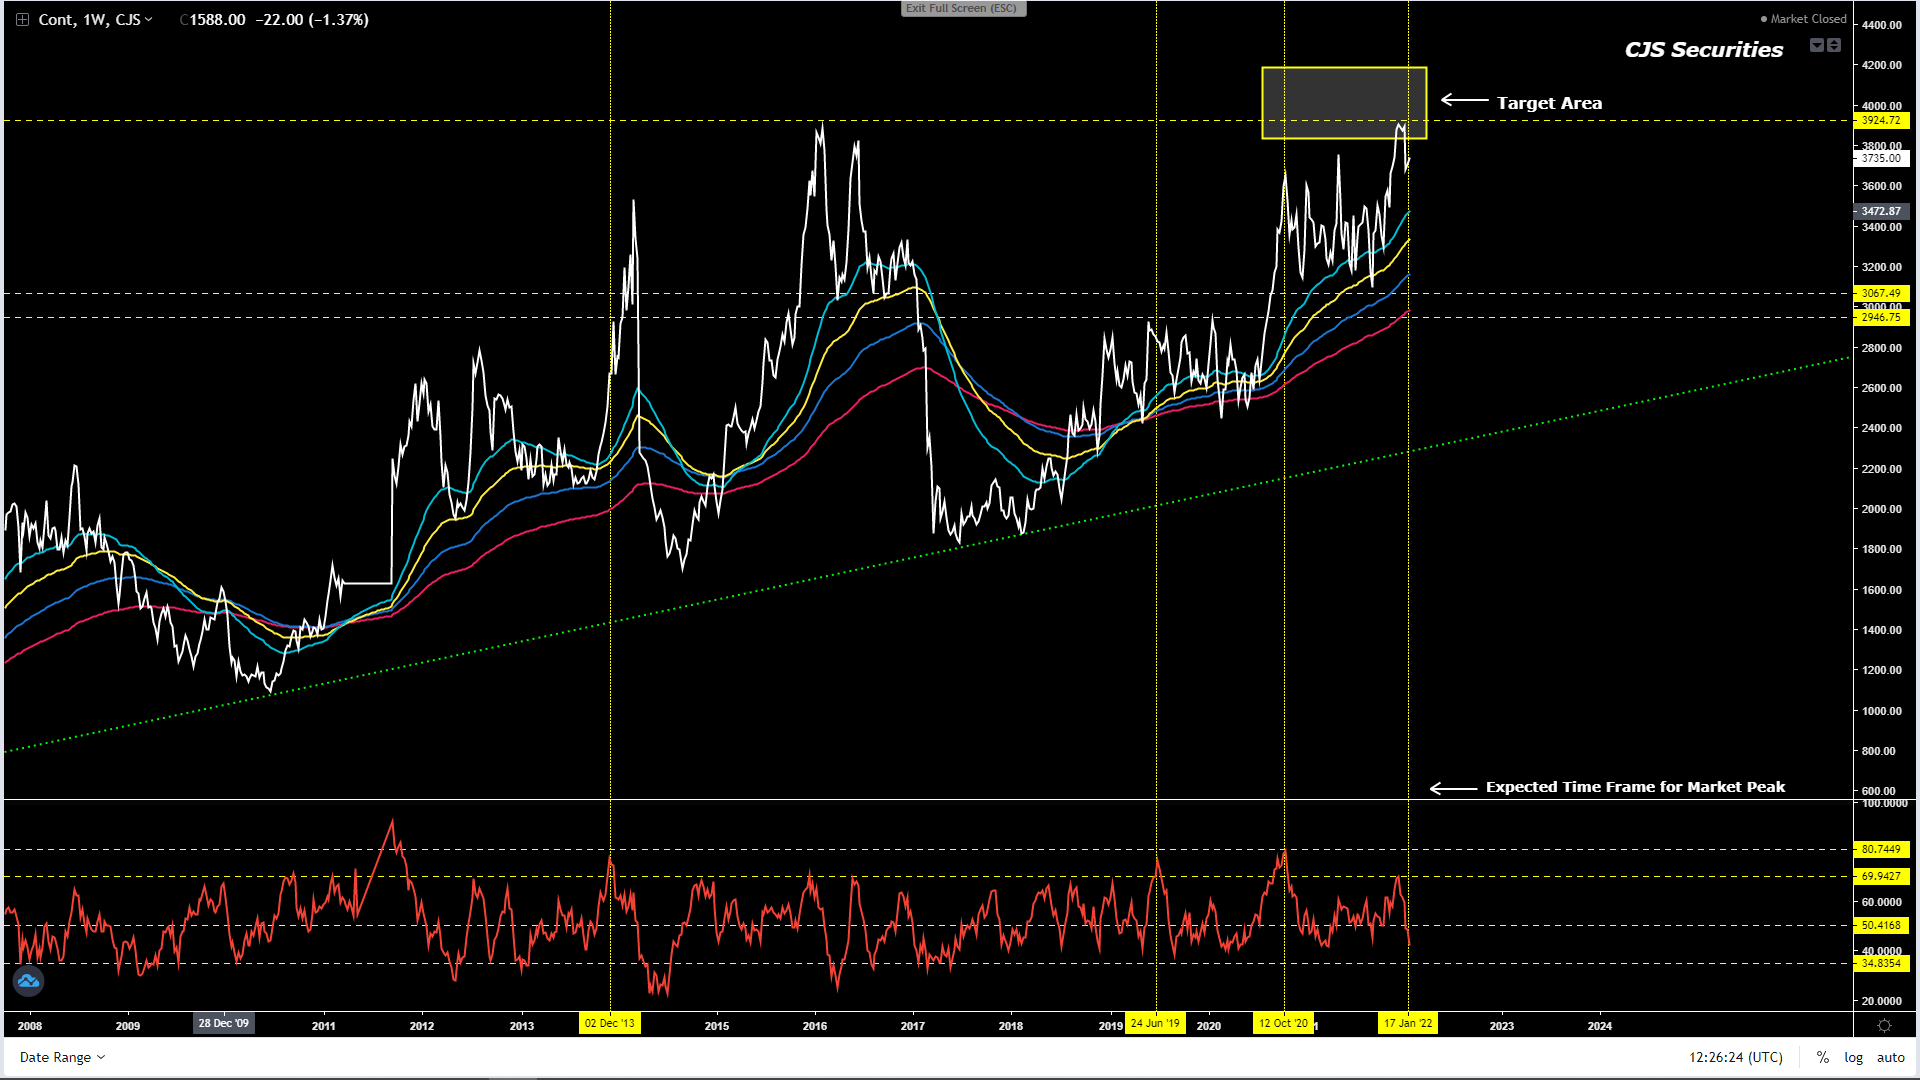
Weekly YM Continuous Close
For those that were long through the rally and made good cash, congratulations!
This chart has reached its target zone perfectly and although it could still trade higher, I would be looking to sell a move over R3930!
I feel this chart is either done on the upside or has one leg higher, either way I am now looking at opportunities to get short.
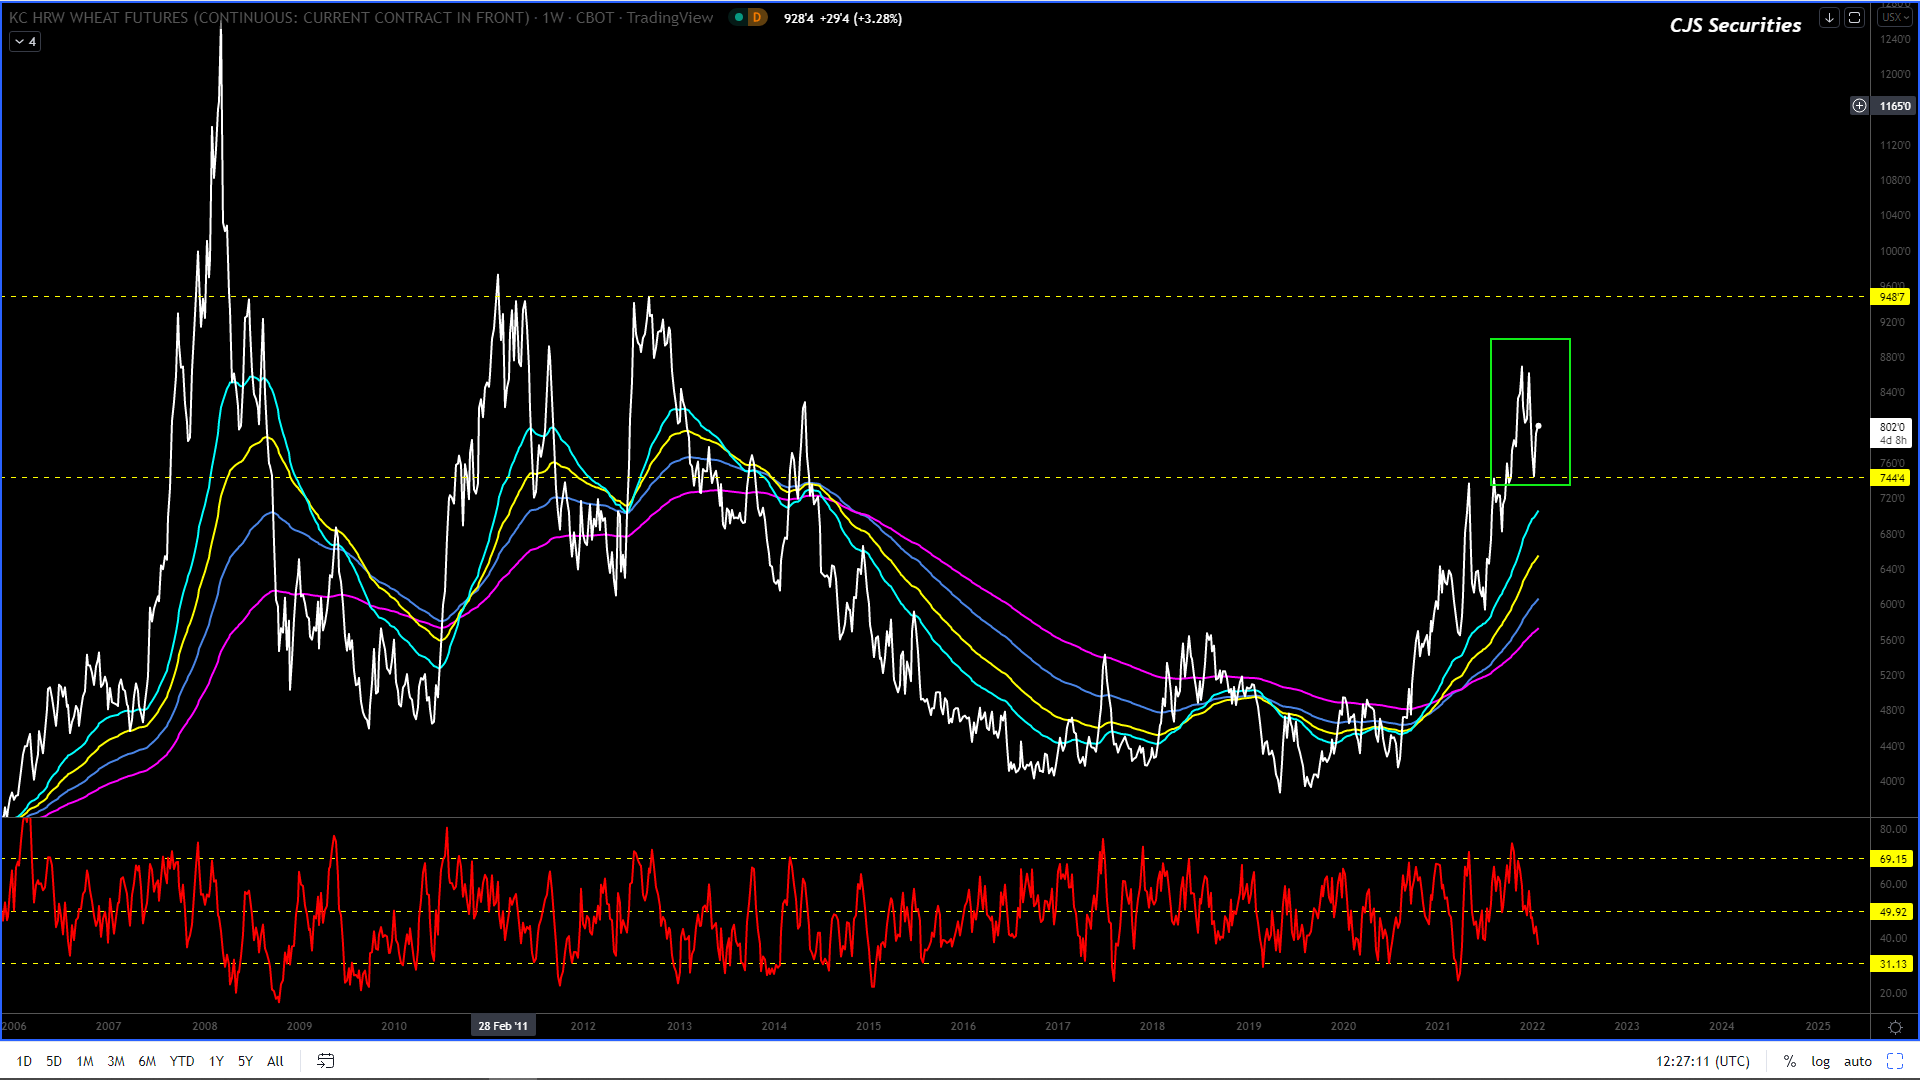
Weekly KC Wheat Continuous Close
I like this chart and I would be looking at buying a move sub $8.00 – $7.44 as I can see the price heading towards $9.50 before making a significant correction!
The oscillator is also pretty low and $0.30 lower should become nicely oversold.
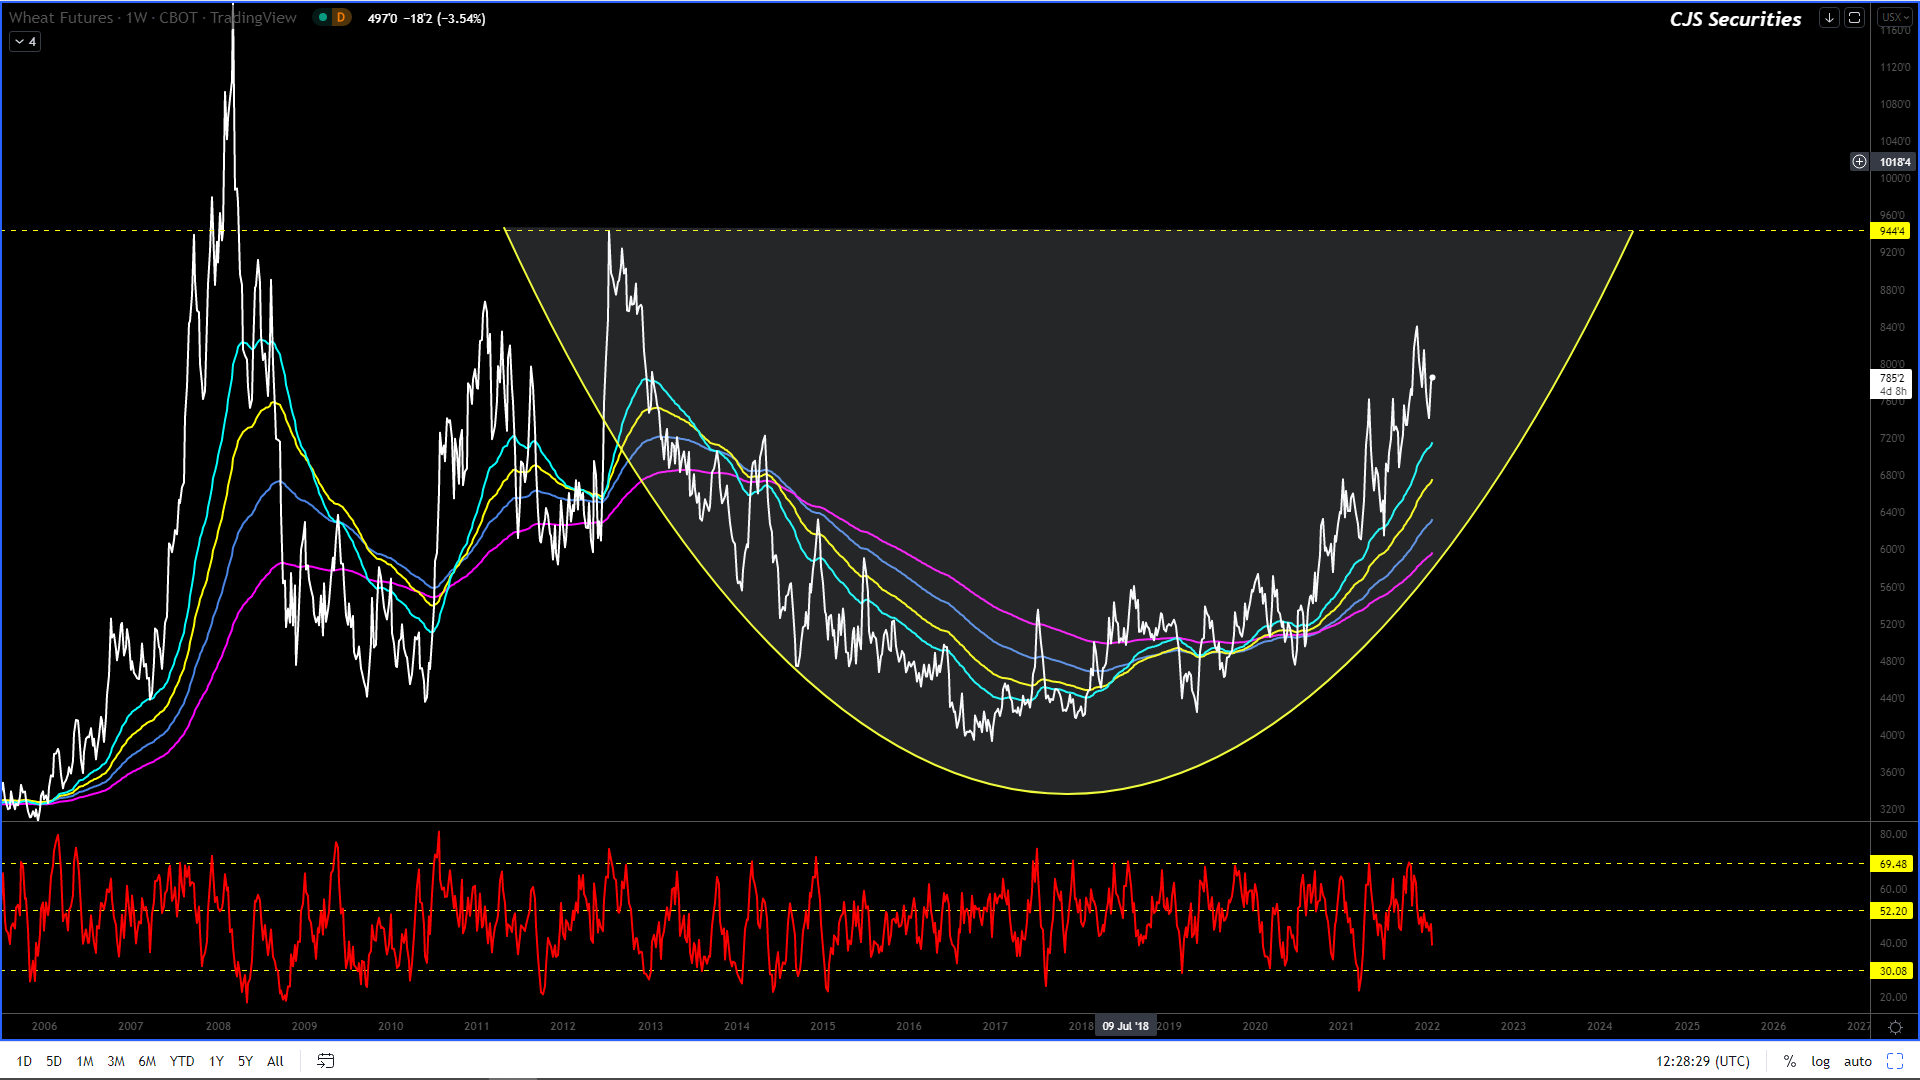
Weekly Chicago SRW Wheat Continuous
I like this chart and I would be looking at buying at best down to $7.43 as I can see the price heading towards $9.44 before making a significant correction!
The oscillator is also pretty low and $0.40 lower should become nicely oversold.
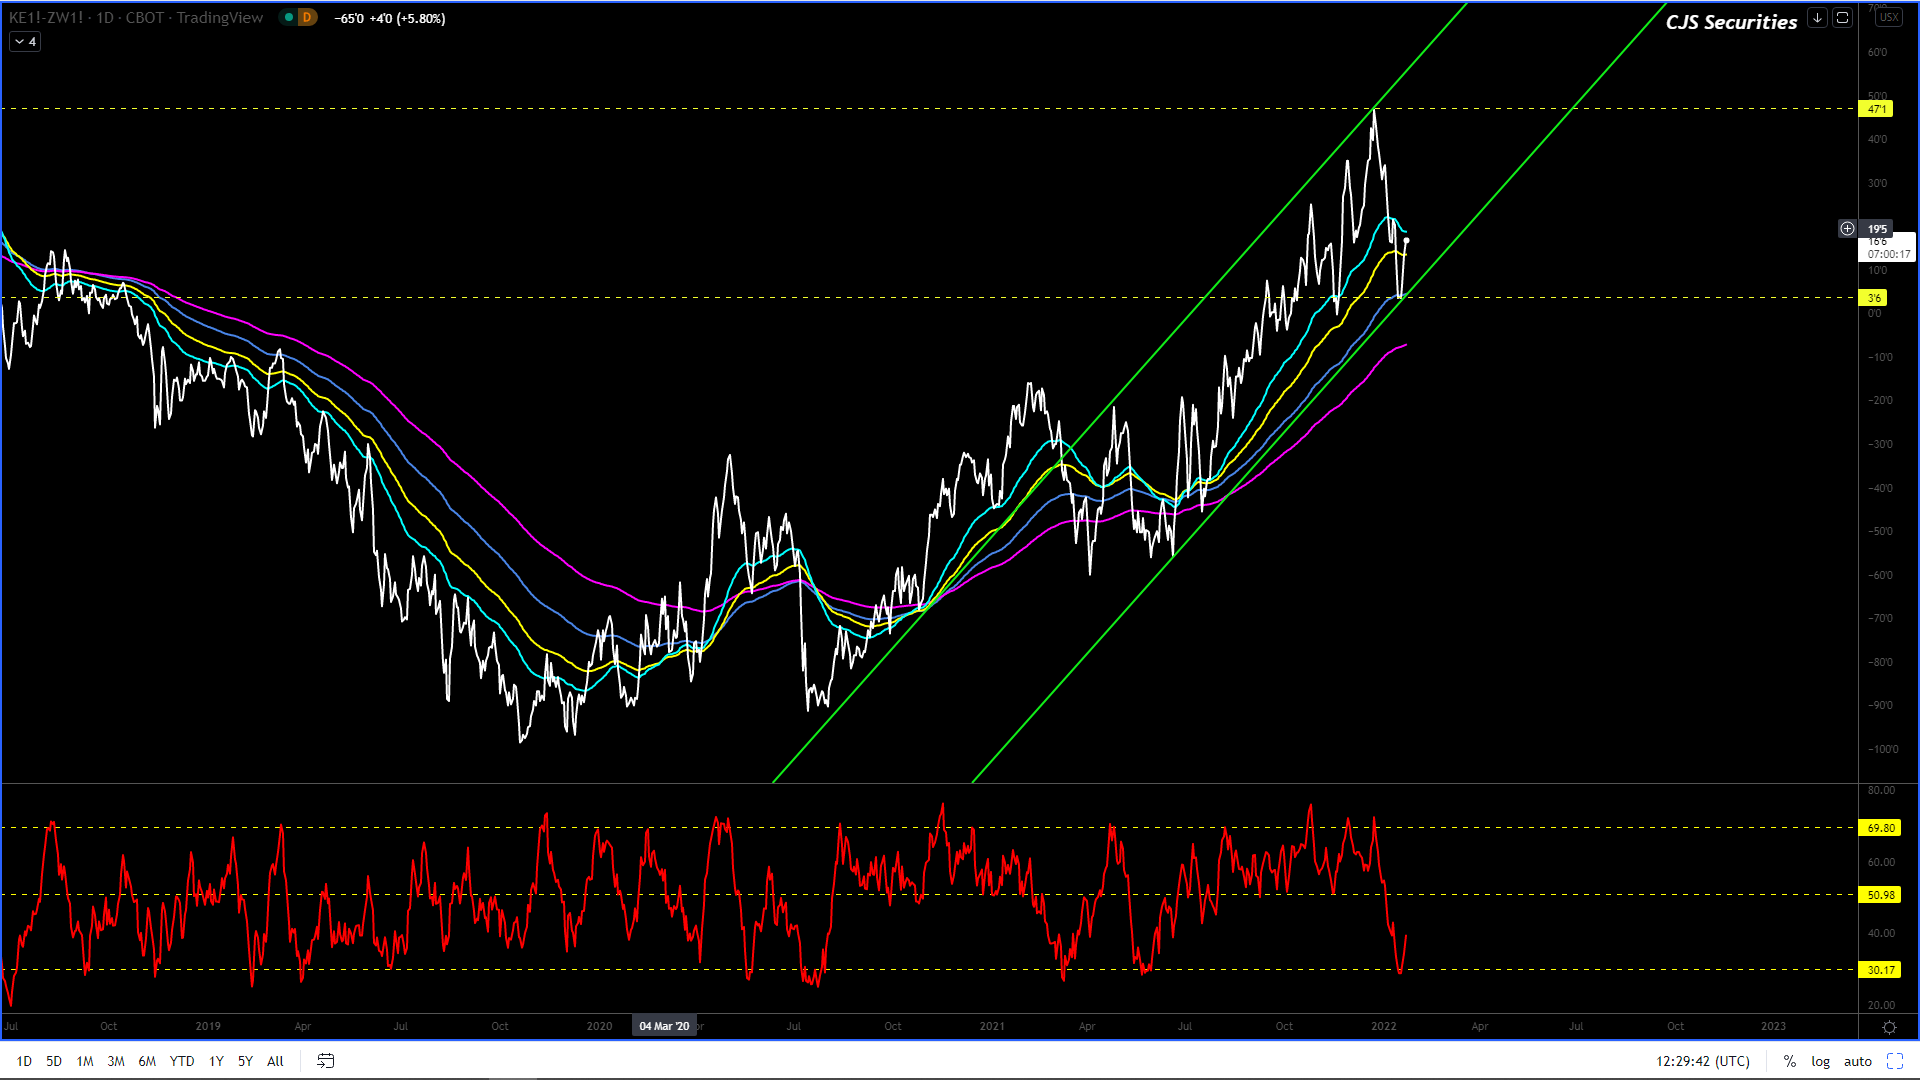
Daily Close KC Wheat v Chicago SRW Continuous Close
The chart is kicking well off oversold levels, but the overall formation seems murky to me and its with this in mind that I would look to sit on the side-line until further notice.
Gun to the head I would look to sell a rally over $0.30!
Weekly SAF Wheat Continuous Close
The chart seems to be making a decent correction that should look to rally over R600 higher within the next 10 weeks (has not broken higher yet).
A rally of this nature would be considered a selling opportunity, but before that enjoy the ride higher!
Daily Matif Wheat Continuous Close
All I can say is that
there is a very high probability that the correction is over and that this
chart will look to target the highs and quite likely make new highs!