Another week of what feels like massive volatility but overall not much weekly movement.
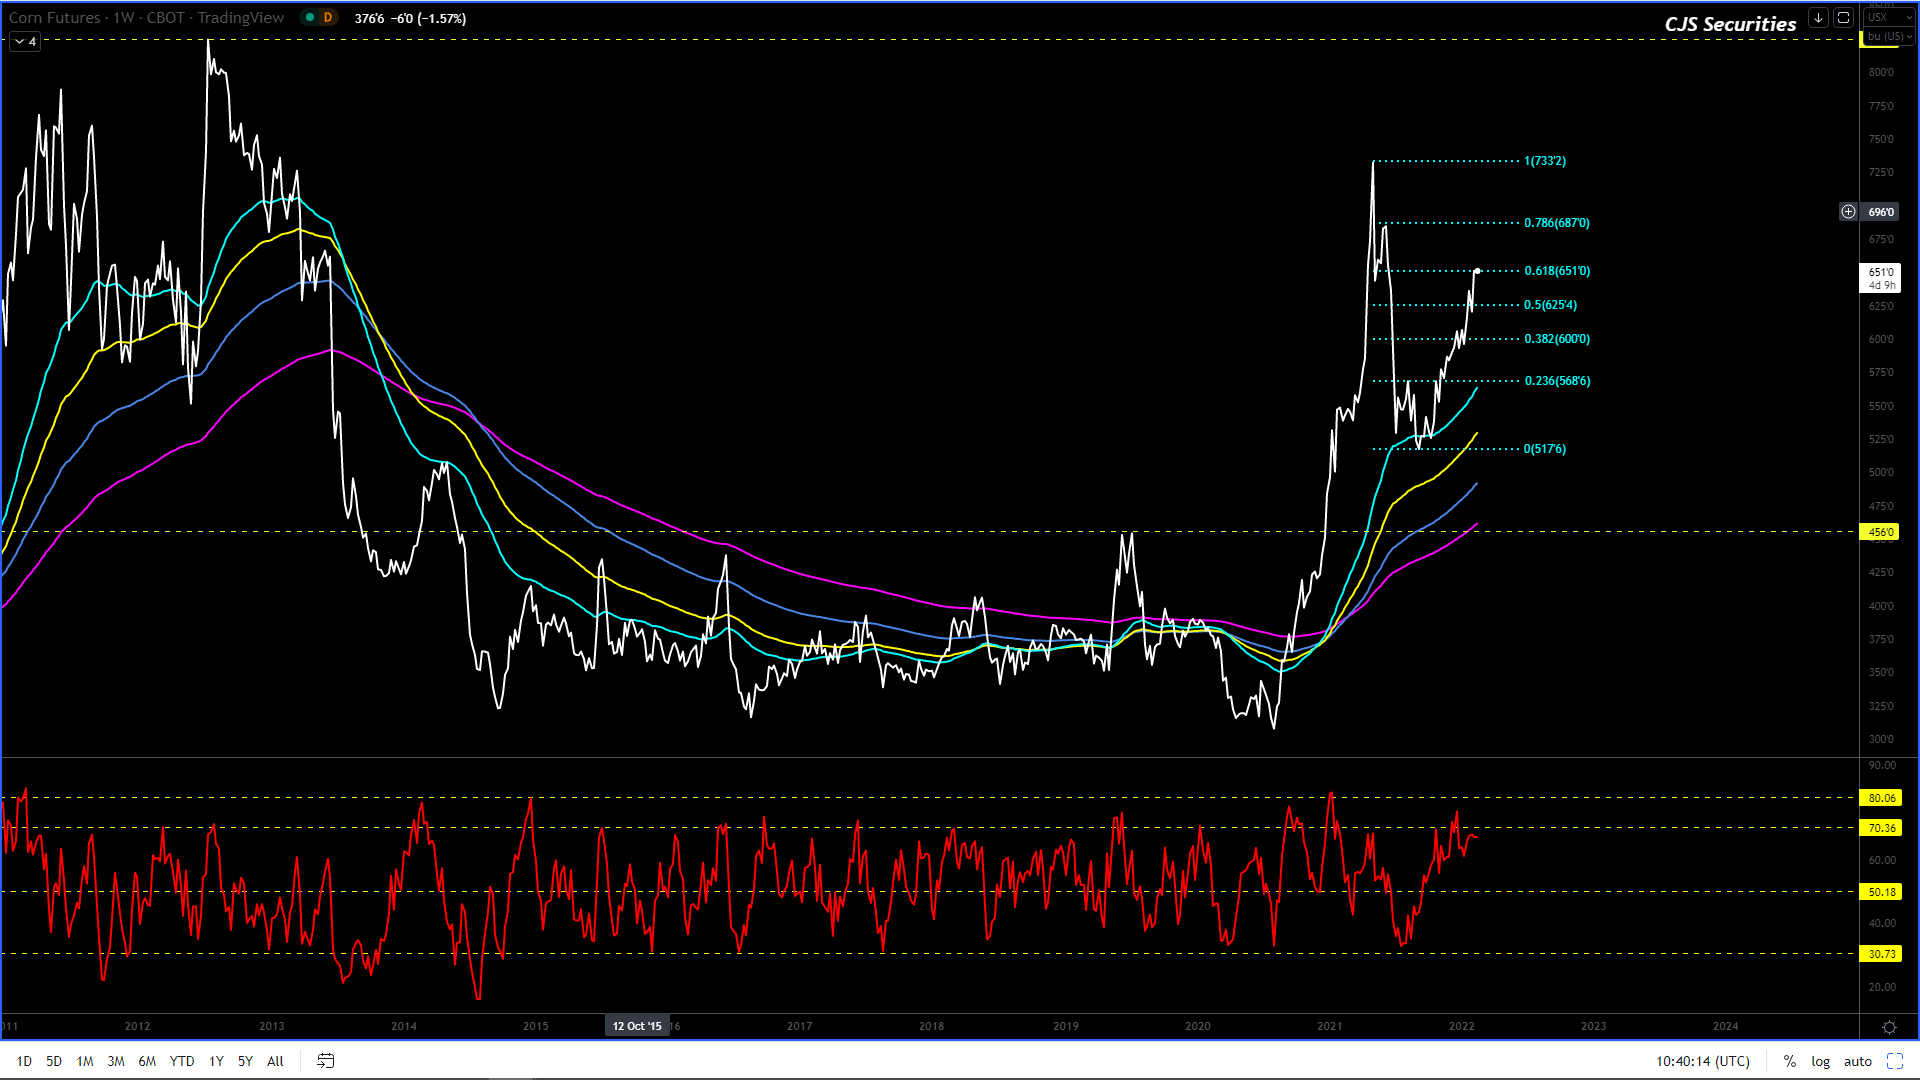
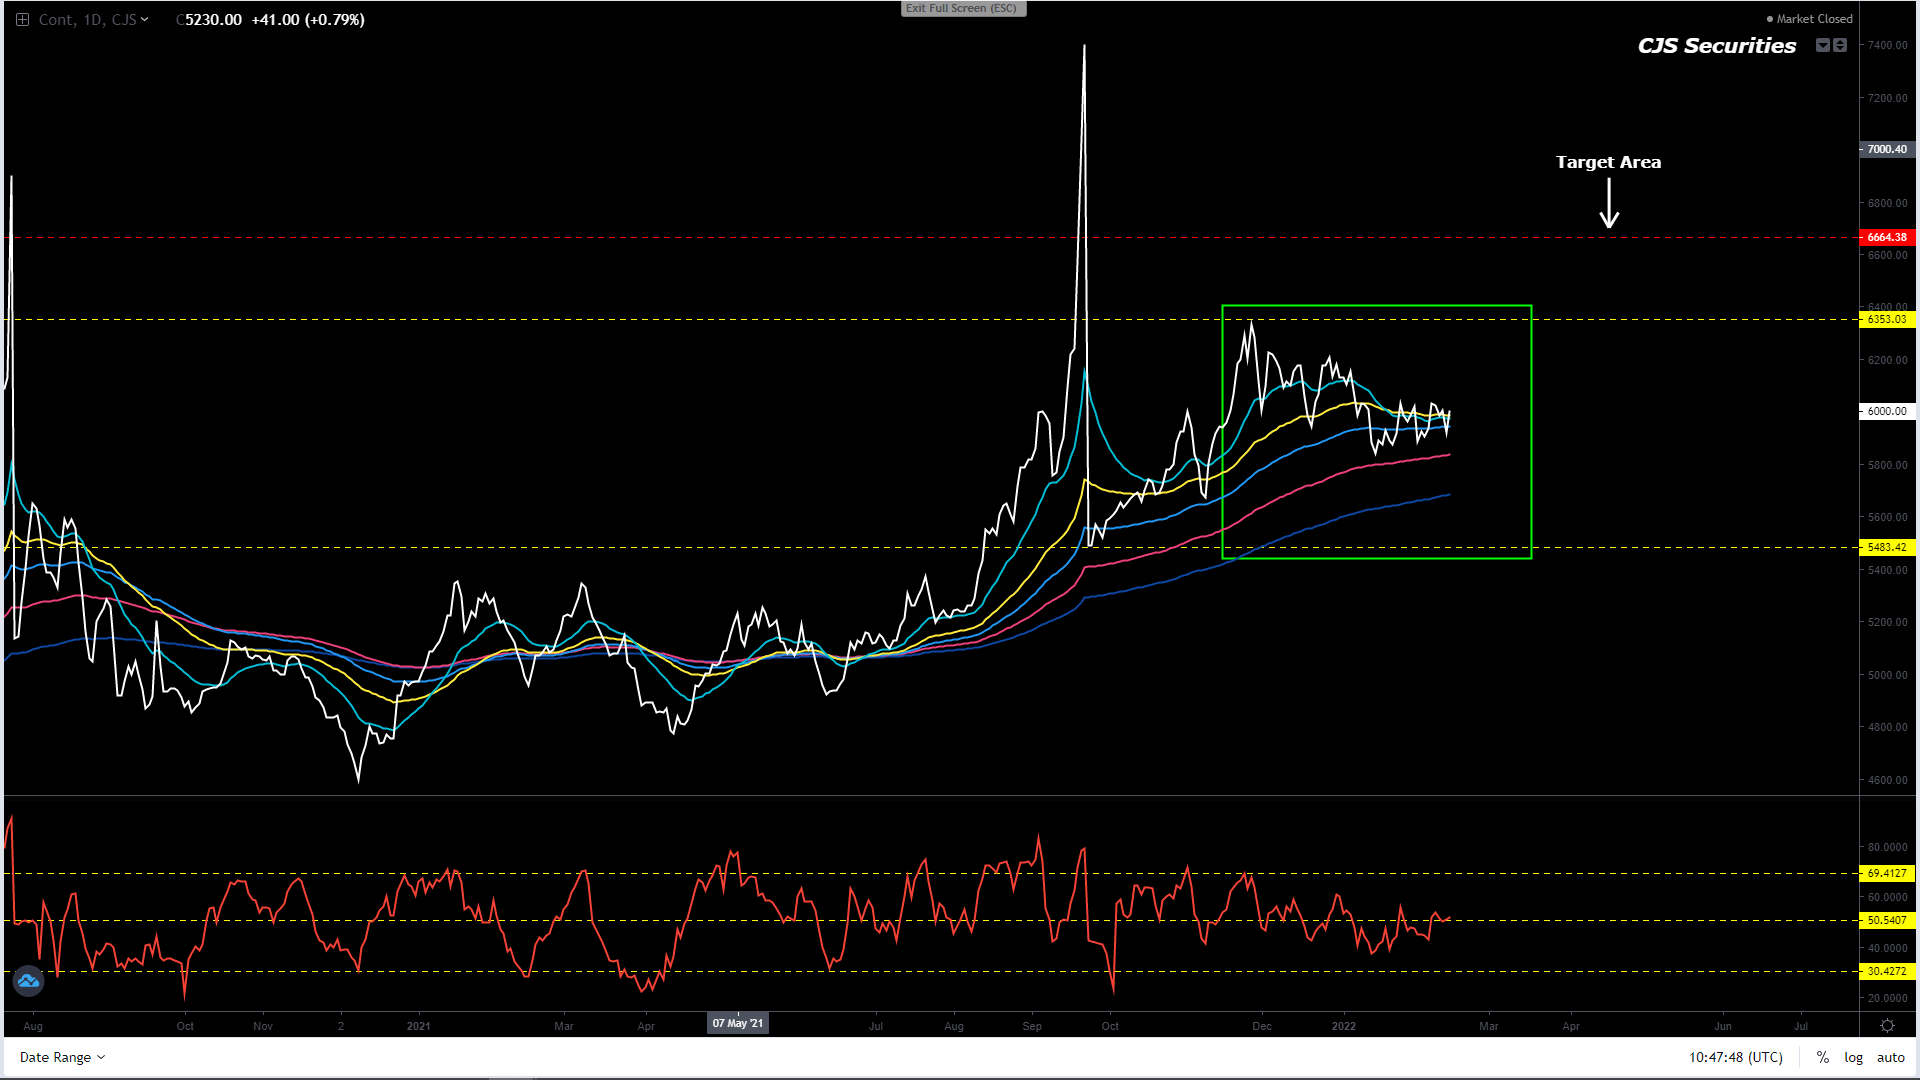
For those that have faded the rally to over $6.40, I am with you and firmly believe that if we see a continued rally, the $6.60’s will be the highs. – so far so good, but over $6.72 I would be wrong.
I am convinced that the chart will not turn into a massive bull market from here and that my big picture view is that the following $1.00 move will be lower rather than higher (could be famous last words).
Should my above view be correct this chart could be in for a move back towards the low $5.00’s, before becoming a serious buying opportunity once again.
240 Min March 22 Corn Candle Chart Close
I don’t like the gaps and the Massive Spike I am seeing and should we see a move back over the $6.40’s I would bash the market harder than a Piñata on my birthday! – short at $6.60 fingers, toes and all other appendages are crossed for this one.
If my above view is correct, we could be in for a vicious ST bear market.
Think about what move would hurt the most players, and the answer is a move back sub $6.00!
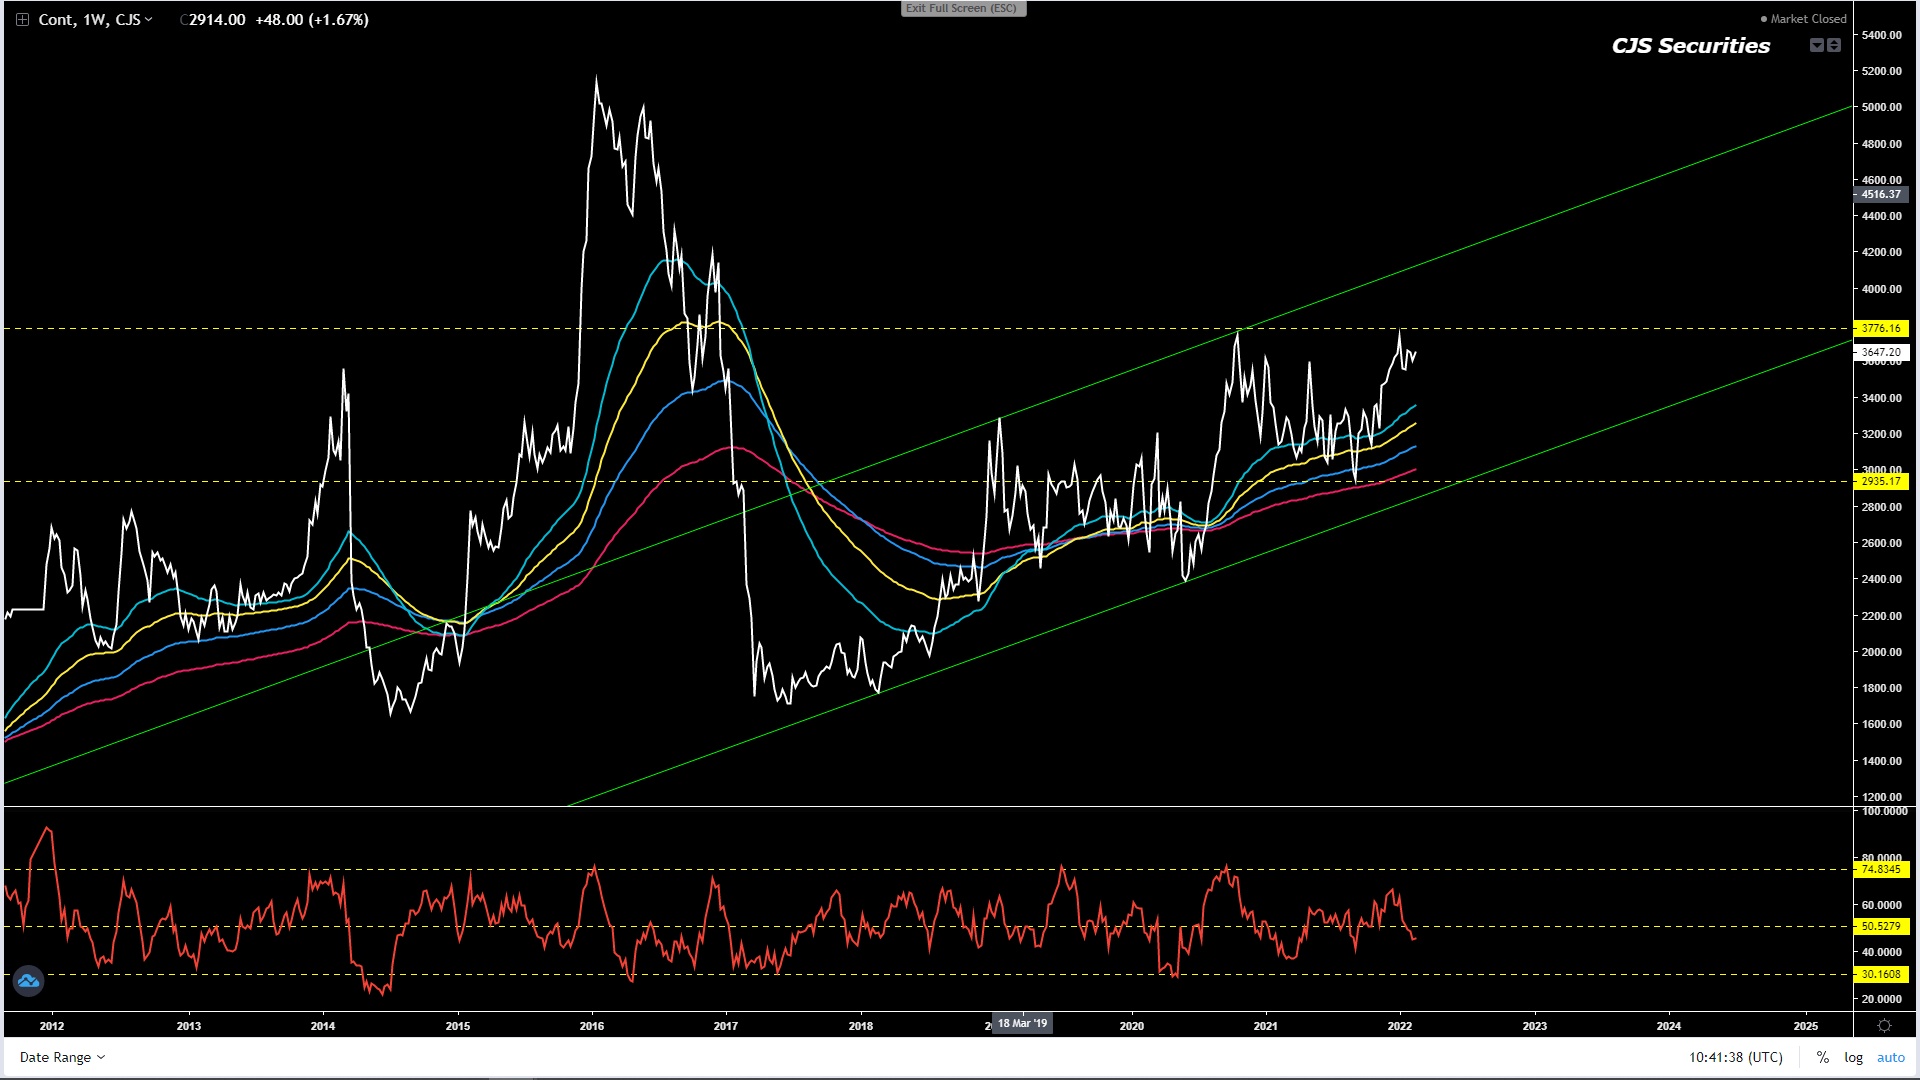
Weekly WM Continuous Close
#No Change in Commentary
People, I cannot emphasize just how strong these WEEKLY CLOSE DOUBLETOPS are and right now, even in the face of high crude and SAM, this chart is not a buy.
Right now IMO any rally back over R3700 would constitute a selling opportunity.
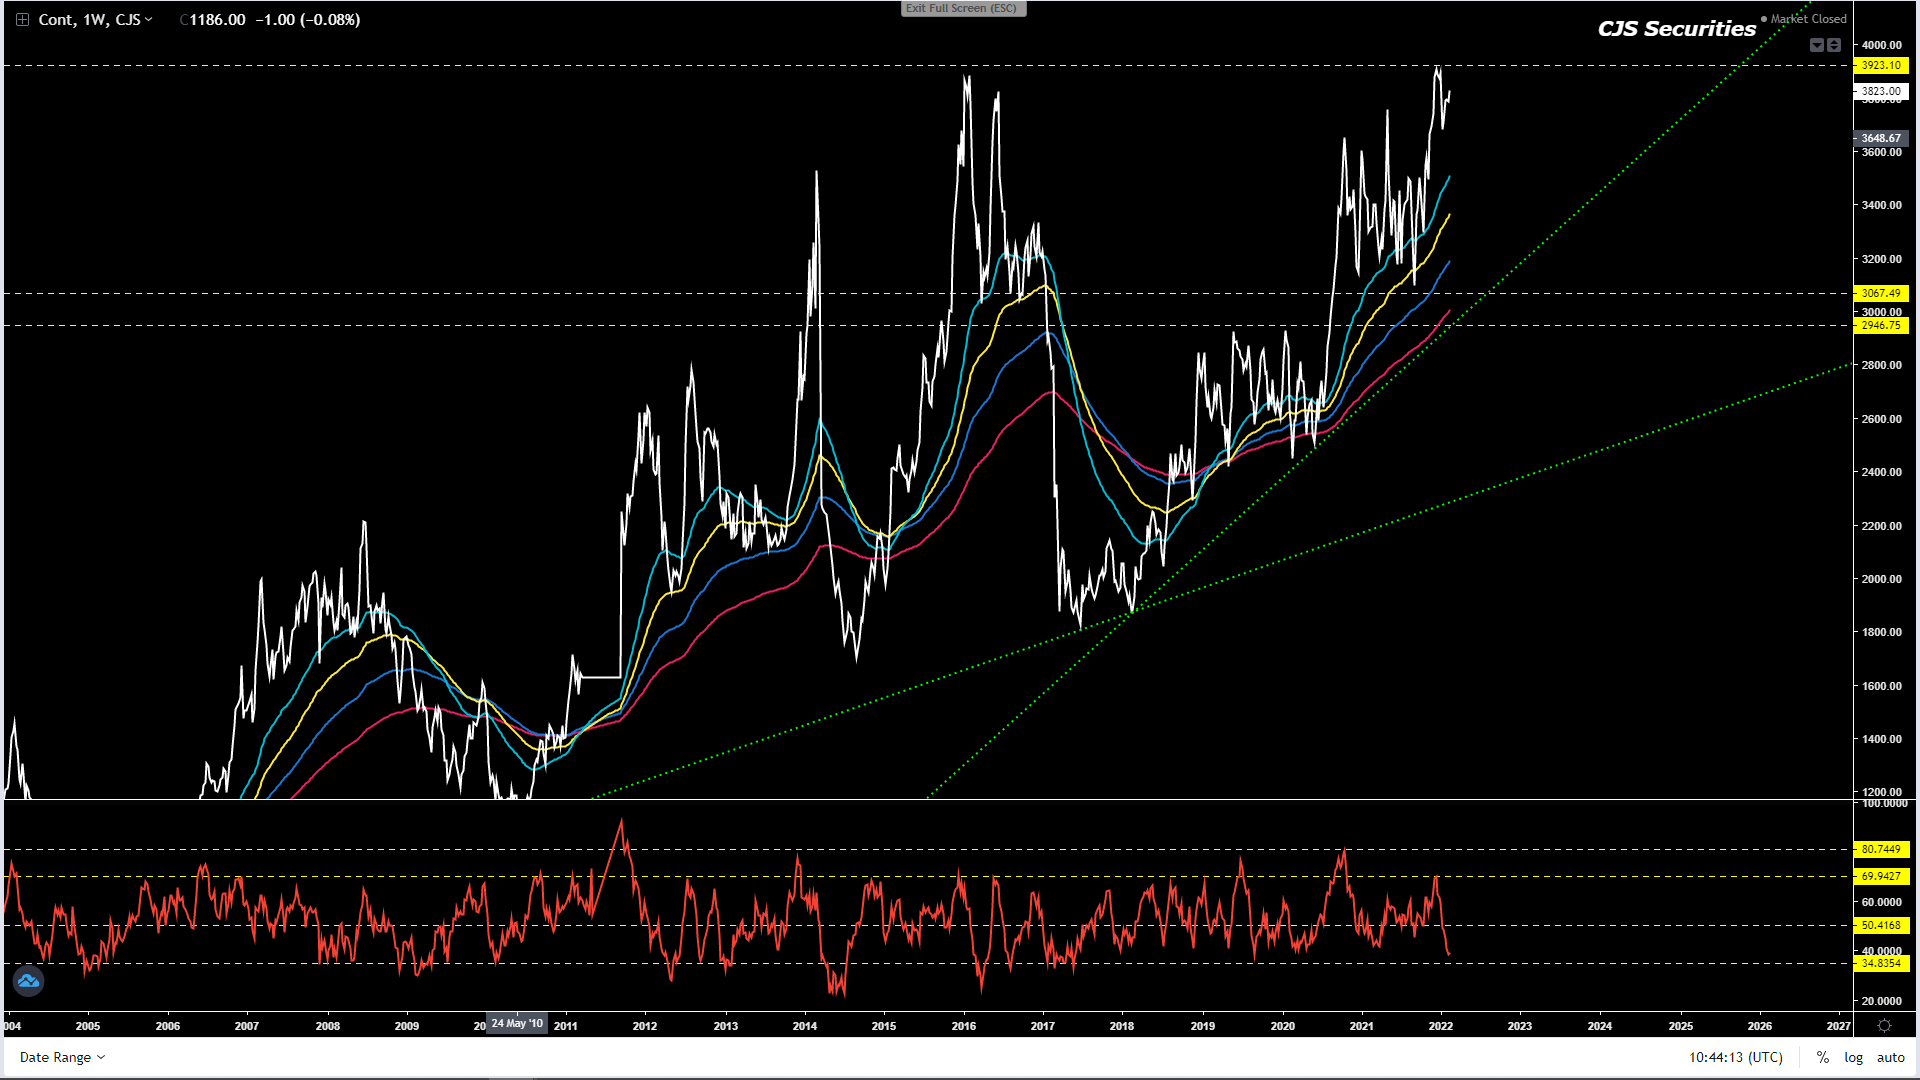
Weekly YM Continuous Close
#No Change in Commentary
This chart has reached its target zone and has made MASSIVE Weekly Close double tops.
The YM chart looks much better than WM currently, and a pullback could well be a buying opportunity, but it looks decidedly like the buy level will only R300 plus lower than where we are now.
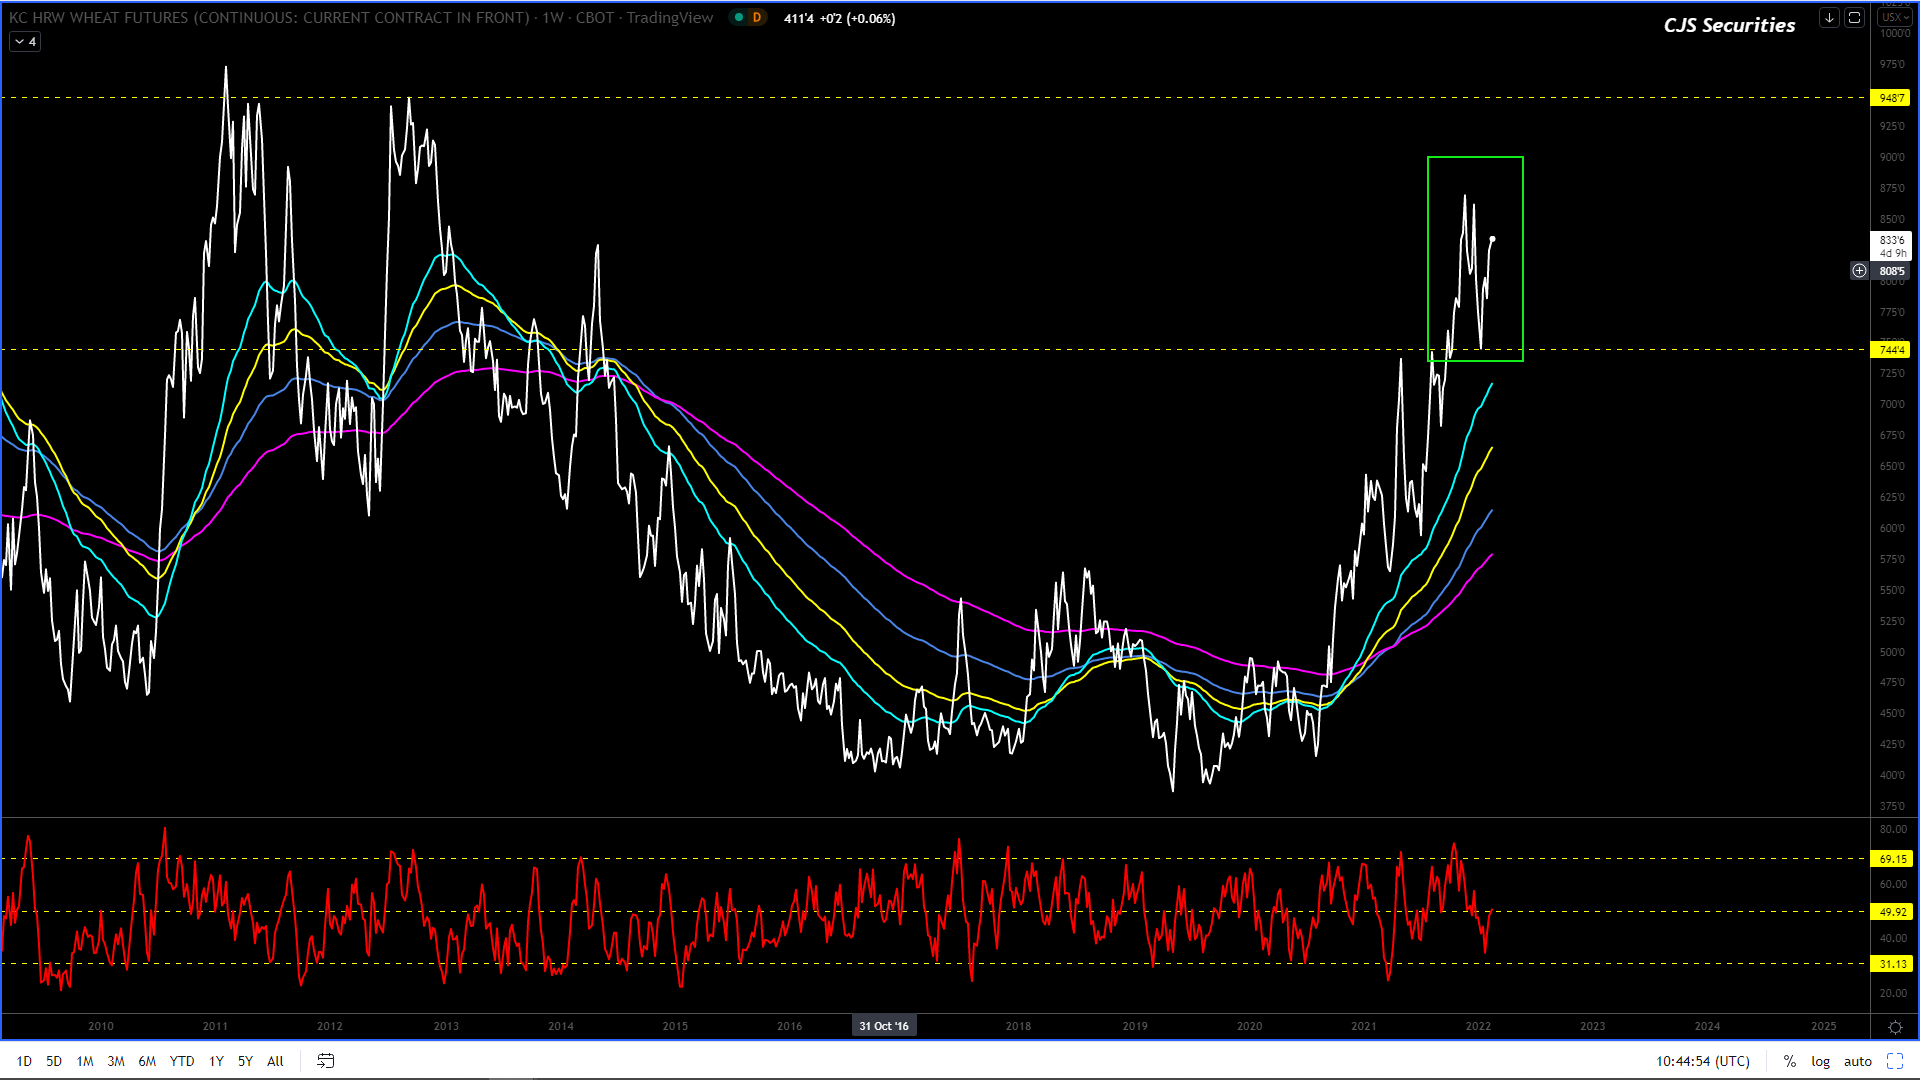
Weekly KC Wheat Continuous Close
Honestly there is nothing to add to the below.
I like this chart and would be looking at buying a move sub $8.00 – $7.44 as I can see the price heading towards $9.50 before making a significant correction! – this is aging really well, especially since the chart turned around at $7.44.
Keep your eyes on Corn VS Wheat as corn has limited upside, IMO.
An unwinding of the spread could give wheat the kick we require.
Weekly Chicago SRW Wheat Continuous
The below view seems pretty decent, but we will require a decent weekly close higher than where we are now.
I like this chart and would be looking at buying at best down to $7.43 as I can see the price heading towards $9.44 before making a significant correction! – another call aging well.
I truly feel that from here, the ST / MT low is in.
Daily Close KC Wheat v Chicago SRW Continuous Close
#No Change in Commentary
Gun to the head I would look to sell a rally over $0.30!– the gun is getting closer, and I am not changing my mind!
Weekly SAF Wheat Continuous Close
I still fancy the below commentary to play out, but we will require a decent rally this week or we could be a making a R300 move lower first.
The chart seems to be making a decent correction that should rally over R600 higher within the next ten weeks (it has STILL not broken higher yet).
A rally of this nature would be considered a selling opportunity.
Daily Matif Wheat Continuous Close
This chart is fugly and
volatile and all I can say is stay out!