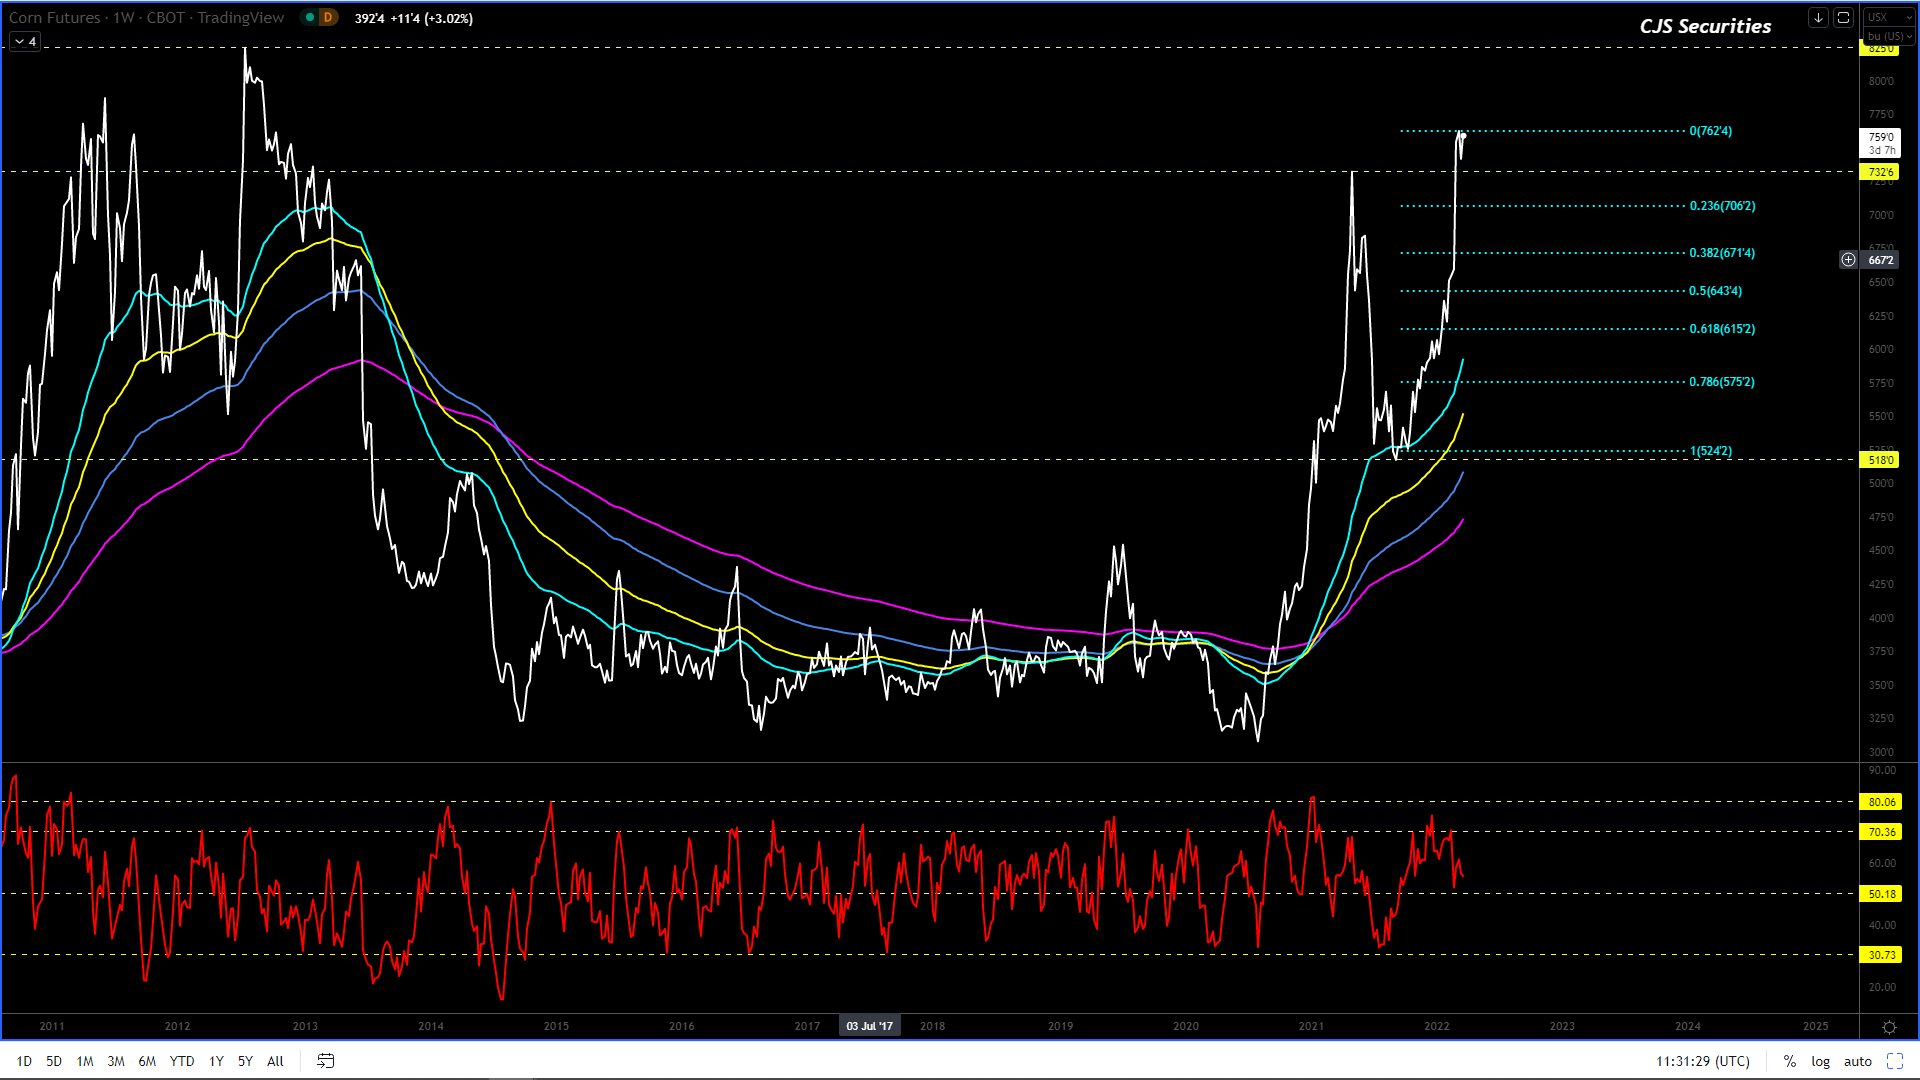
As a whole this chart
needs a decent correction after a rally of epic proportion.
I am looking for this
chart to pullback to around the $6.72level in the coming weeks.
This is in no way
a bear market, but rather a
correction in a greater bull market.
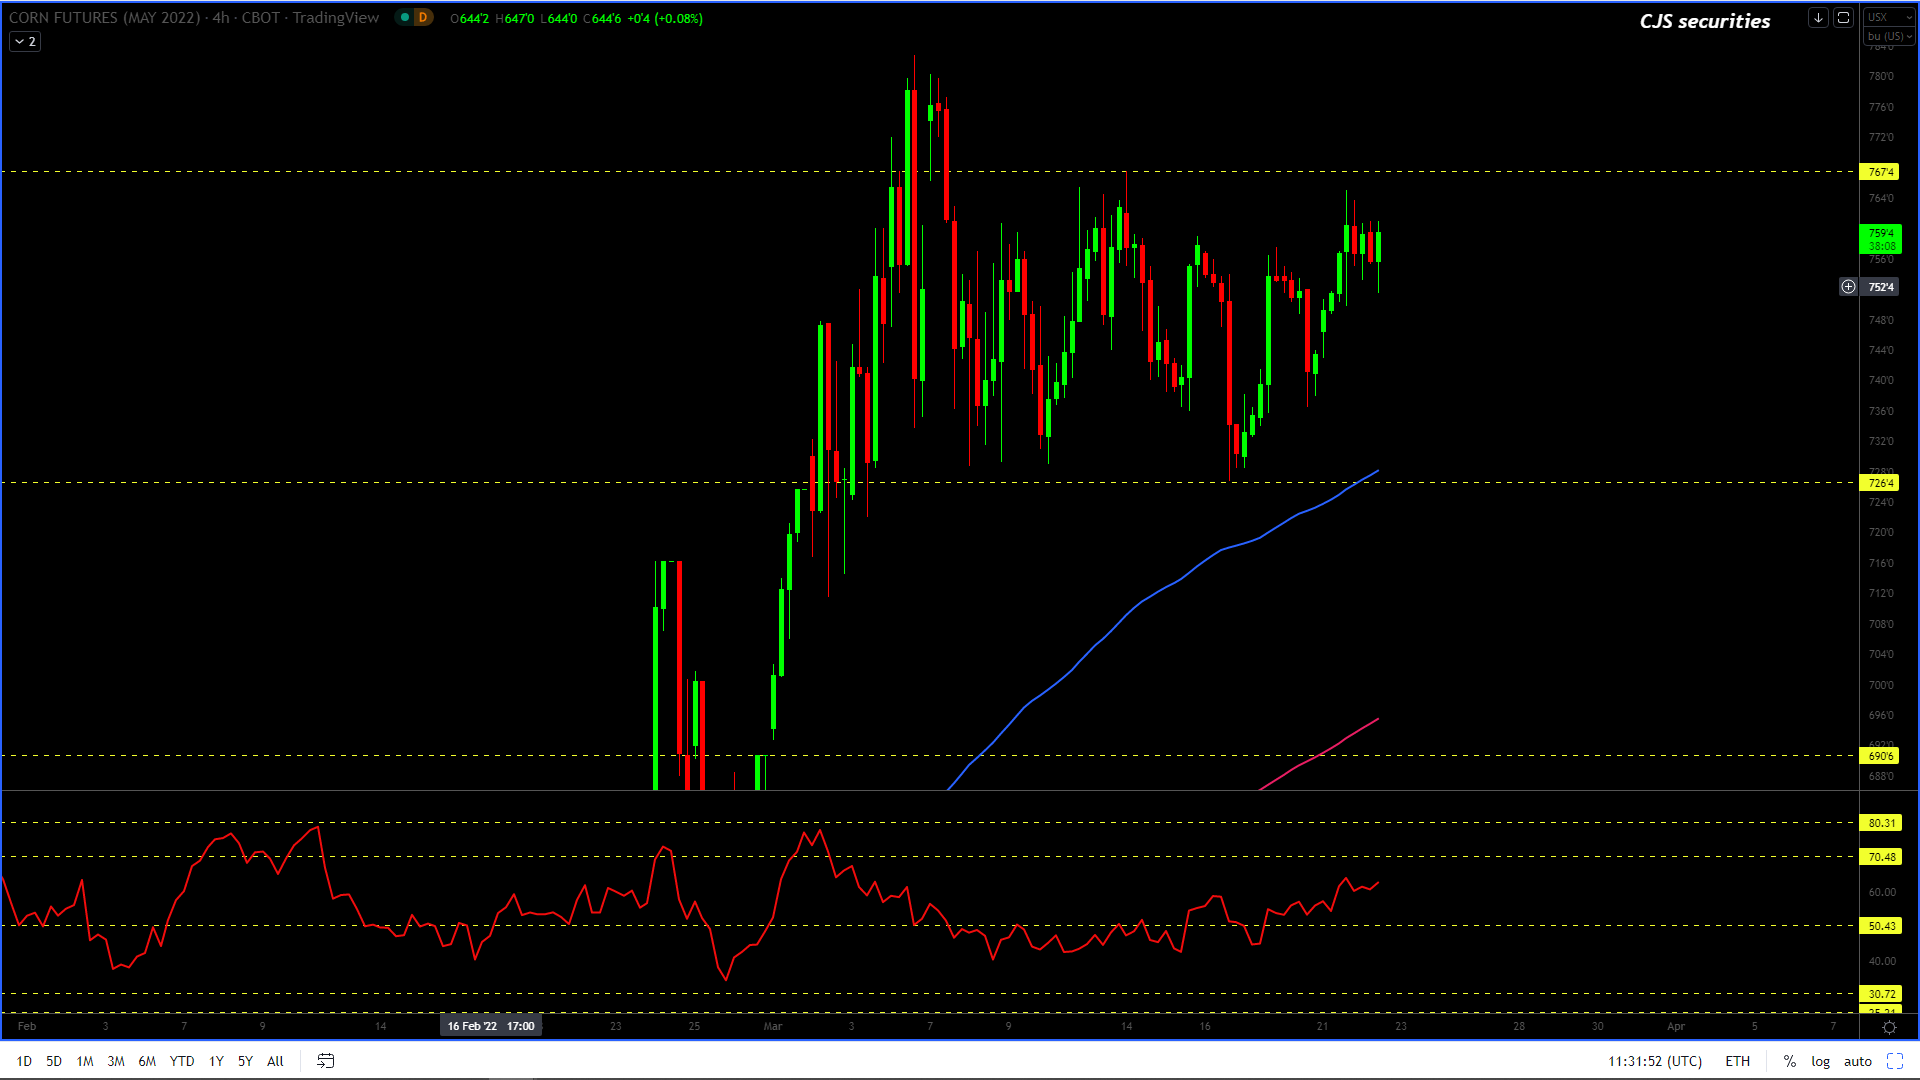
240 Min May22 Corn Candle Chart Close
The 240 min chart is now ugly (this indicates correction) and even though it could make new highs I feel they will be short lived and I still fancy downside targets of between $7.16 -$7.05.
I would be very wary of all these markets as a peace deal even if only a short term deal, will lead to a sentiment change.
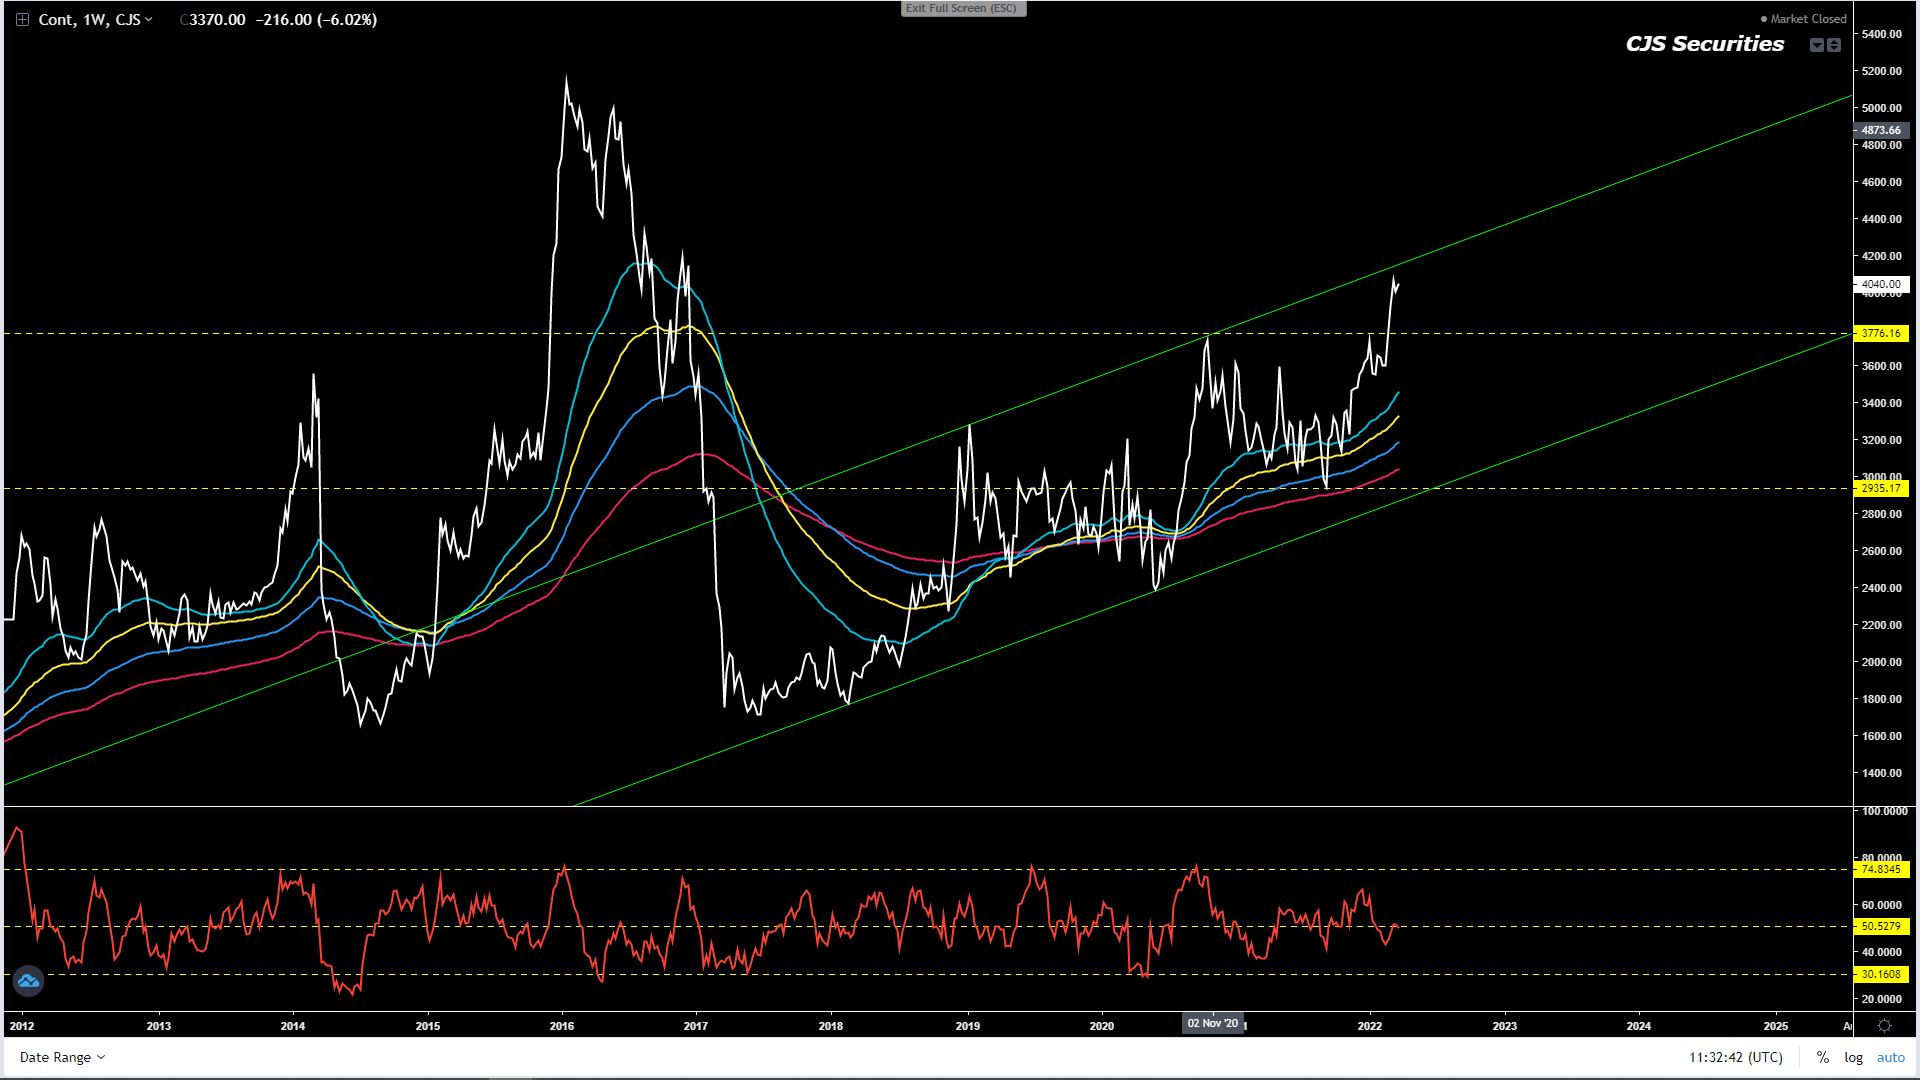
Weekly WM Continuous Close
#No Change in Commentary
I can’t find a reason to be short this chart with only the top of the channel providing some resistance.
I have no strong views other than to urge producers to price as anything can happen.
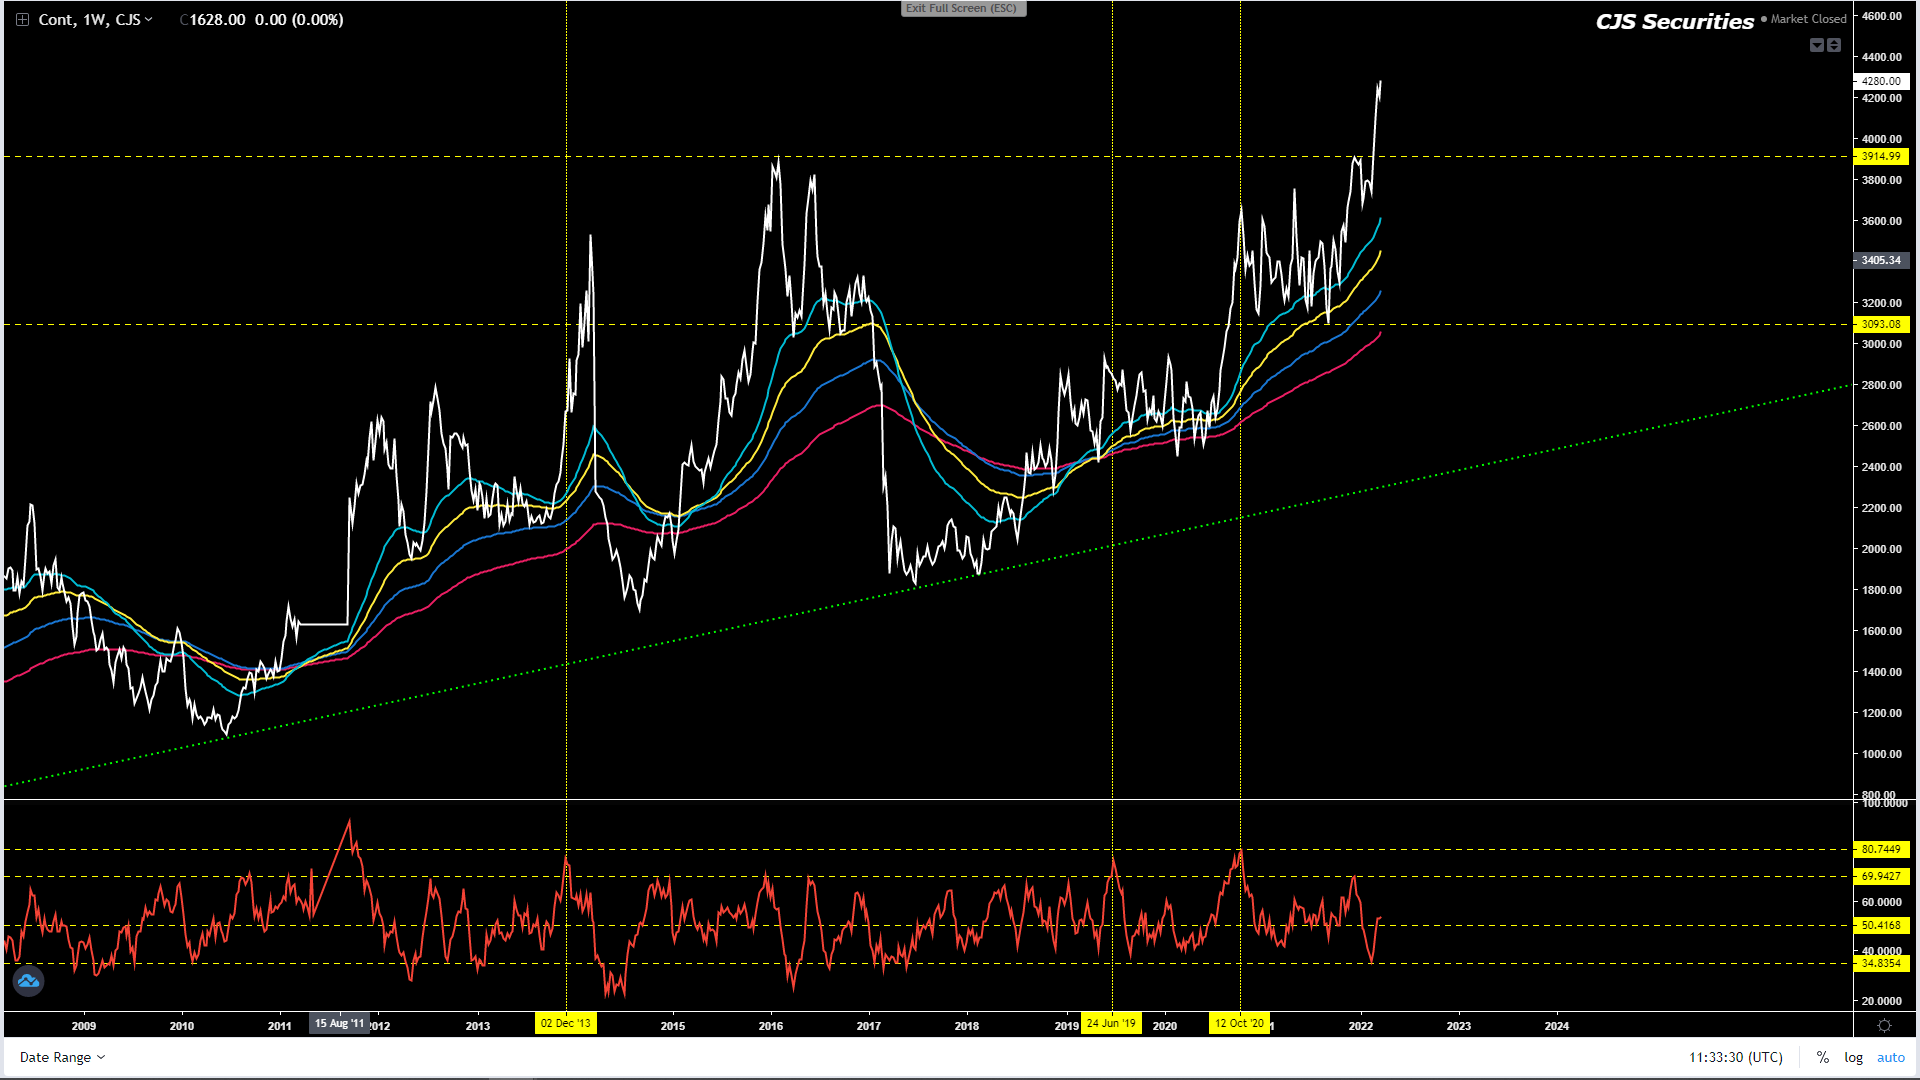
Weekly YM Continuous Close
#No Change in Commentary
At ATH’s I cannot find a reason to sell this chart at all or pick tops.
I have no strong views other than to urge producers to price as anything can happen.
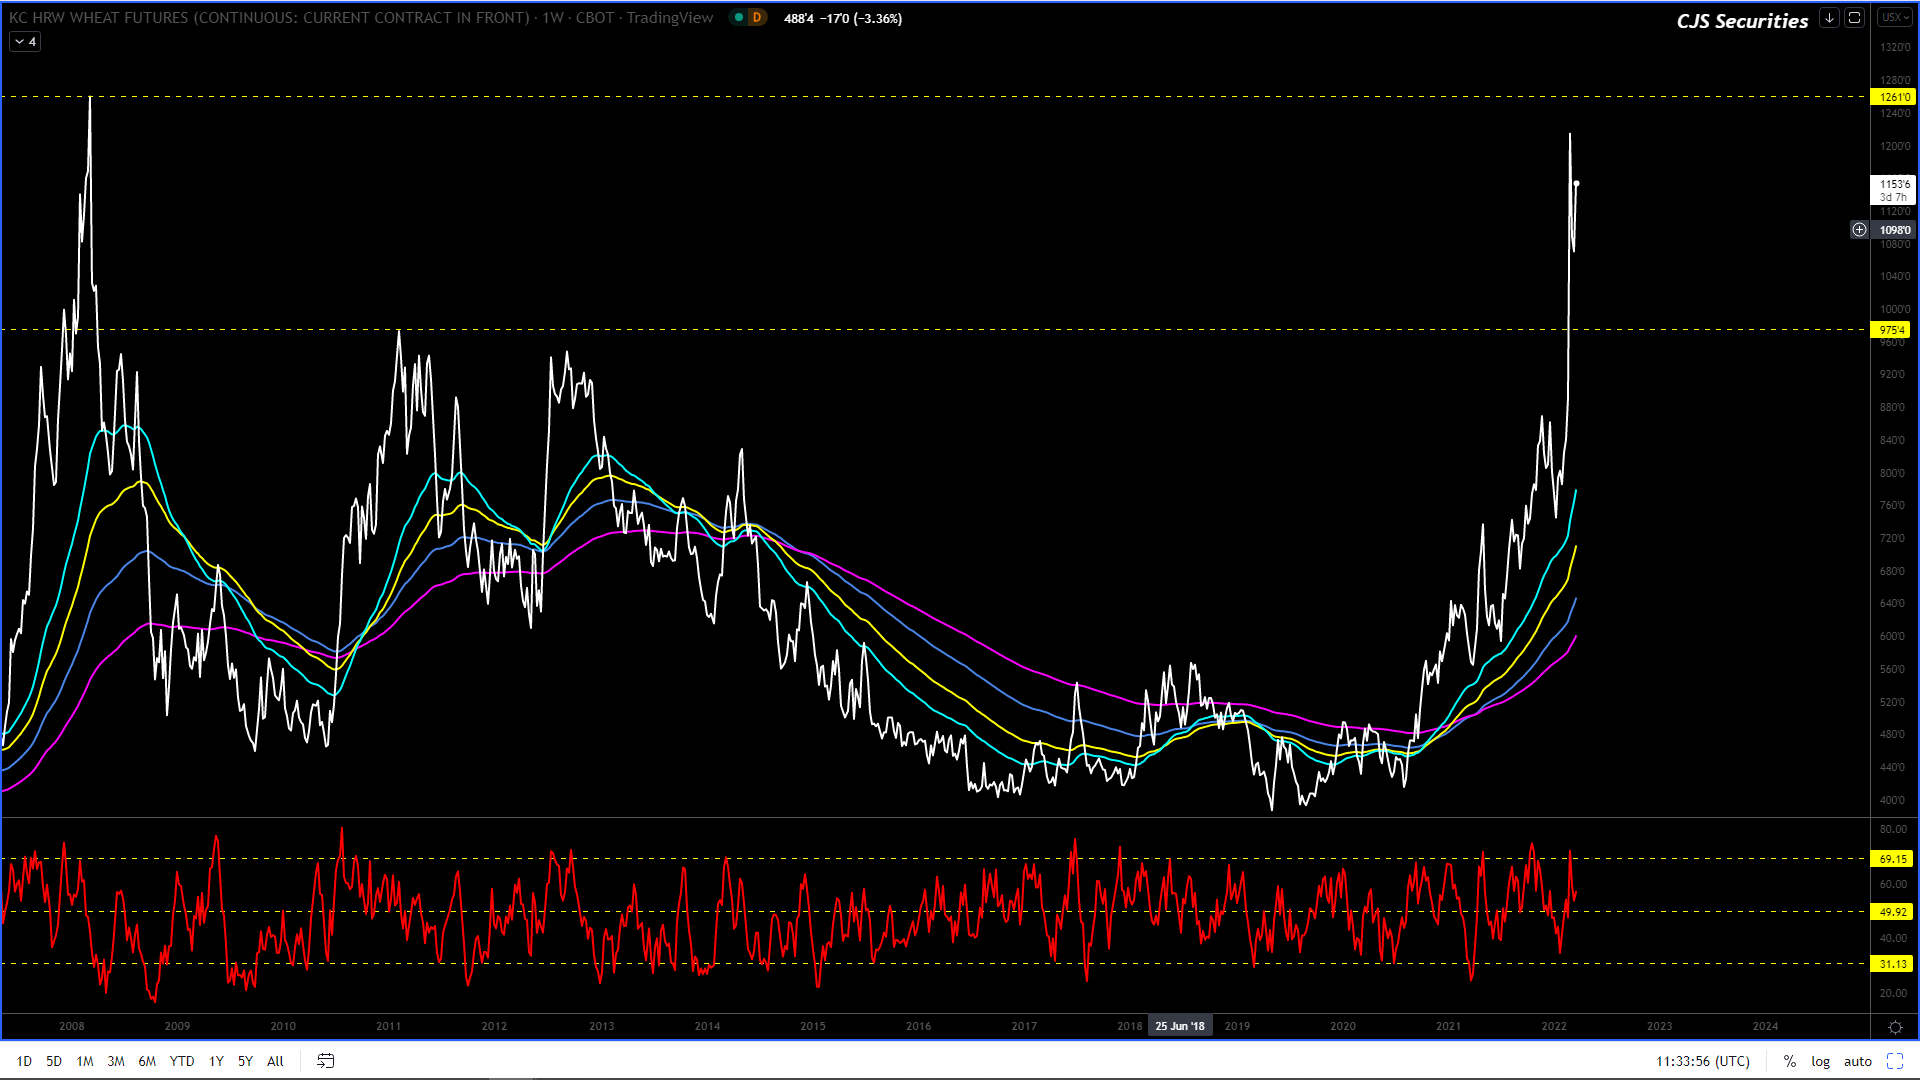
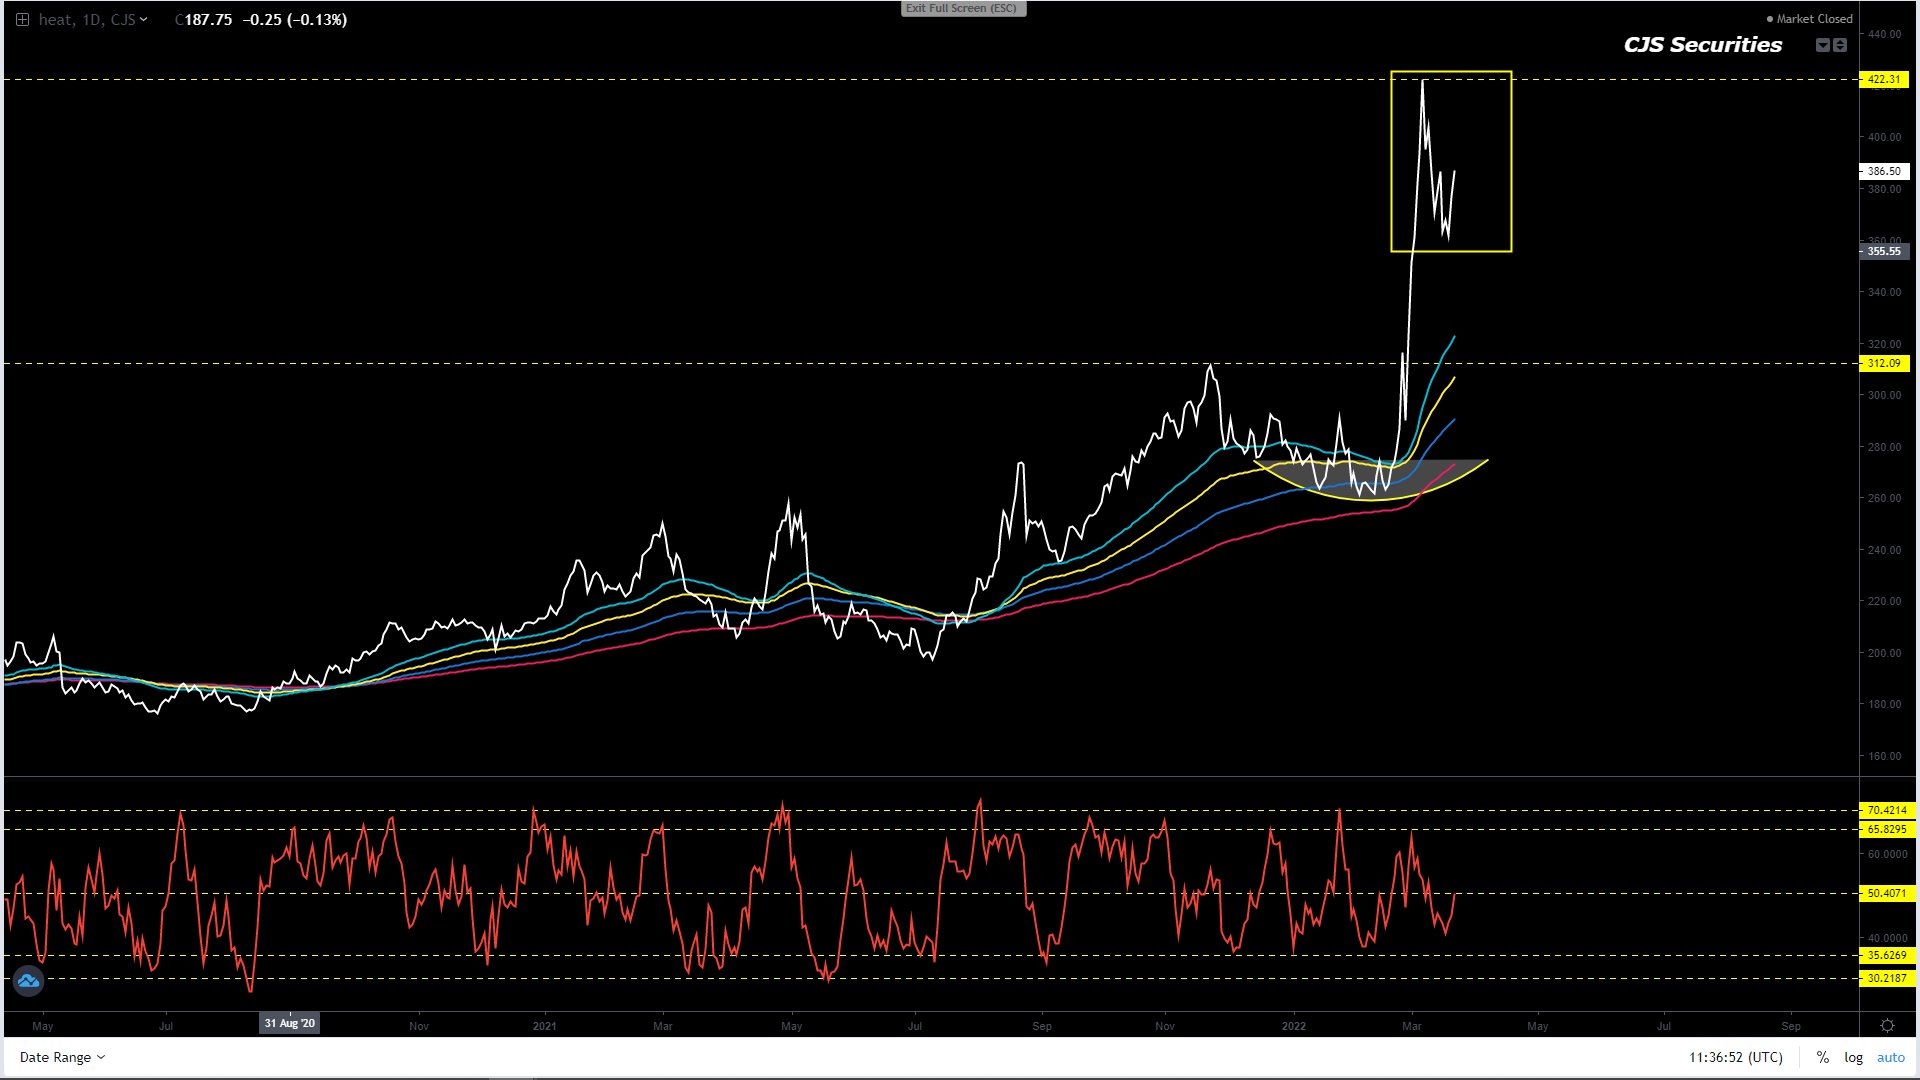
Weekly KC Wheat Continuous Close
#No Change in Commentary
Wheat has been the wildest of rides and the market now appears to be well into its corrective phase.
Stay out until further notice.
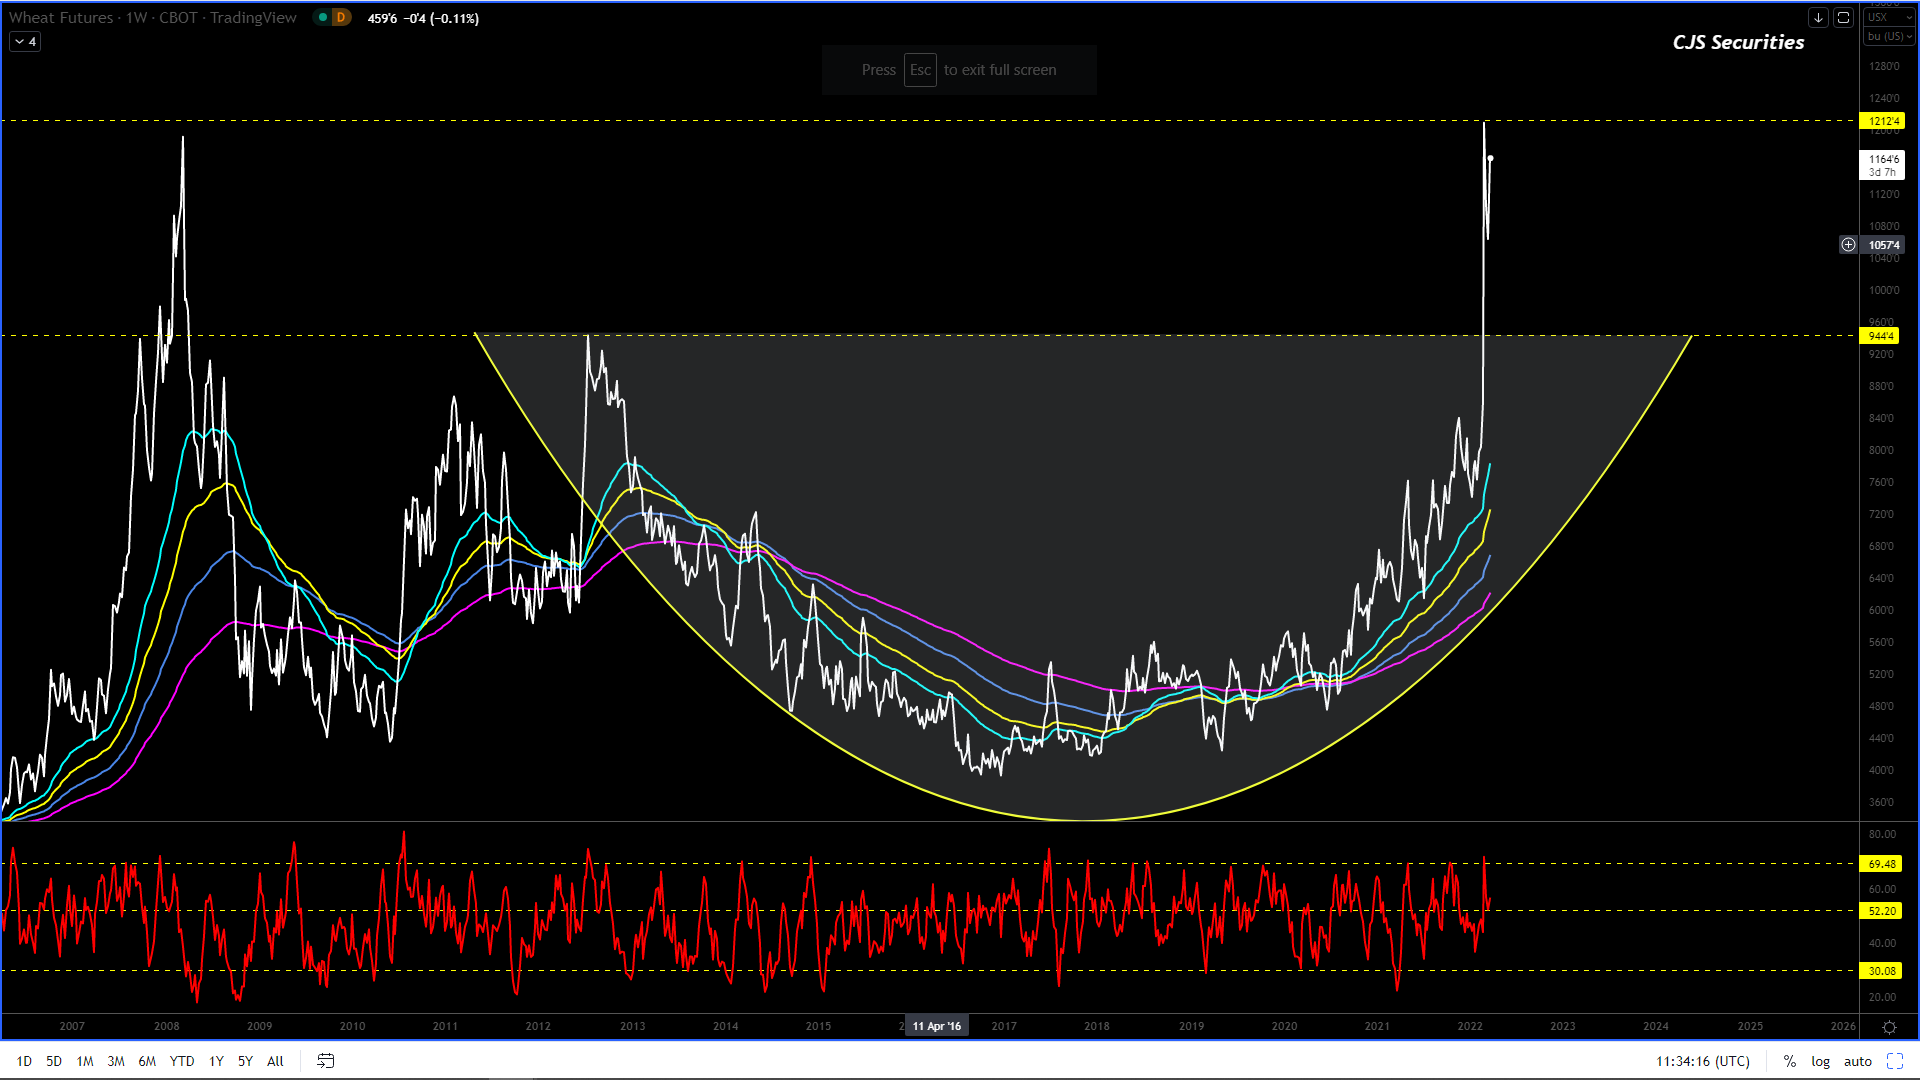
Weekly Chicago SRW Wheat Continuous
#No Change in Commentary
Wheat has been the wildest of rides and the market now appears to be well into its corrective phase.
Stay out until further notice.
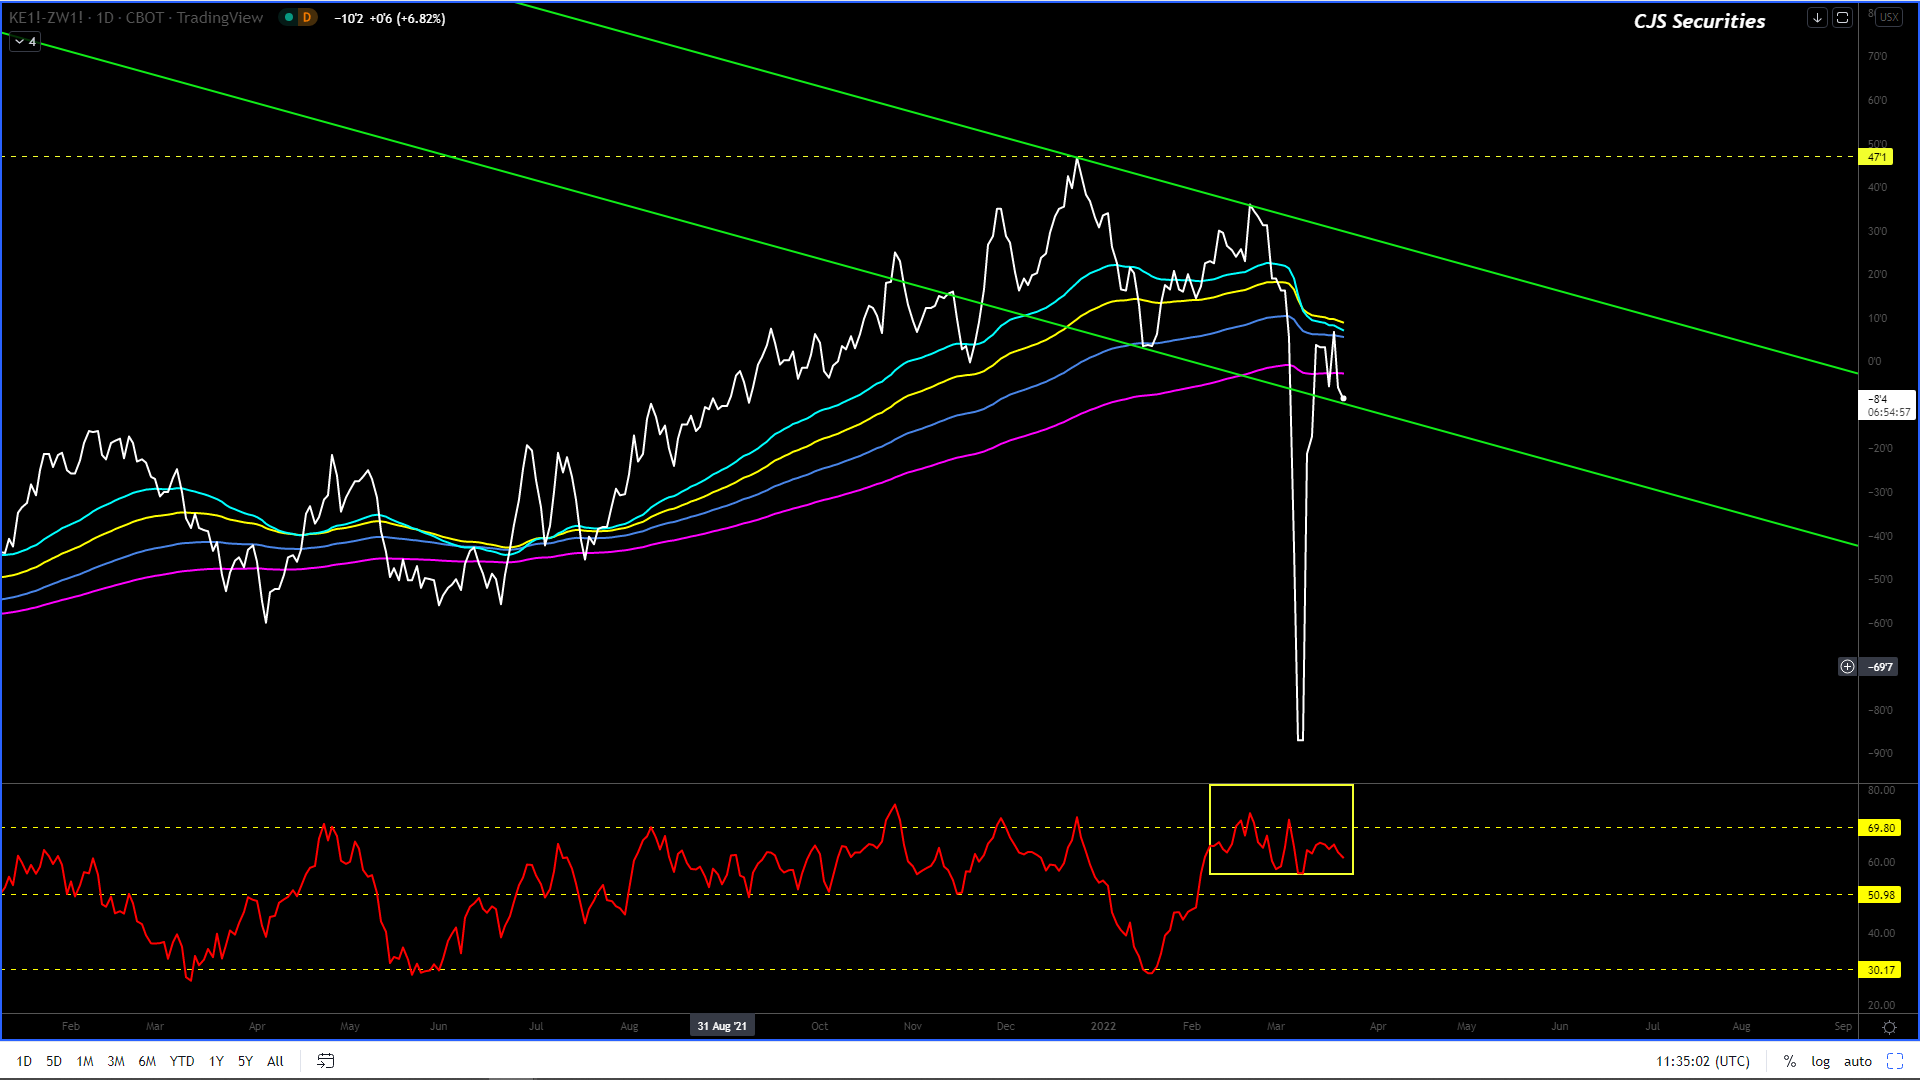
Daily Close KC Wheat v Chicago SRW Continuous Close
#No Change in Commentary
This chart is now as ugly as sin I will be staying out for some time yet.
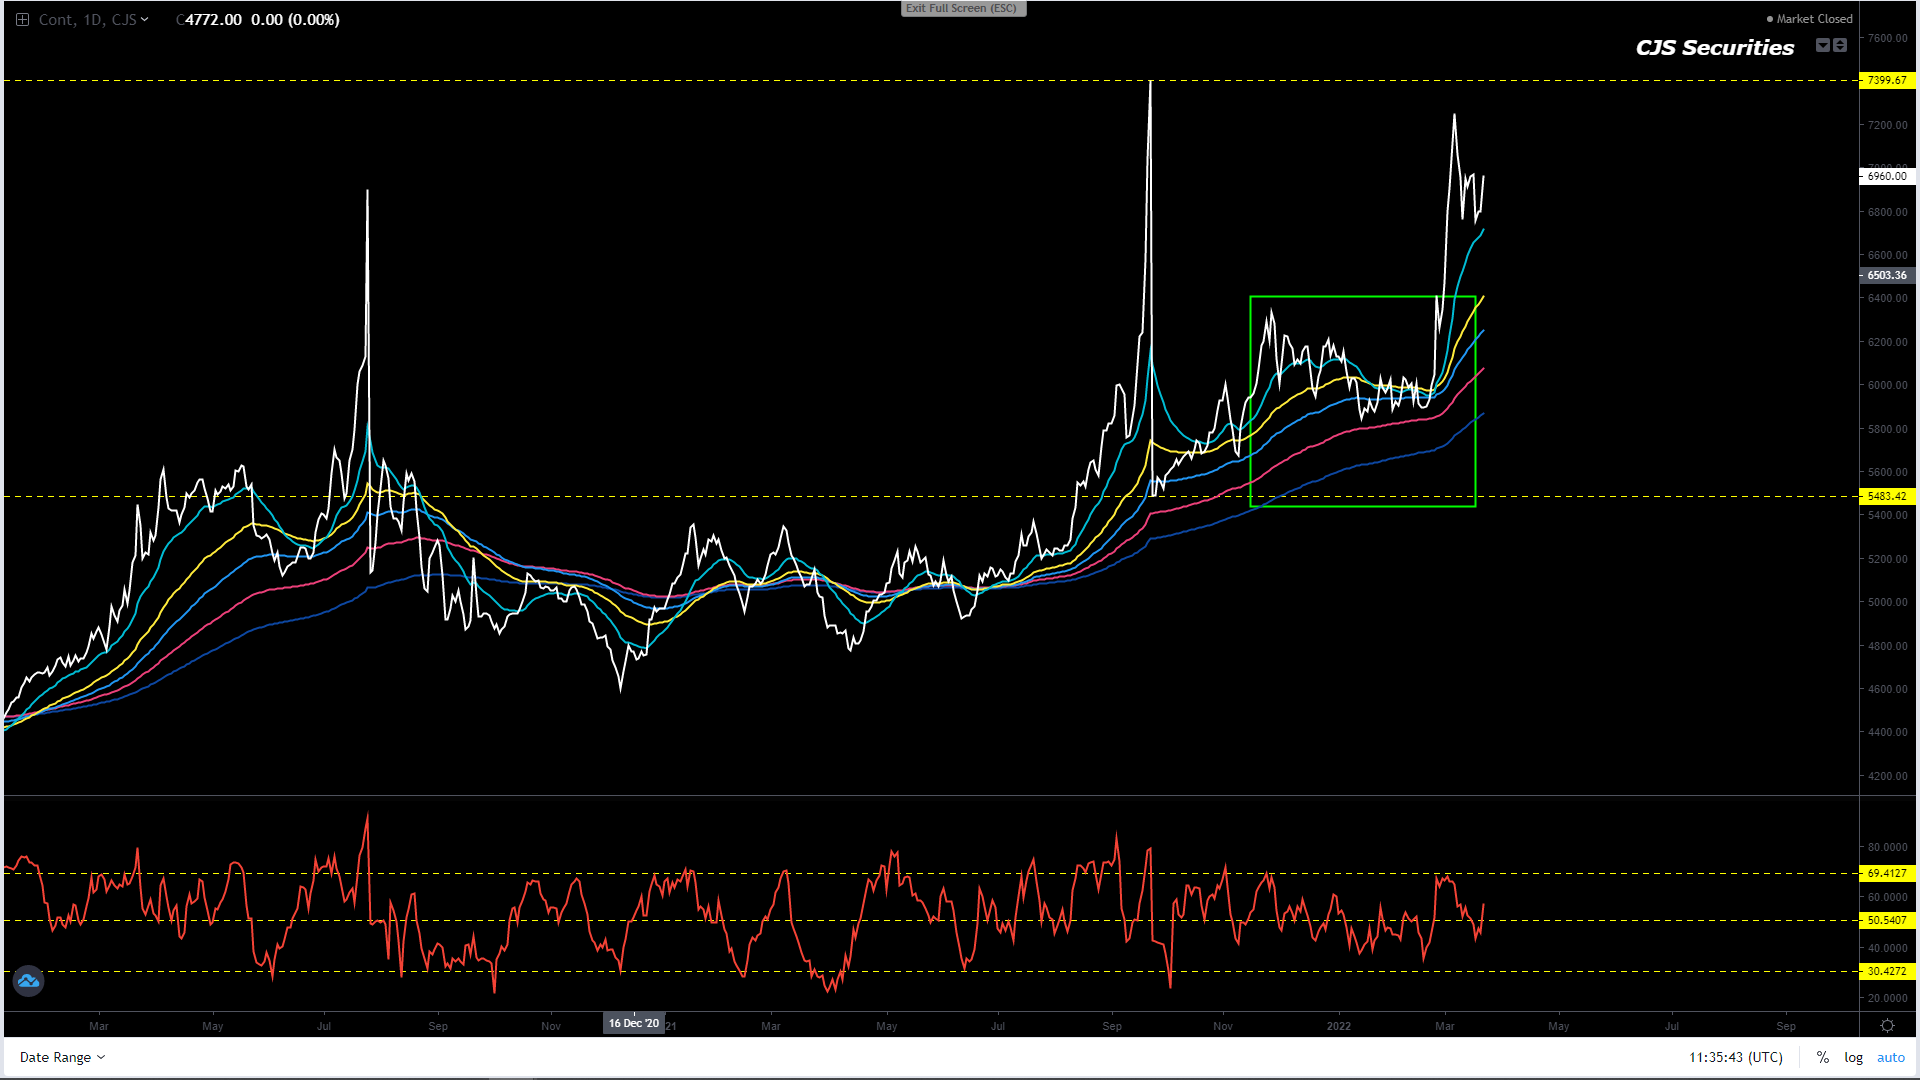
Weekly SAF Wheat Continuous Close
Much like its US counter part, SAF wheat is in a corrective phase. – The correction could be over, but I don’t have the constitution to buy it here!
I will be patiently watching to see how this plays out over the next few weeks before looking to get in.
Daily Matif Wheat Continuous Close
Based on the current formation the chart seems to have another leg higher.