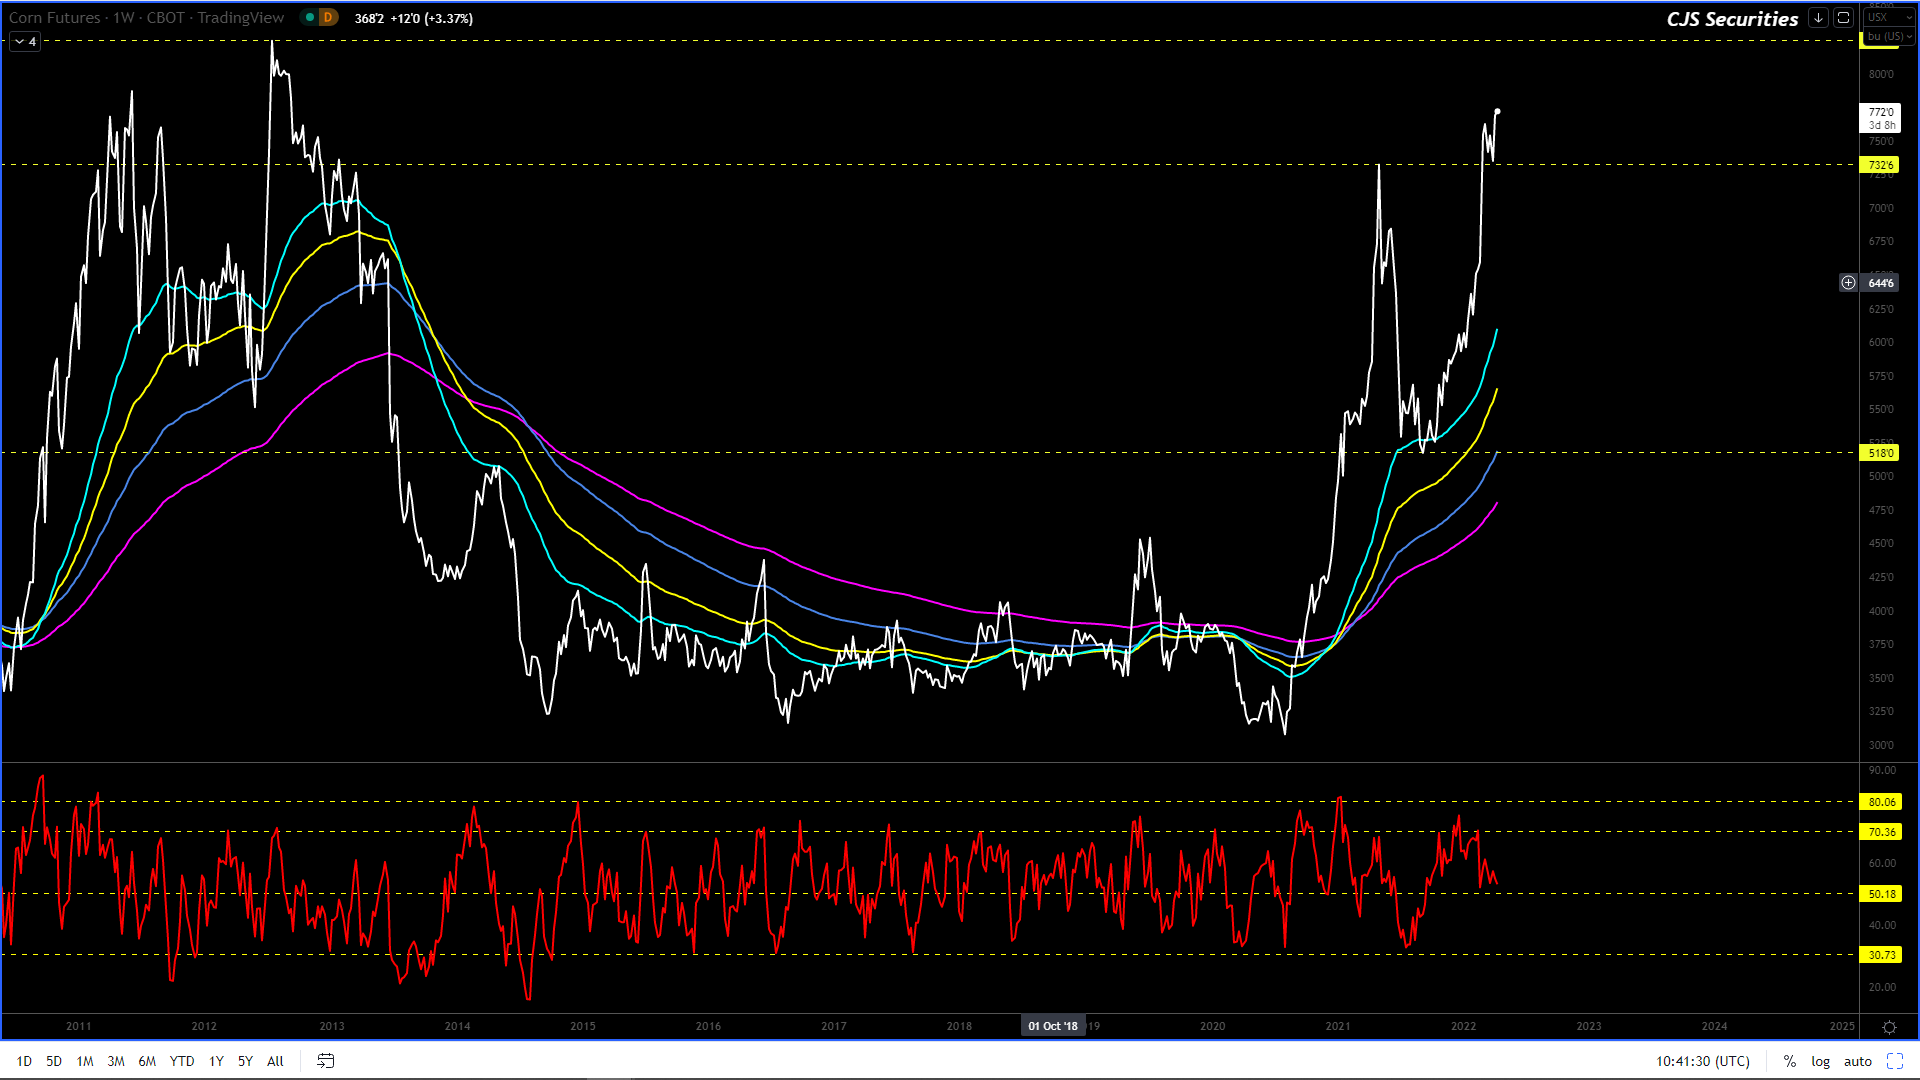
So much for the correction, and even though we are at new highs I would struggle to get long here on a technical basis, this is most likely why it will rally hard.
If this rally fails I would look for a pullback down to the $7.05 level in the coming weeks.
Should this chart correct it would in no way be a bear market, but rather a correction in a greater bull market.
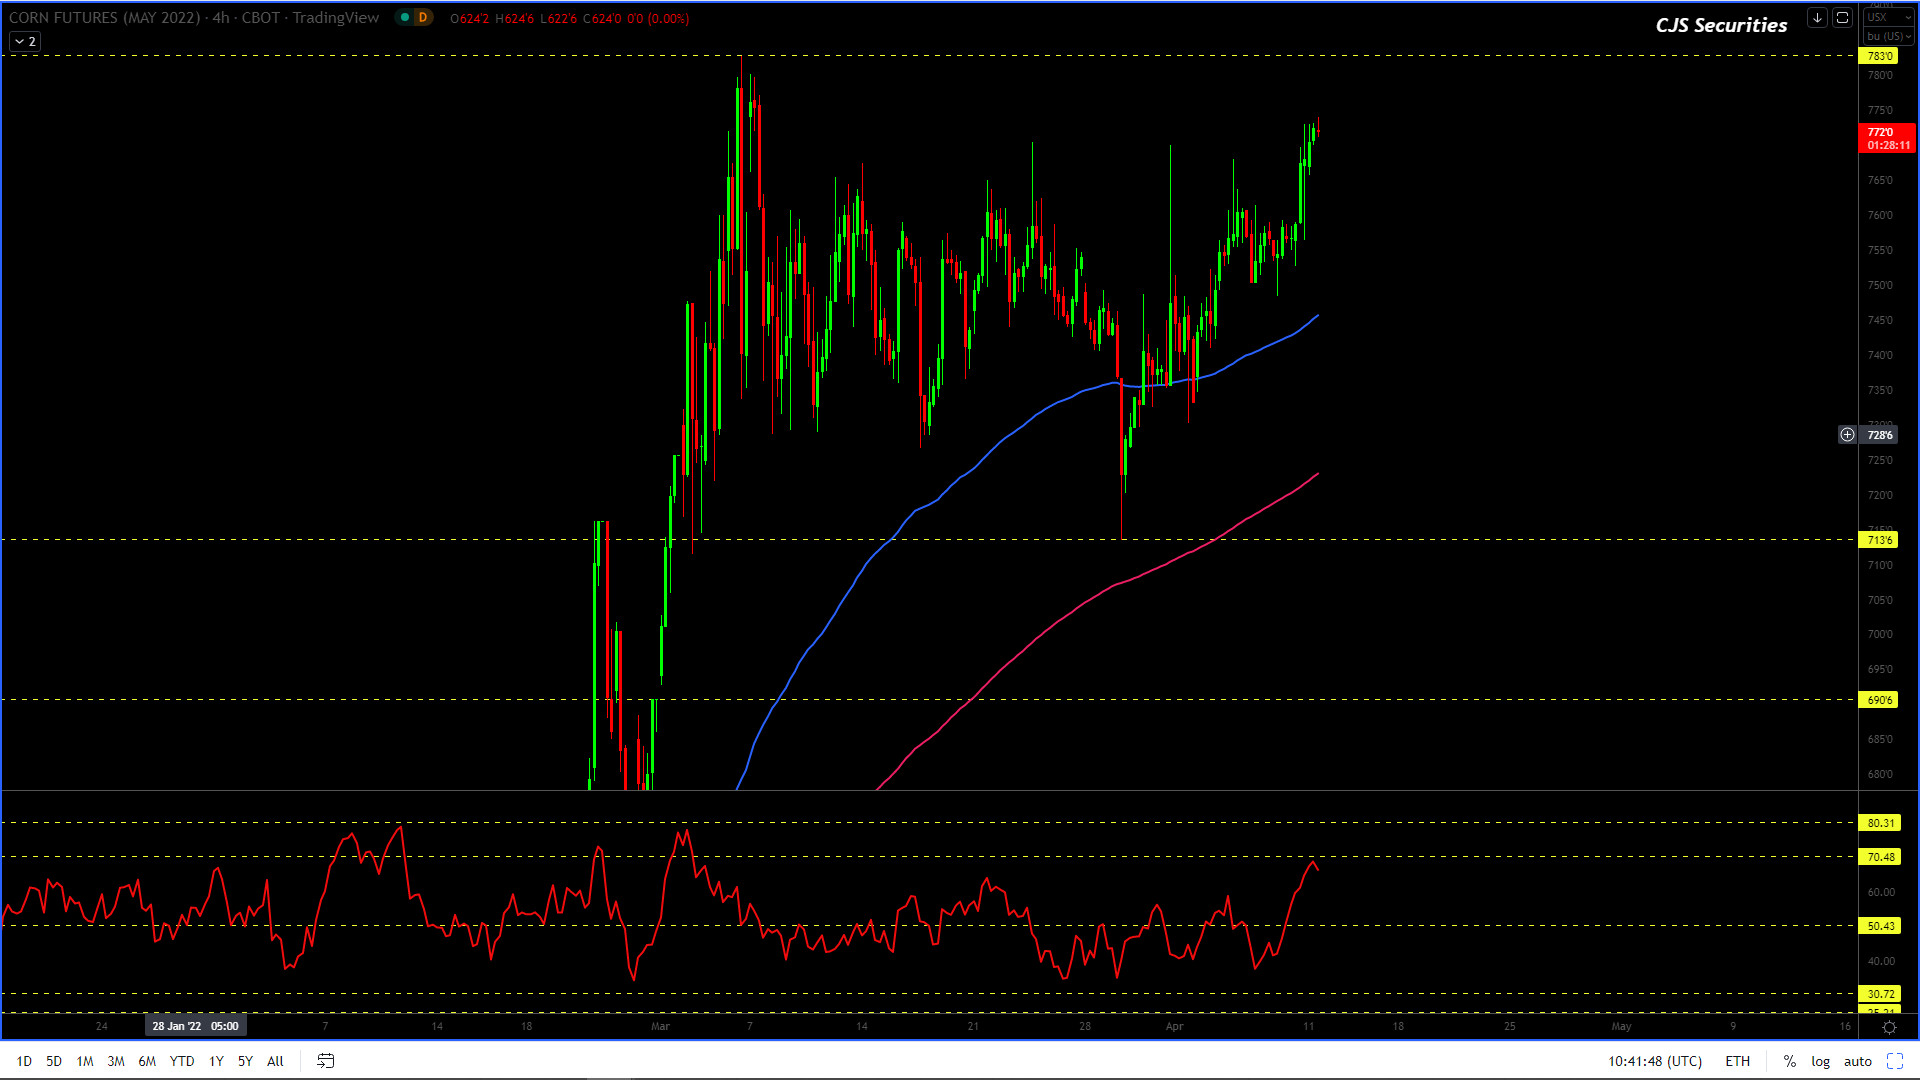
240 Min May22 Corn Candle Chart Close
The 240 min chart is very interesting as it has a few potential formations.
It could make double tops and fail, it could have a false break and fail or it could just break hard through the tops.
I am as unsure of this as I am of the next French President and hence when in doubt stay well out!
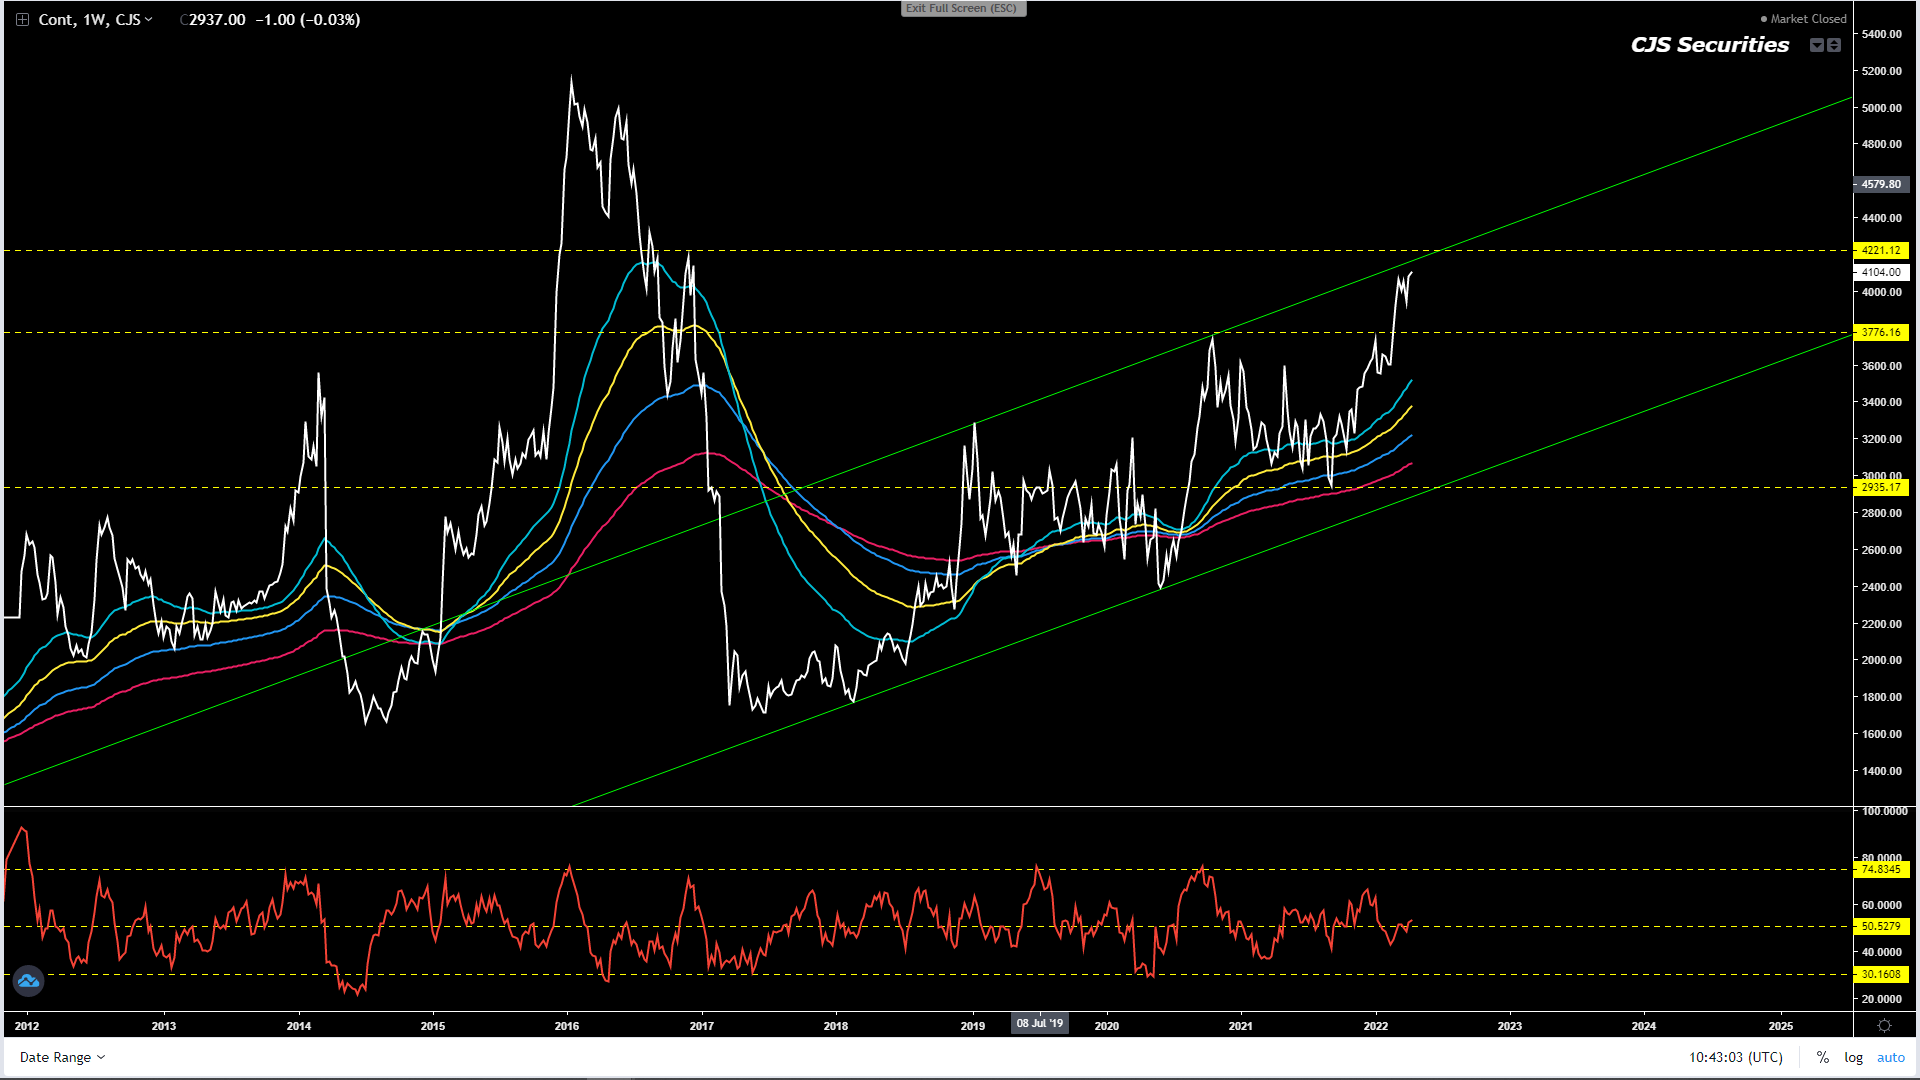
Weekly WM Continuous Close
The chart can still trade higher in the ST and possibly print as high as R4400 before coming lower.
I can’t find a reason to be short this chart with only the top of the channel providing some resistance.
I have no strong views other than to urge producers to price as anything can happen.
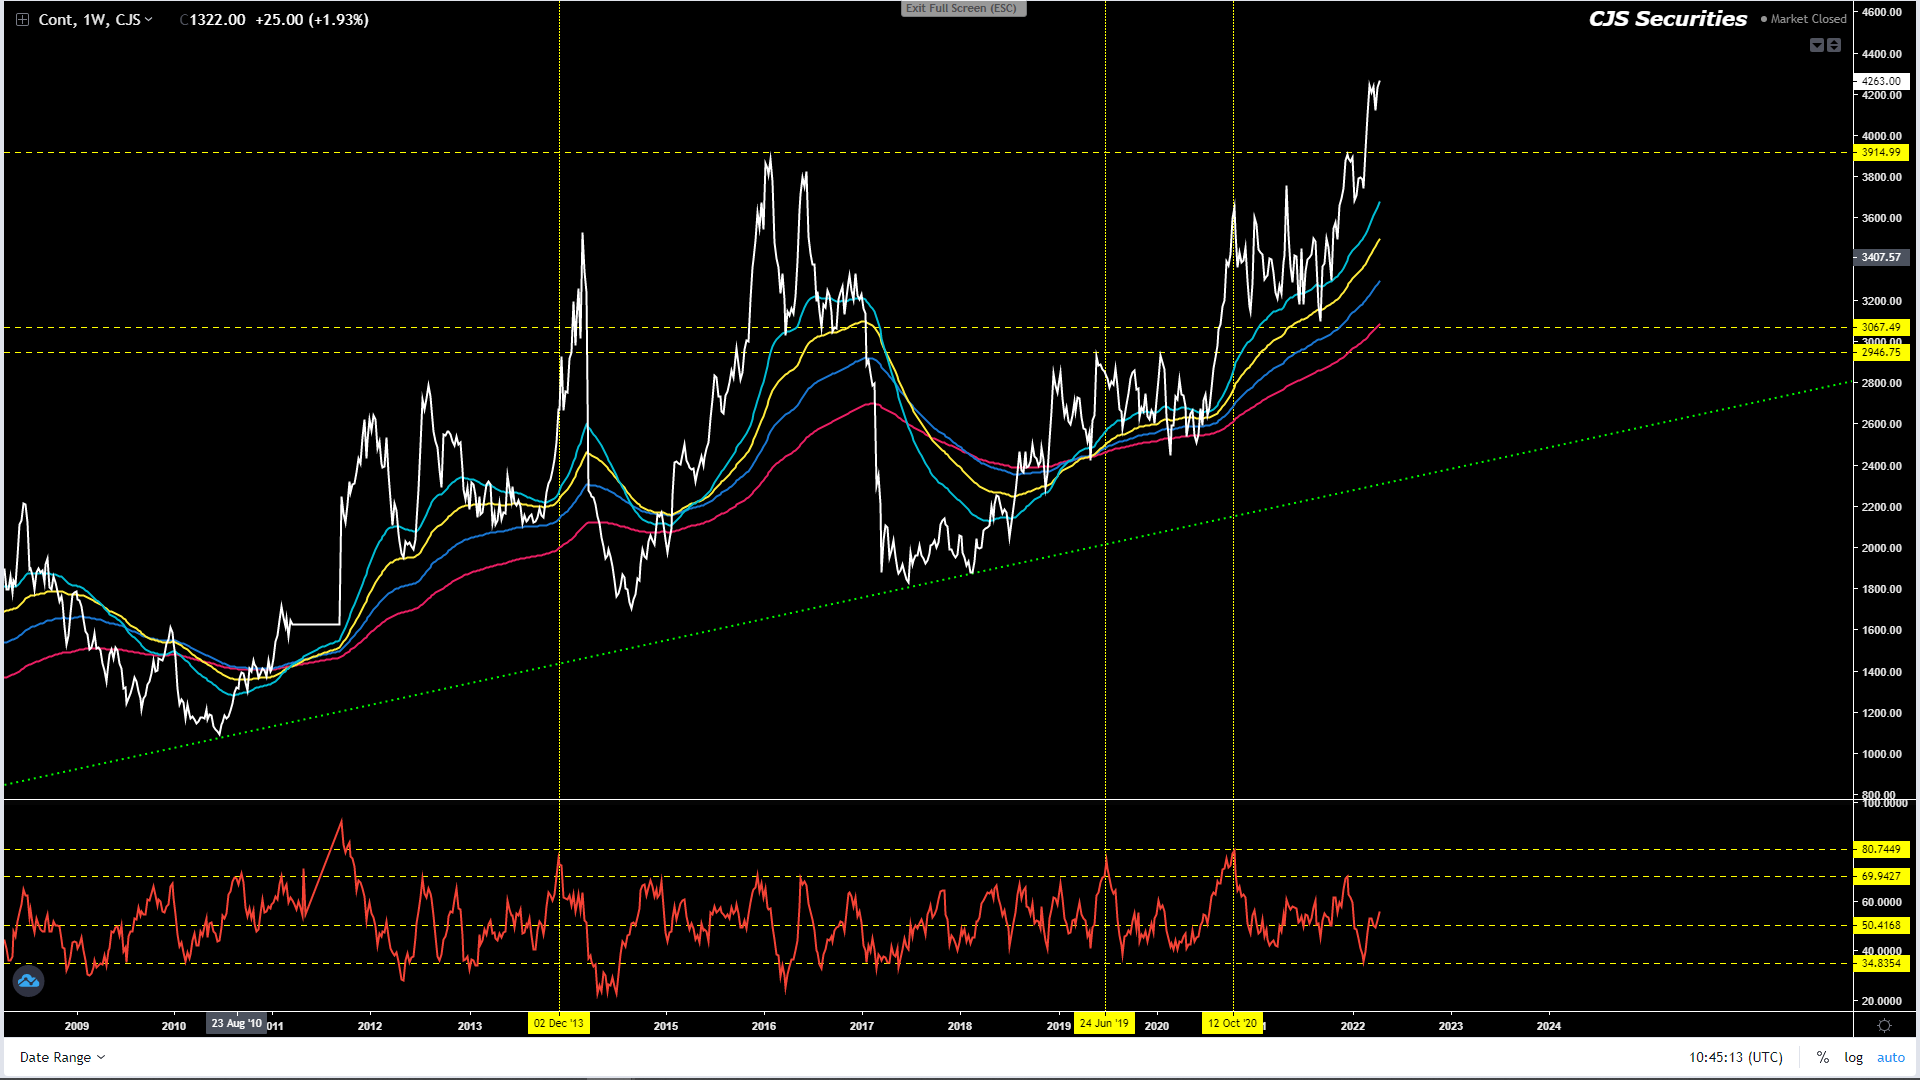
Weekly YM Continuous Close
The techs looks really good and I cannot find a reason to be short this chart.
We could easily see the price rally from here.
I have no strong views other than to urge producers to price as anything can happen.
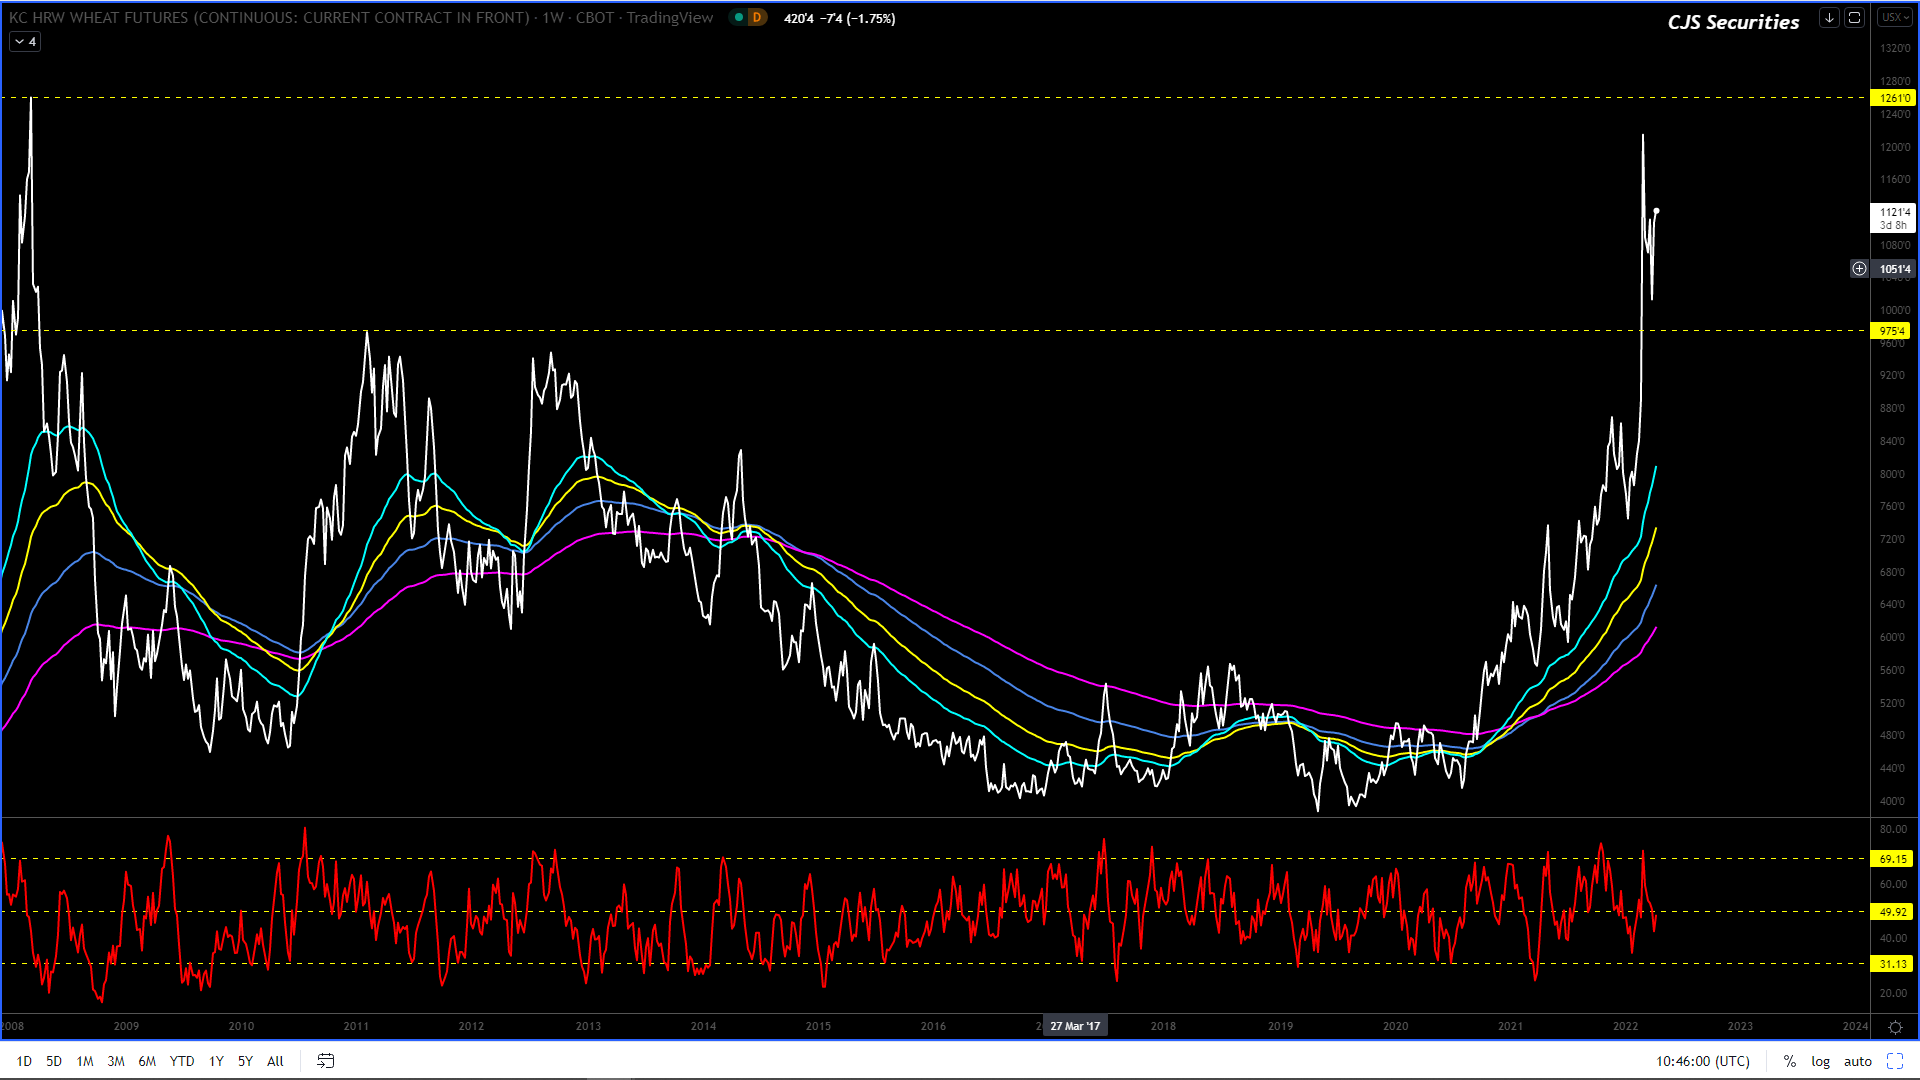
Weekly KC Wheat Continuous Close
The correction could be well and truly over and we will now monitor the formation over the week before looking at getting long.
Our bias is now to the long side.
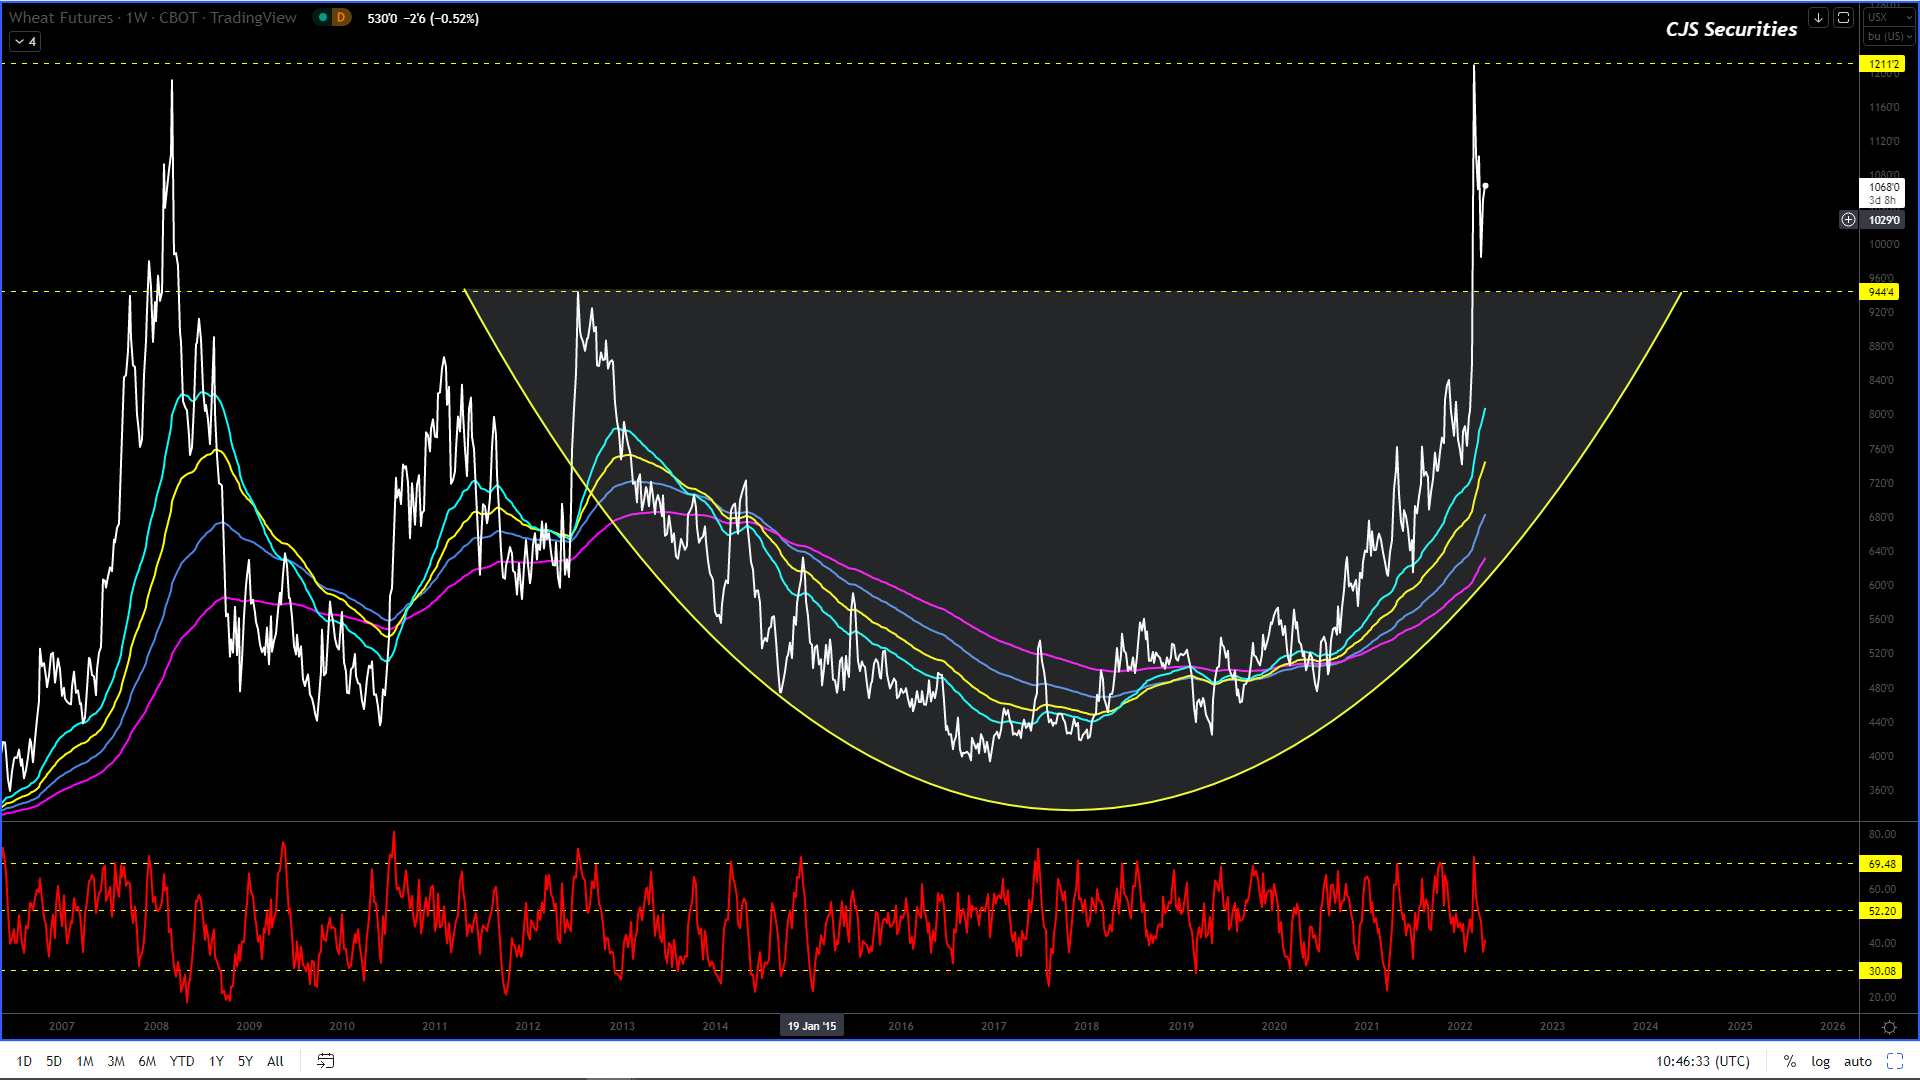
Weekly Chicago SRW Wheat Continuous
The correction could be well and truly over and we will now monitor the formation over the week before looking at getting long.
Our bias is now to the long side.
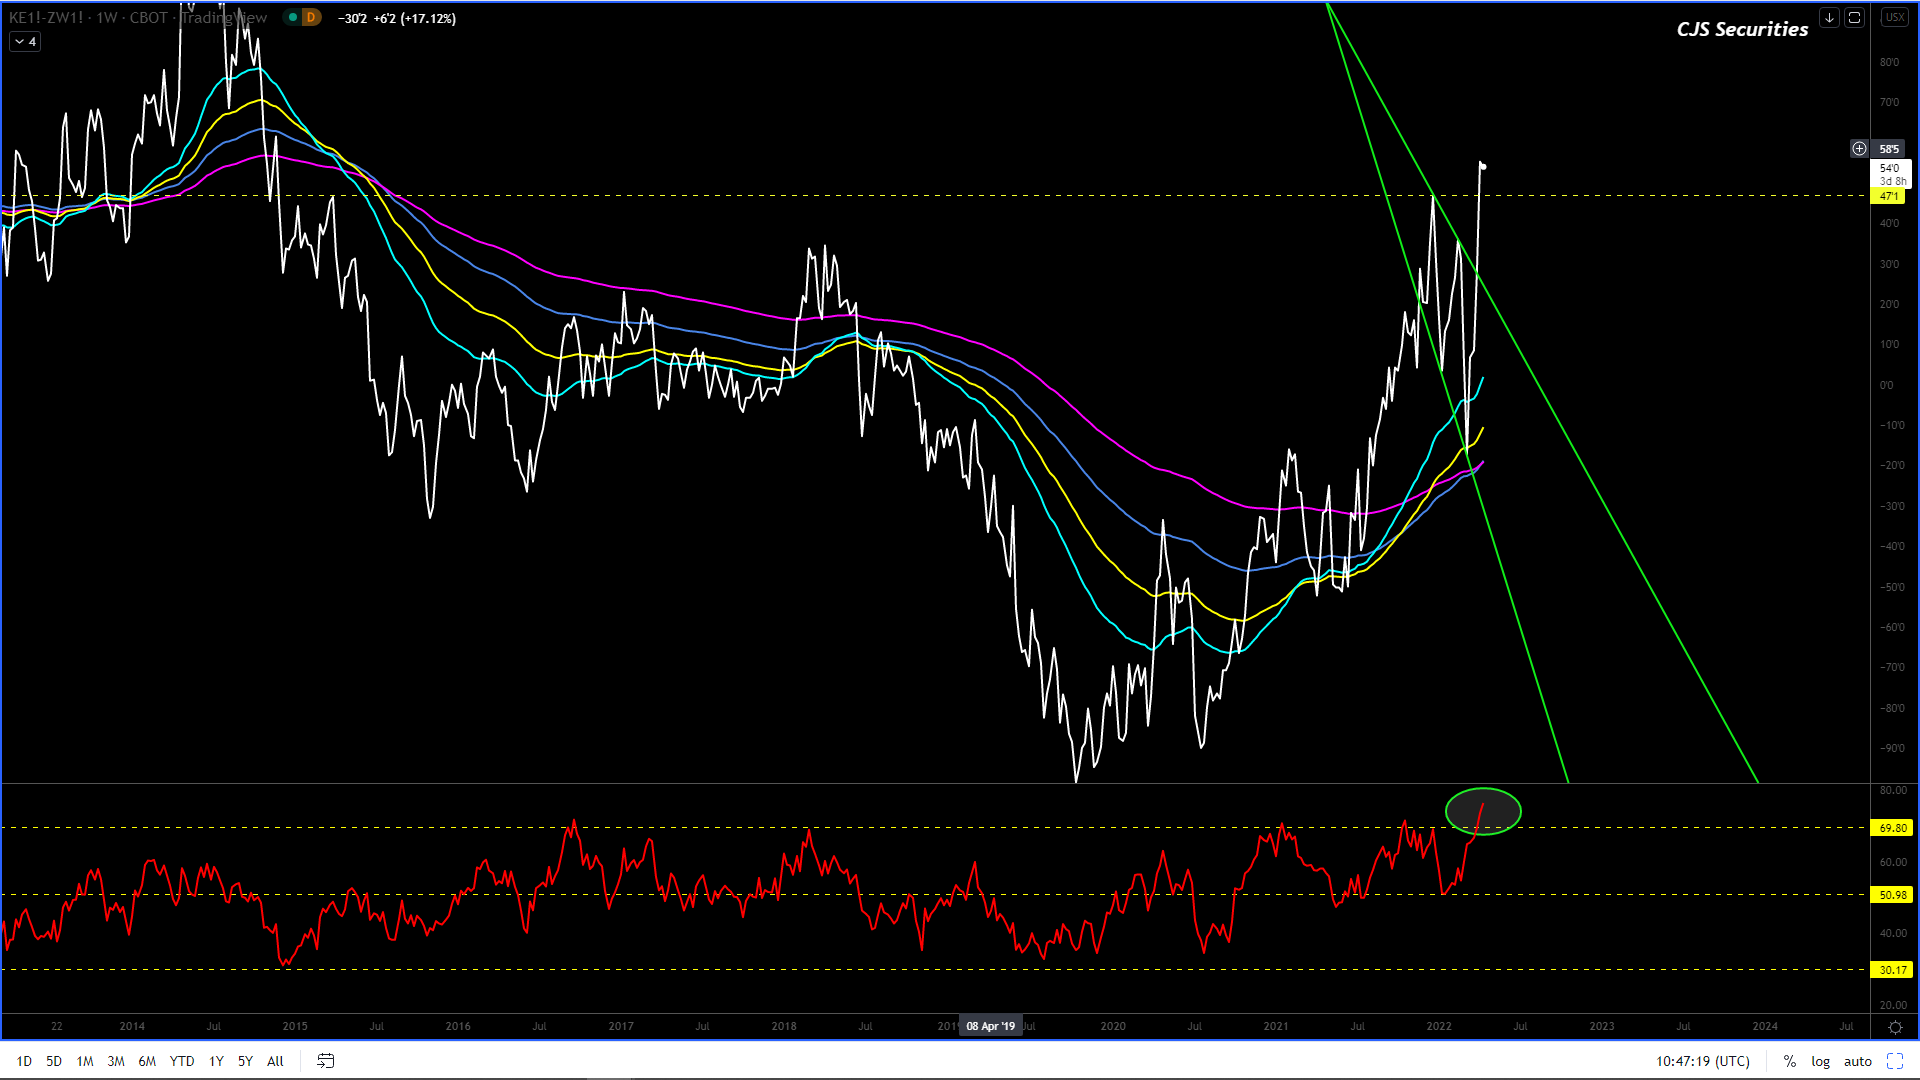
Weekly Close KC Wheat v Chicago SRW Continuous Close
I want to get long this chart, but will need to wait for a pullback.
The chart is now highly overbought on a weekly basis.
Weekly SAF Wheat Continuous Close
This chart much like US wheat seems to done with its correction and we will be looking at getting long under R6900.
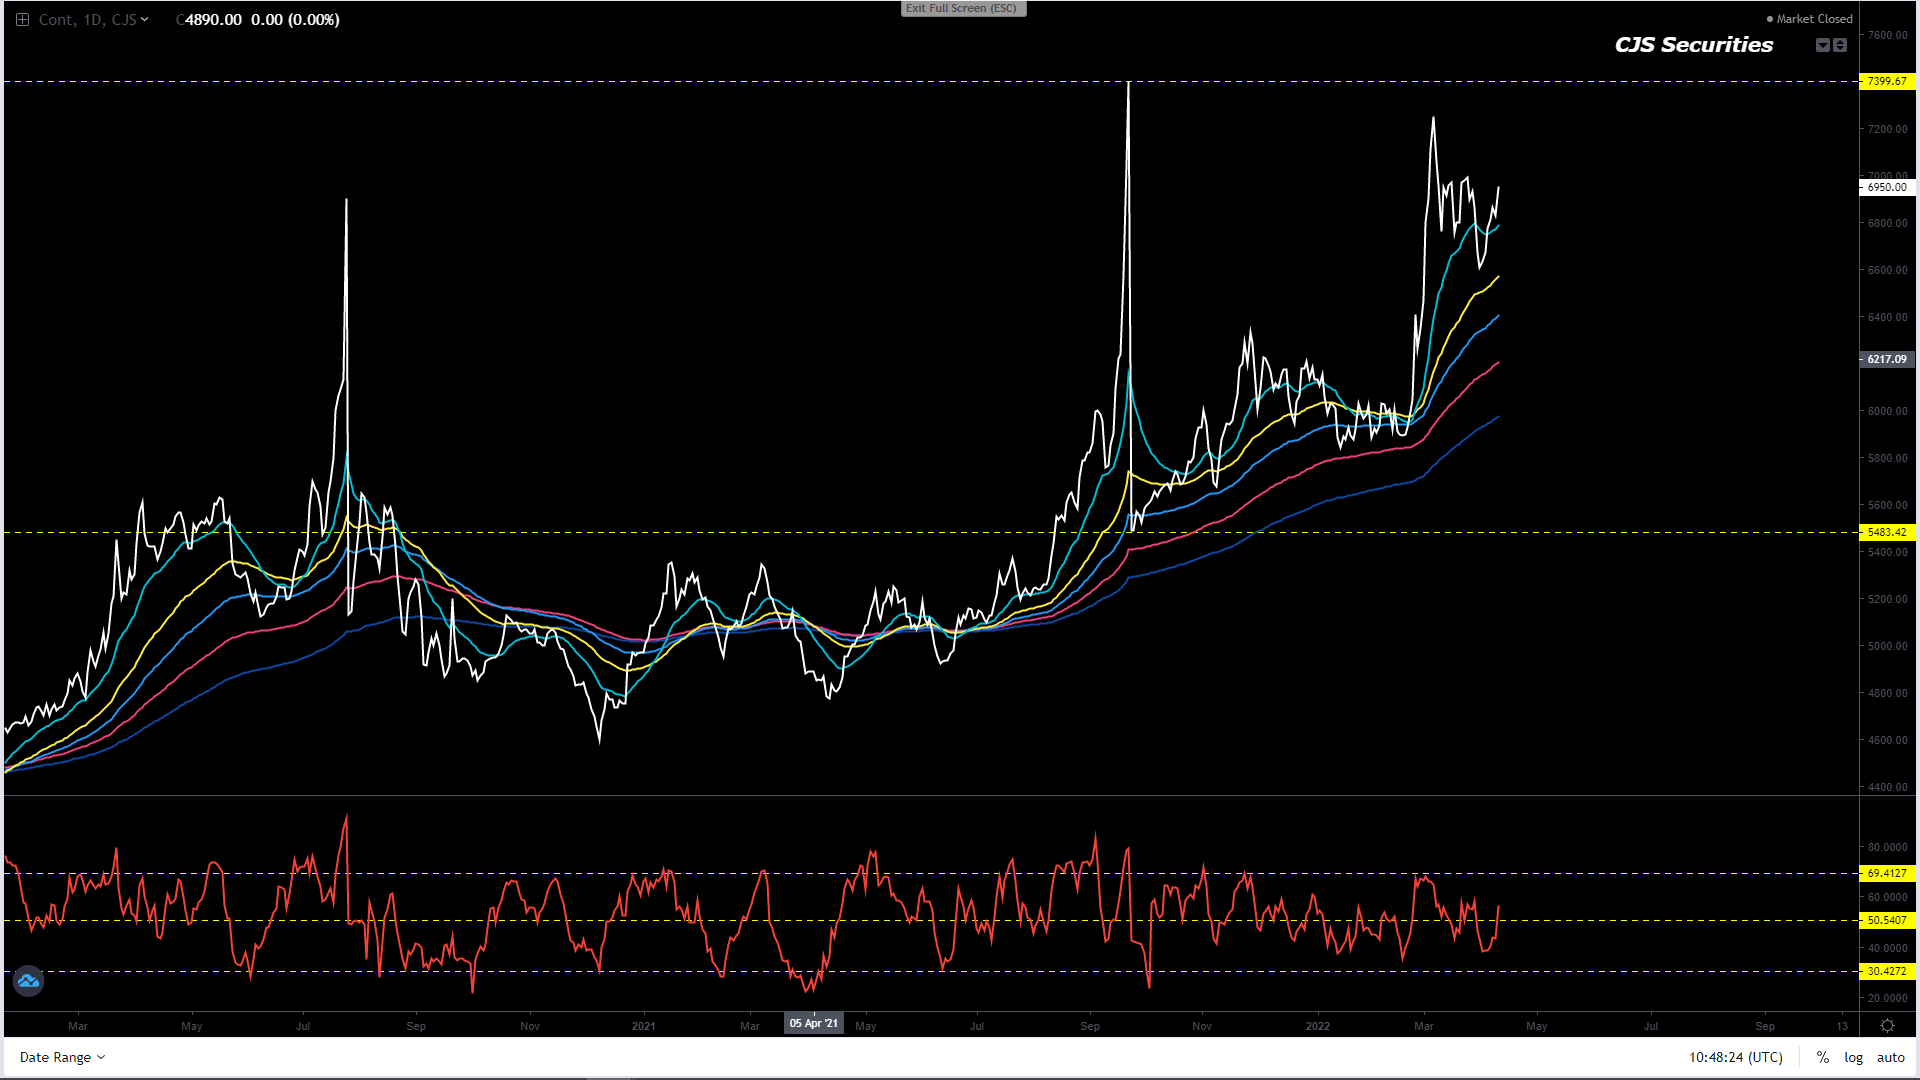
Daily Matif Wheat Continuous Close
This chart’s correction could be over but less so than US wheat and hence we will stay out for now.