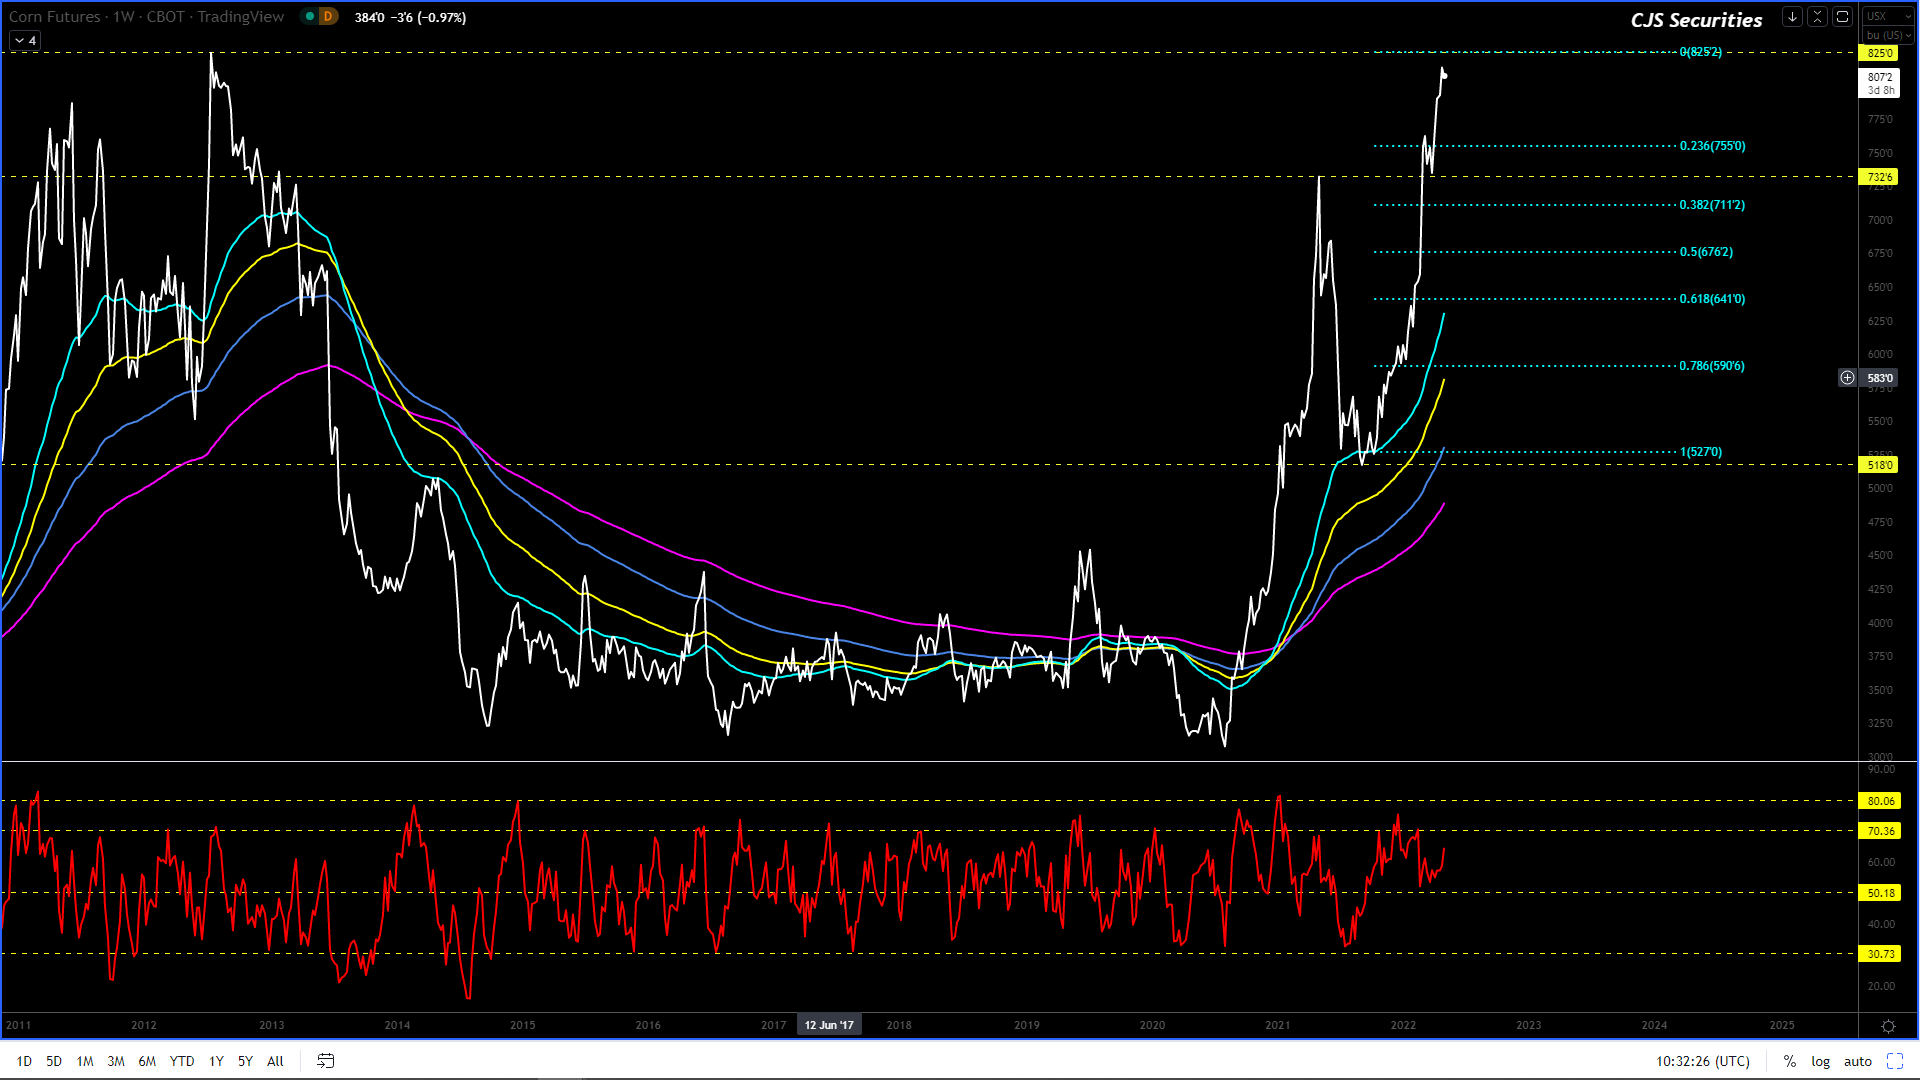
I have very little to add this week, but I would however use a $0.20 -$0.35 pullback as a buying opportunity.
I still favour more upside on a weekly close, even though this chart looks like it needs a decent correction, but as with all things Black Swan, who really knows?
I have zero conviction to pick a top.
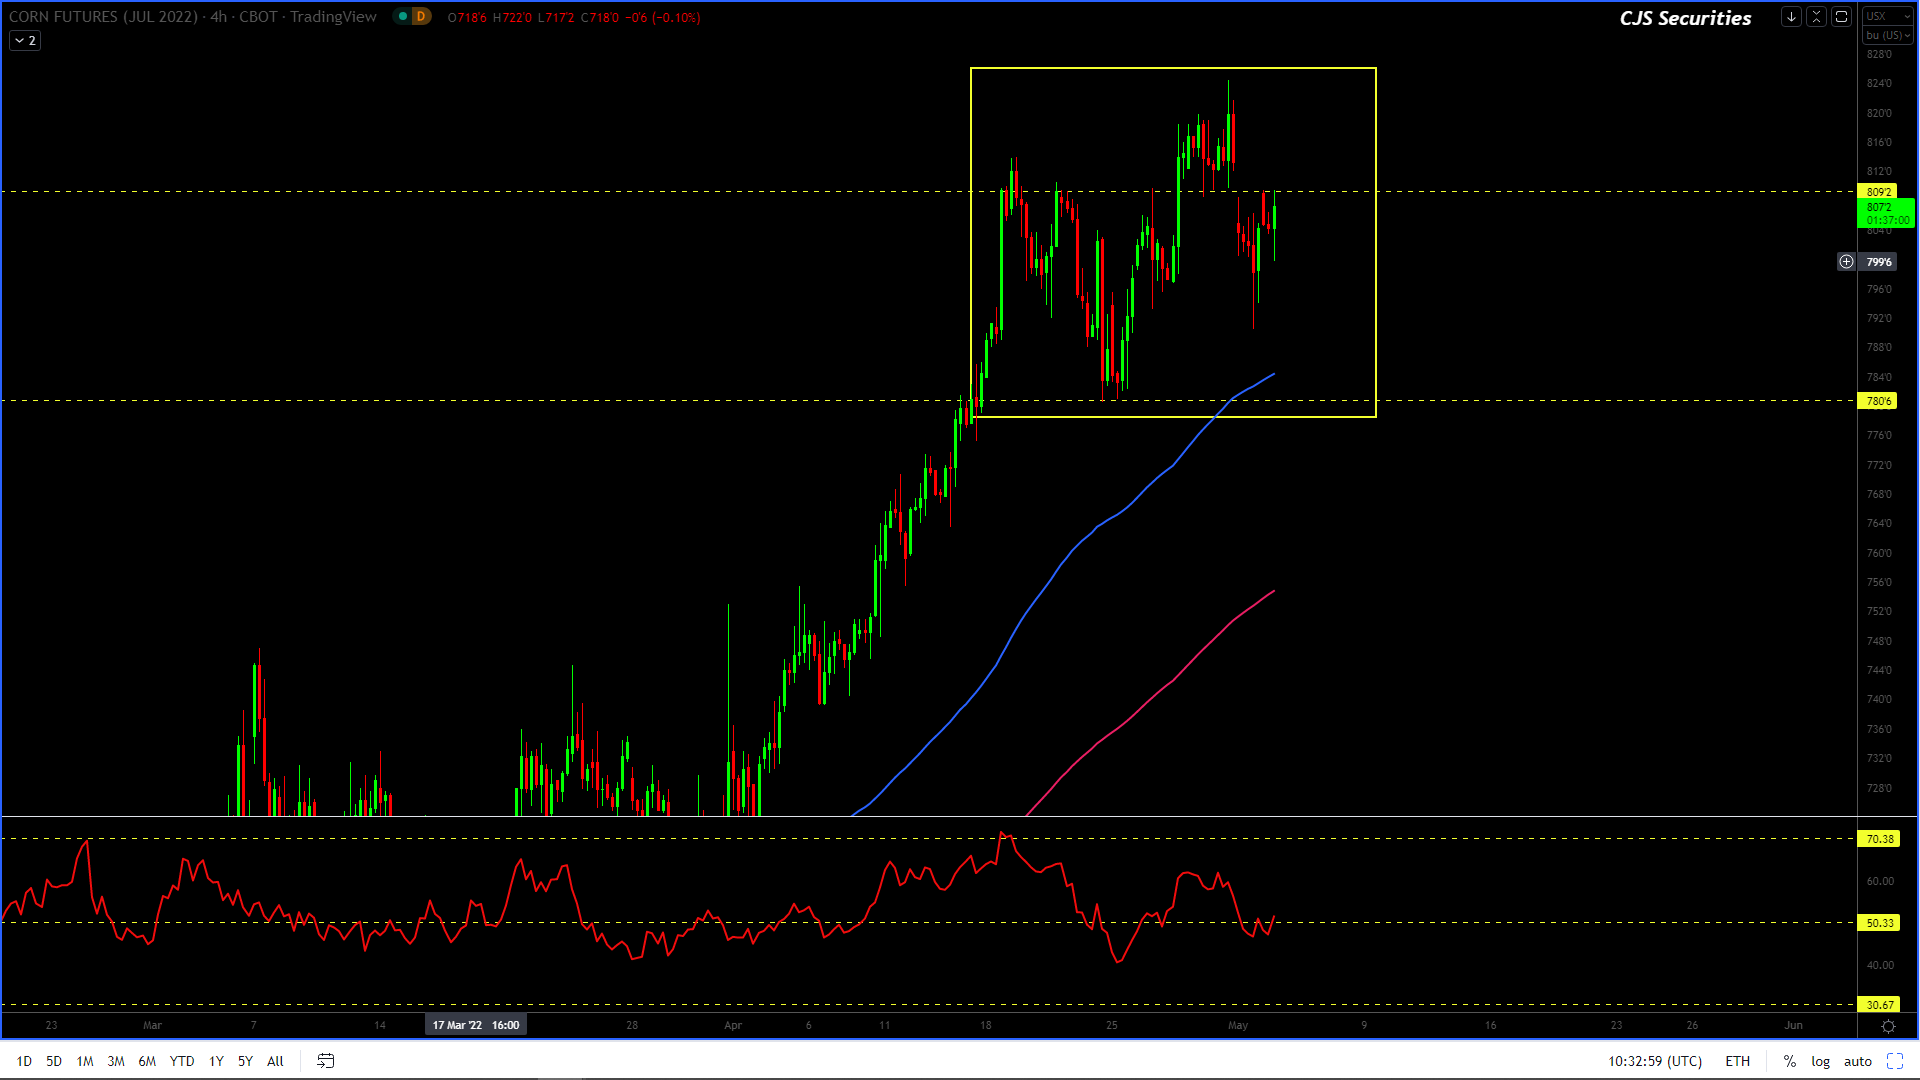
240 Min July 22 Corn Candle Chart Close
The 240 min chart is in the midst of a correction that should be complete once we print $7.80.
I would buy a dip as the upside targets will be over the $9.00 level.
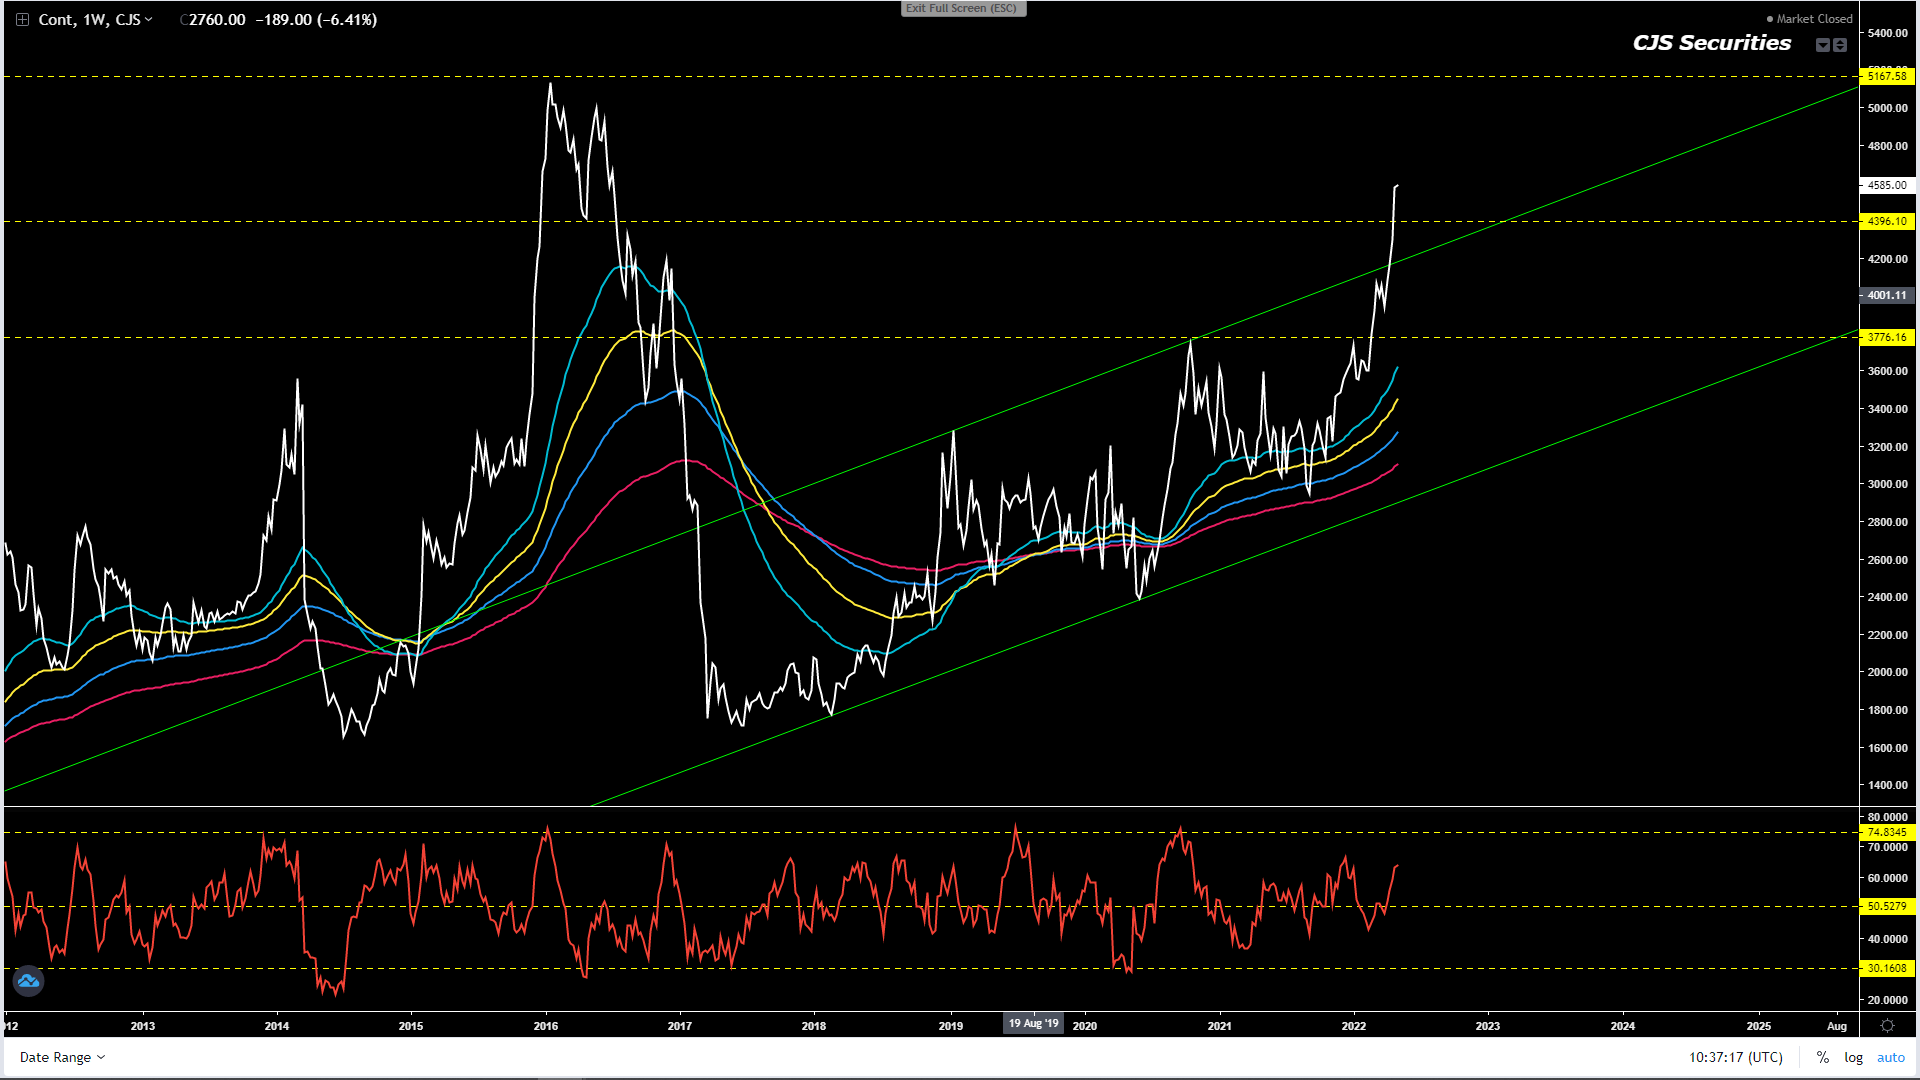
Weekly WM Continuous Close
There remains ZERO technical reason to sell this chart, but its could easily experience a R250 downside correction.
If you are a producer and you are reading this, now is your chance to price. – starting to sound like a broken watch
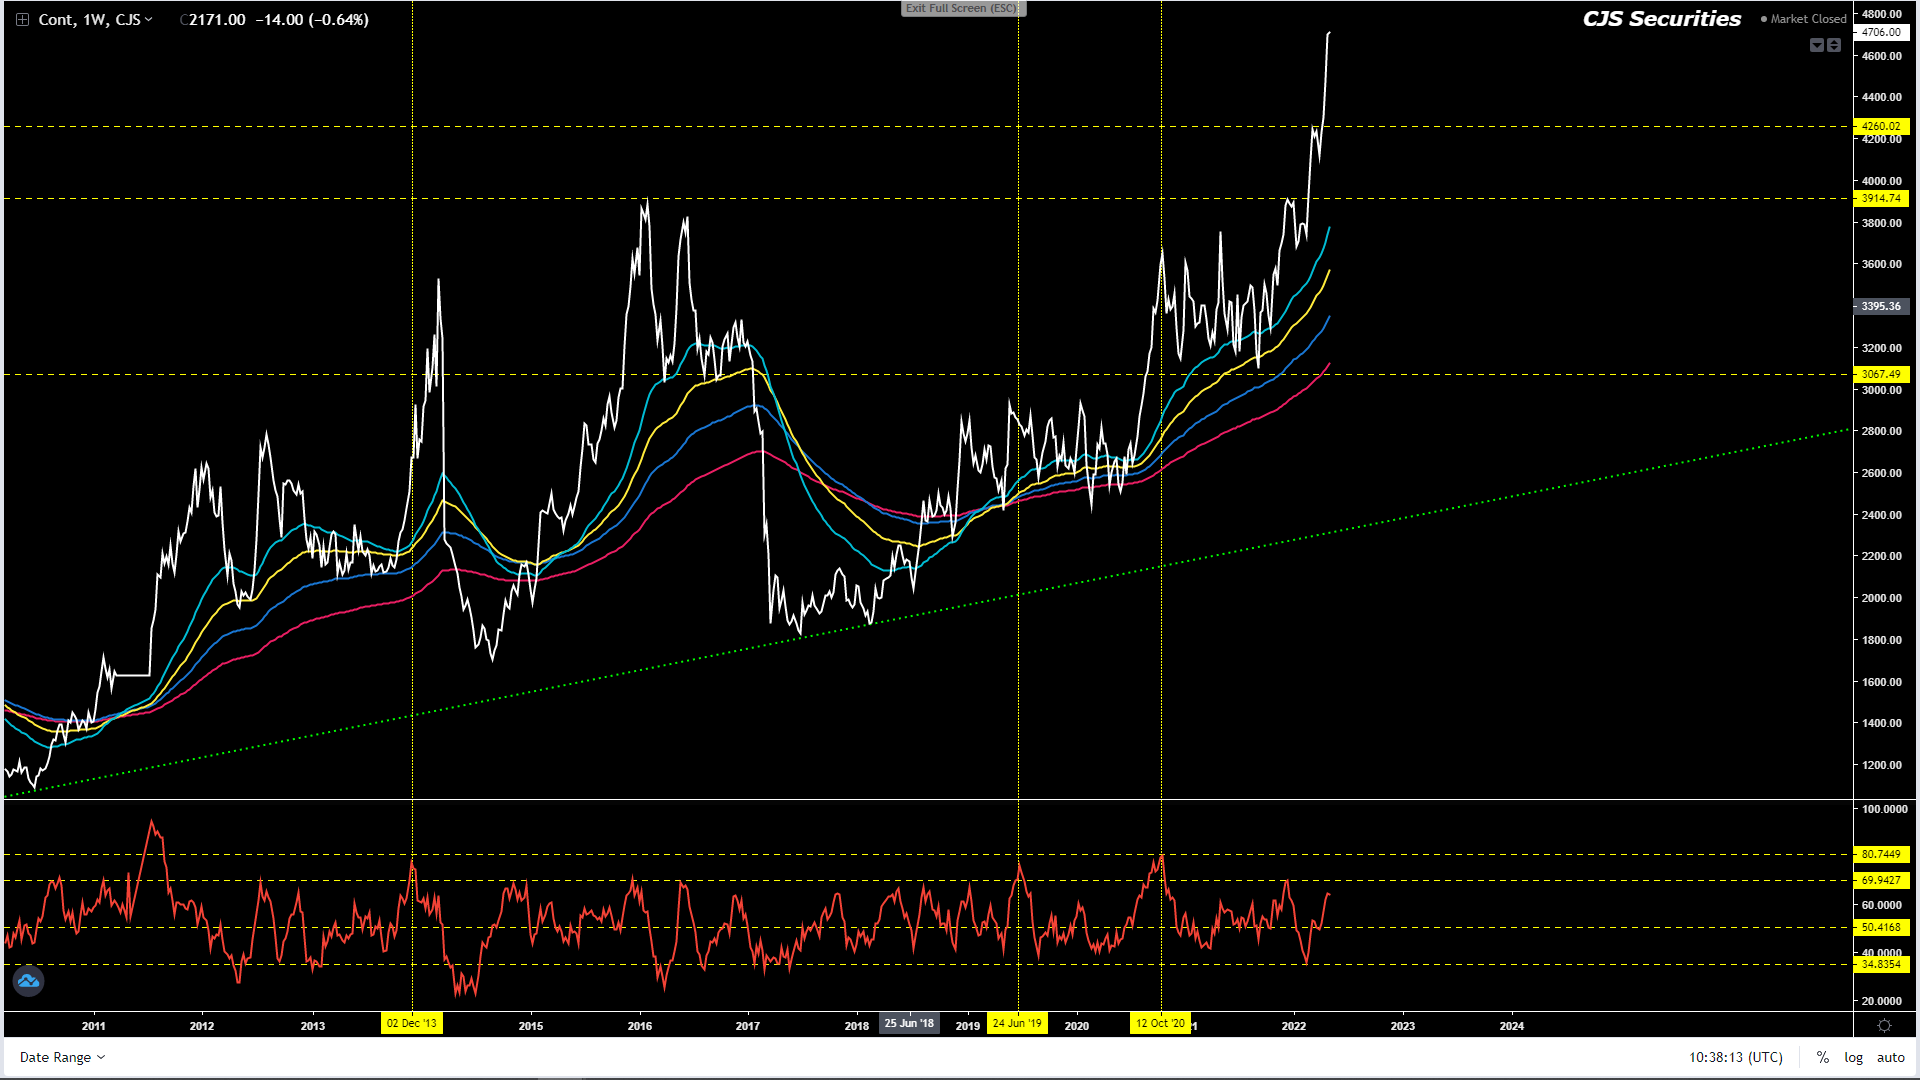
Weekly YM Continuous Close
The techs looks really good and I cannot find a reason to be short this chart even tough it could pullback R250 from here quite easily.
We could easily see the price rally from here.
If you are a producer and you are reading this, now is your chance to price. – starting to sound like a broken watch
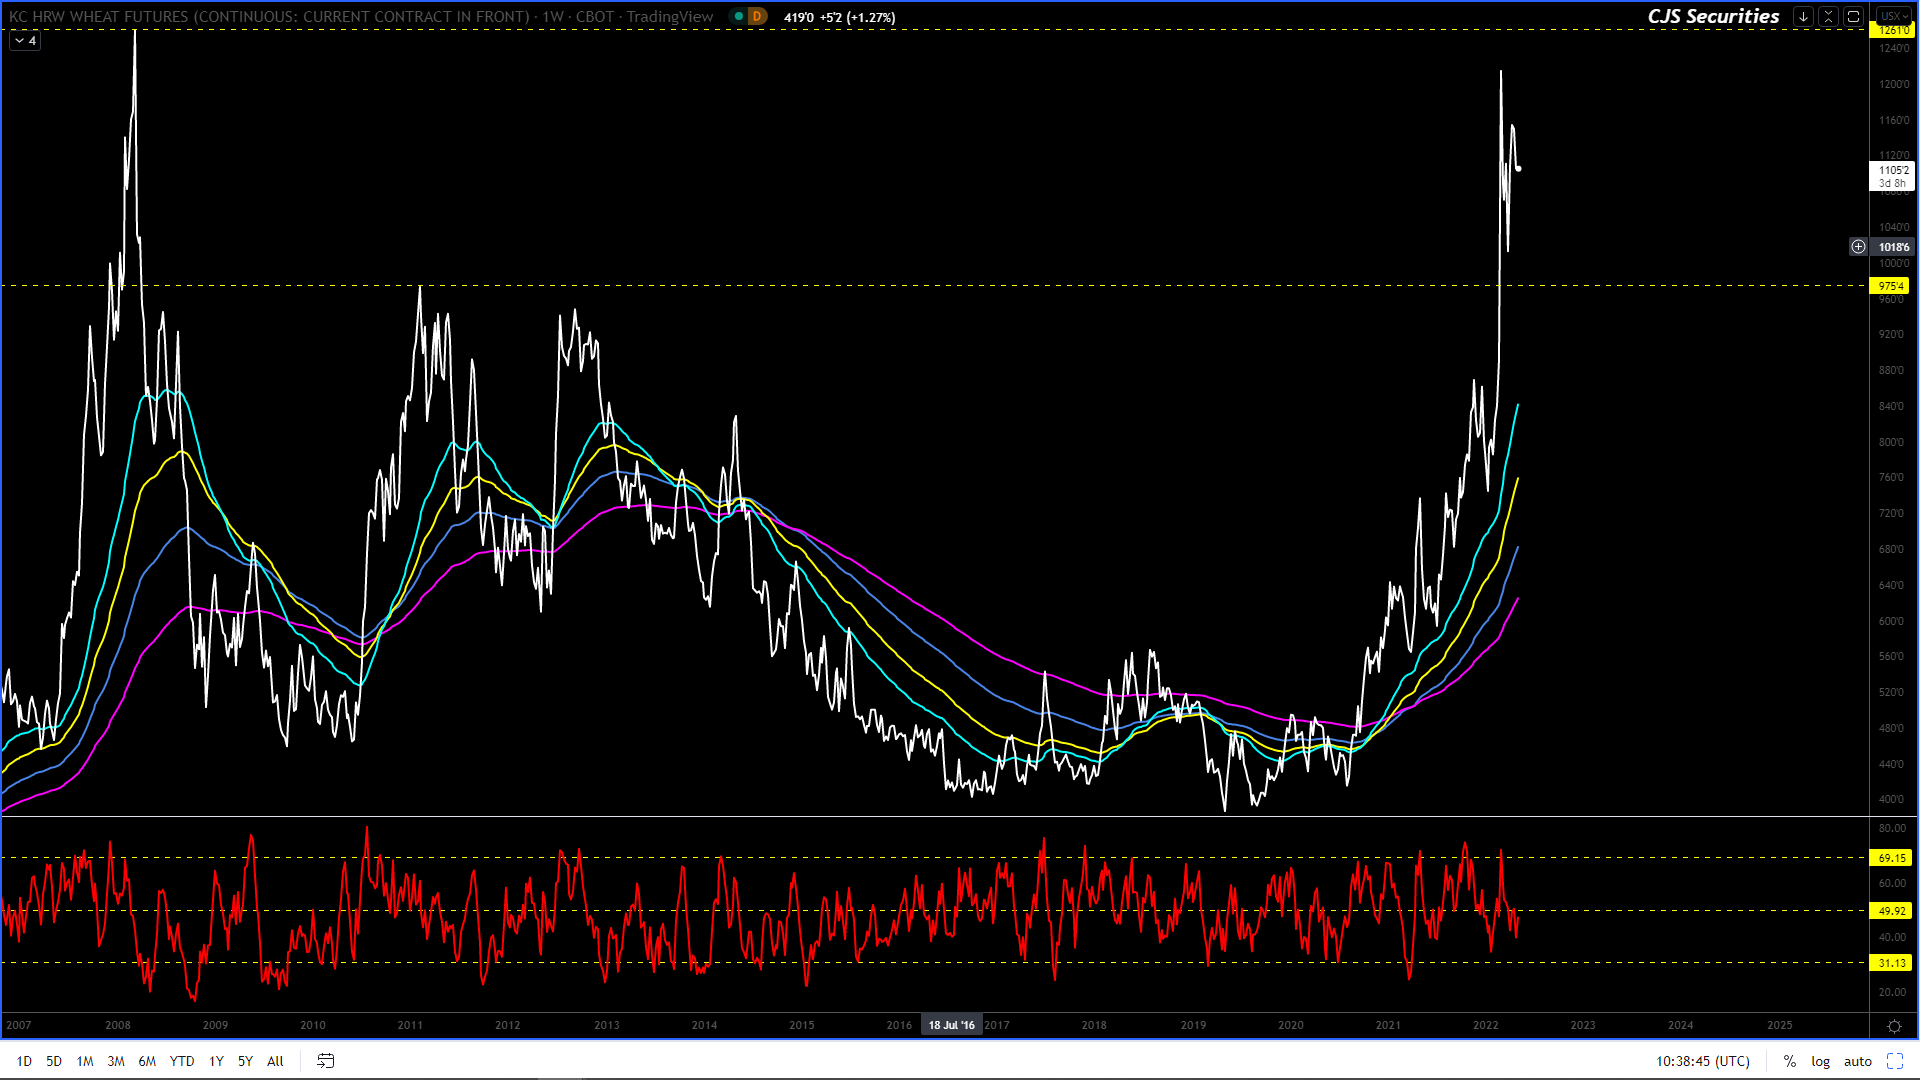
Weekly KC Wheat Continuous Close
I am bullish this chart and want to own it right here, right now and up to $0.80 lower!
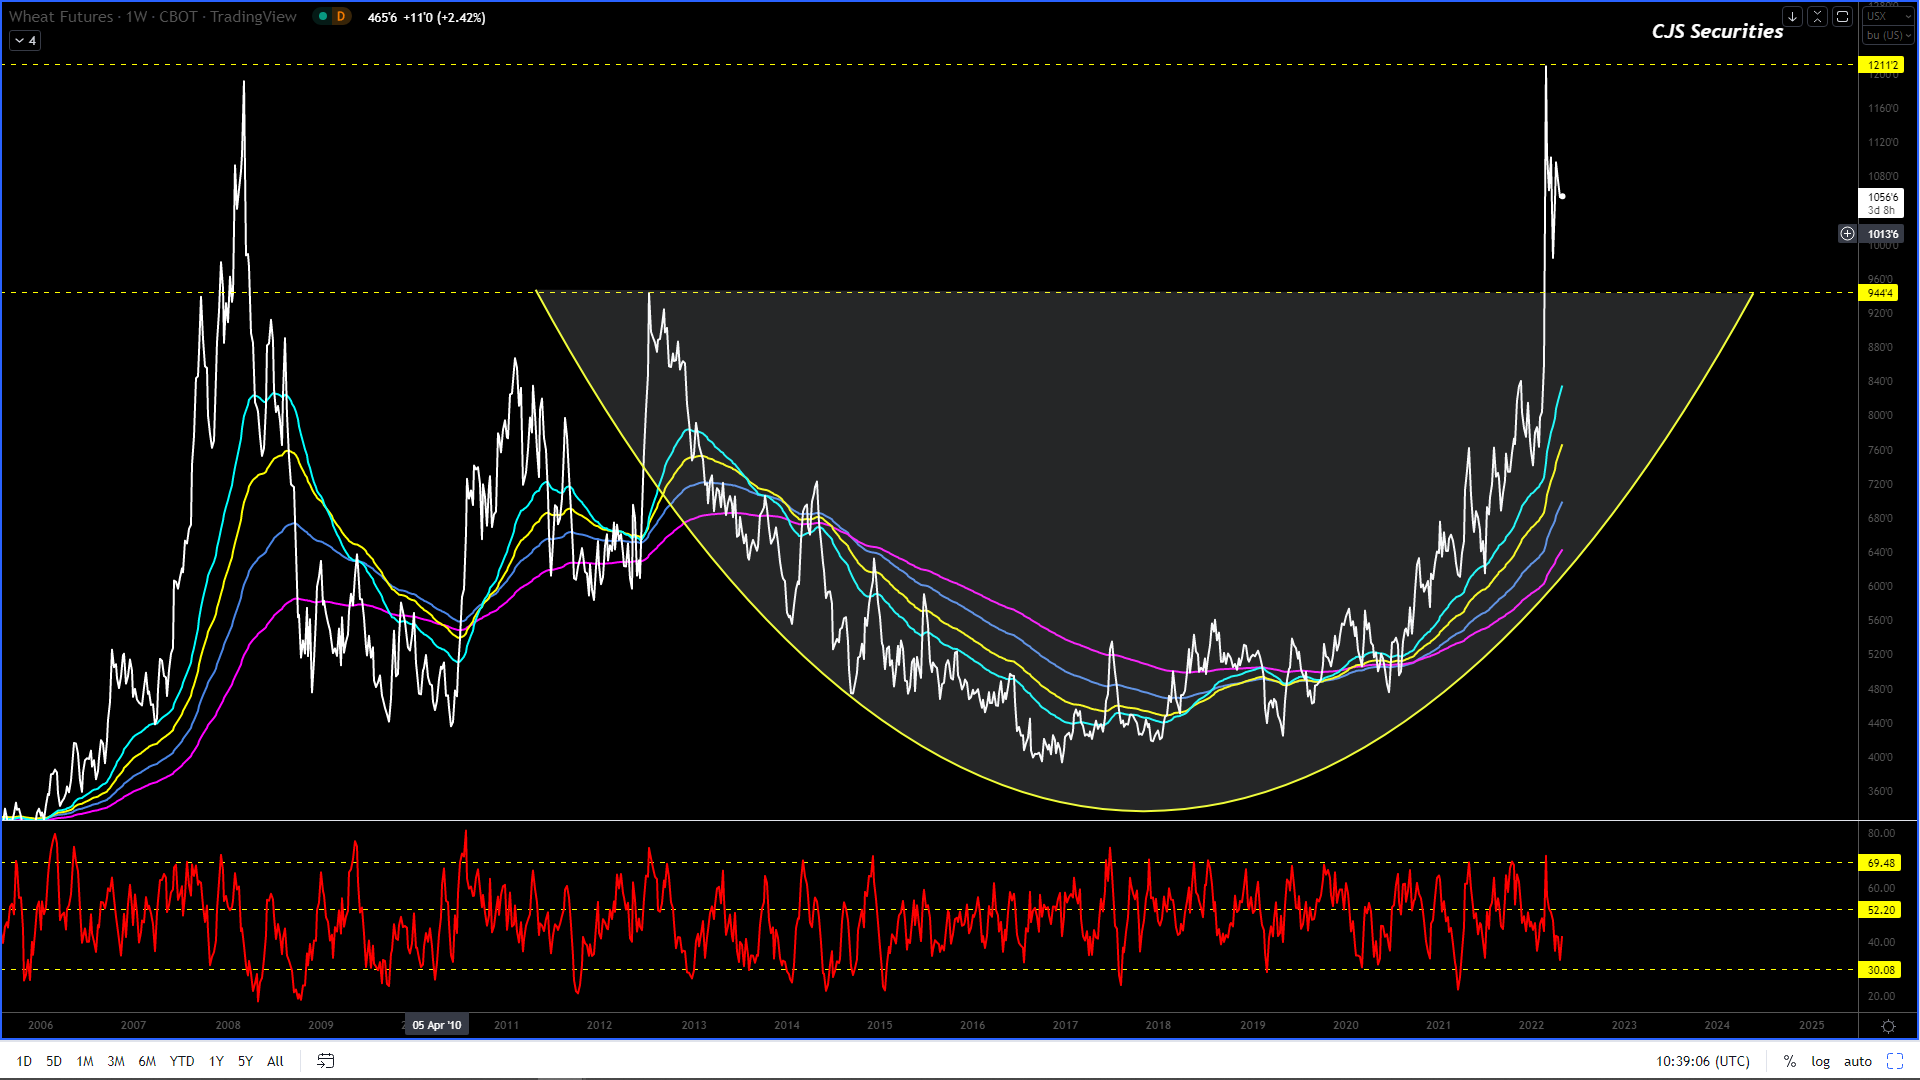
Weekly Chicago SRW Wheat Continuous
I am bullish this chart and want to own it right here, right now and up to $1.00 lower!
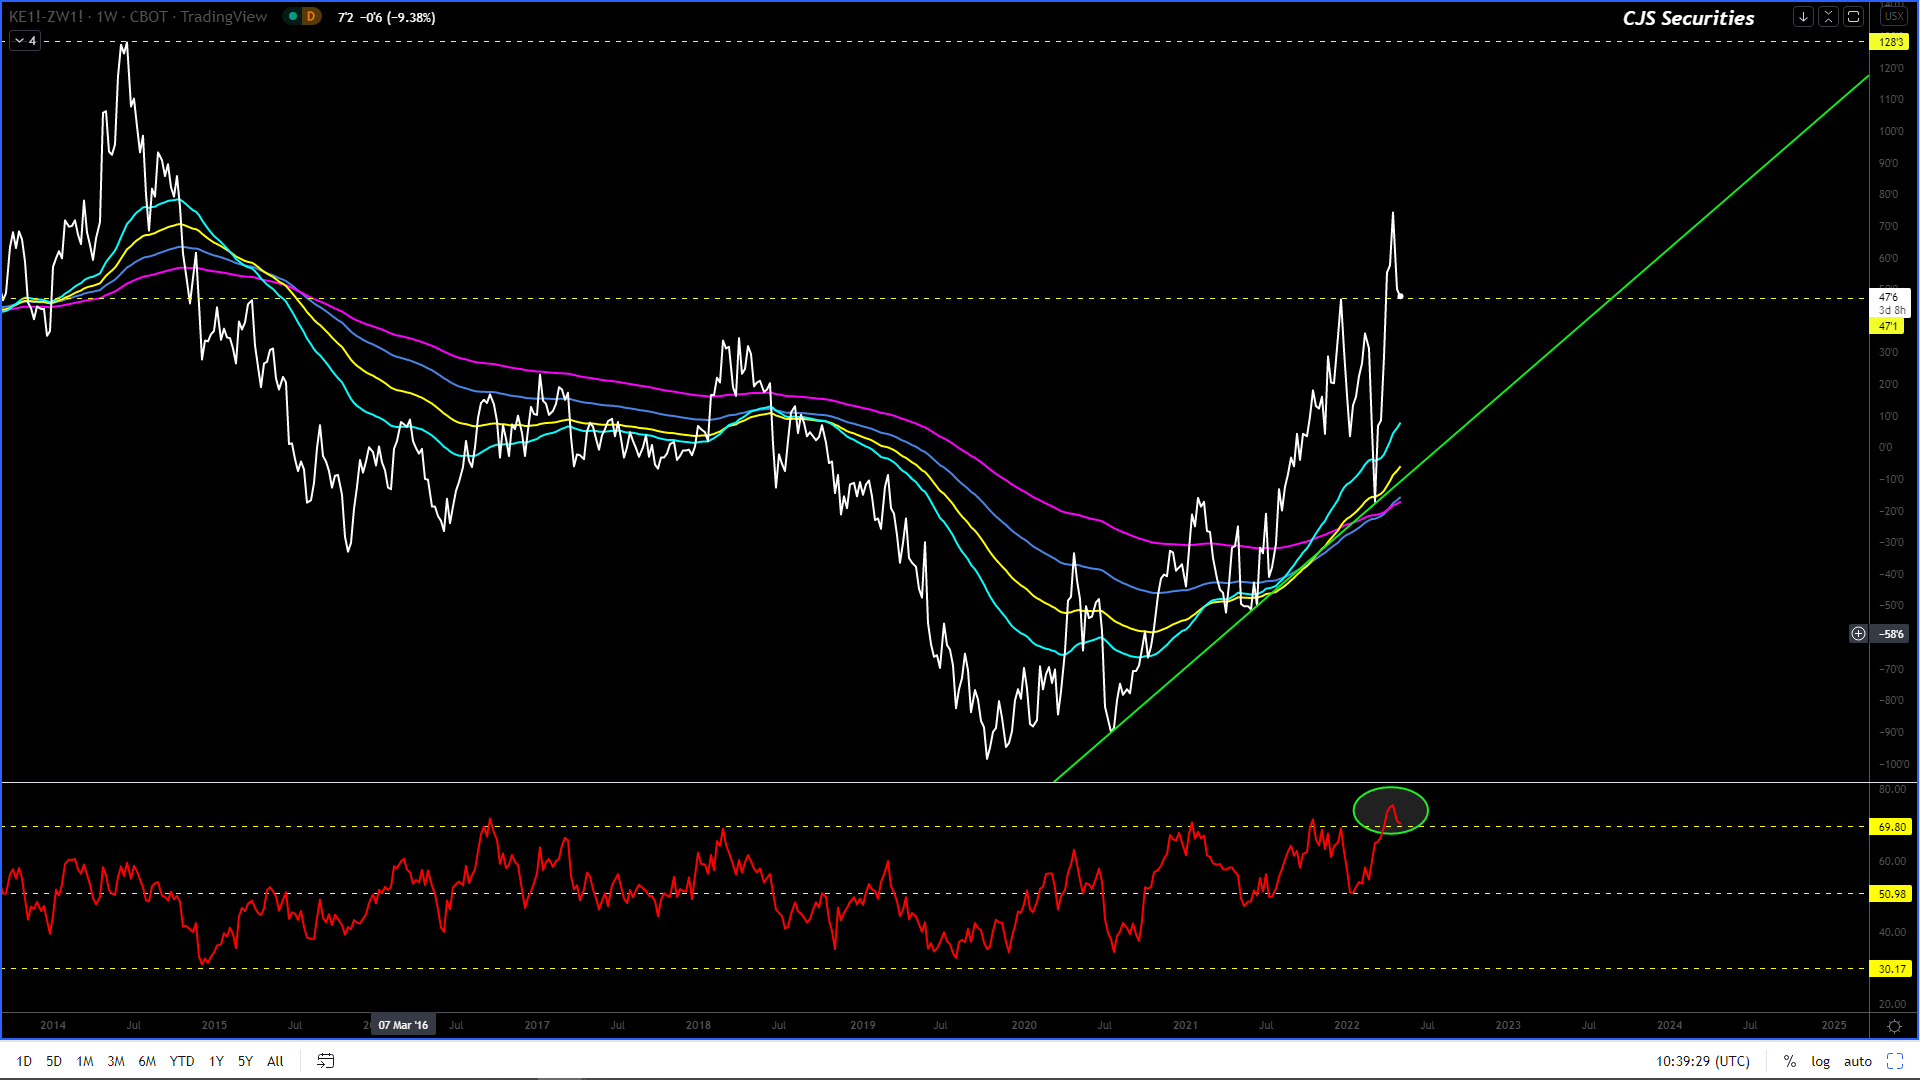
Weekly Close KC Wheat v Chicago SRW Continuous Close
I want to get long this chart, but will need to wait for a greater pullback than what we are currently experiencing.
The chart REMAINS highly overbought on a weekly basis.
Weekly SAF Wheat Continuous Close
This chart has had a great rally and although we missed our buy levels, for those that are long, this may not be a bad time to take some risk off the table.
Daily Matif Wheat Continuous Close
This chart’s correction
is over and I am expecting new highs!