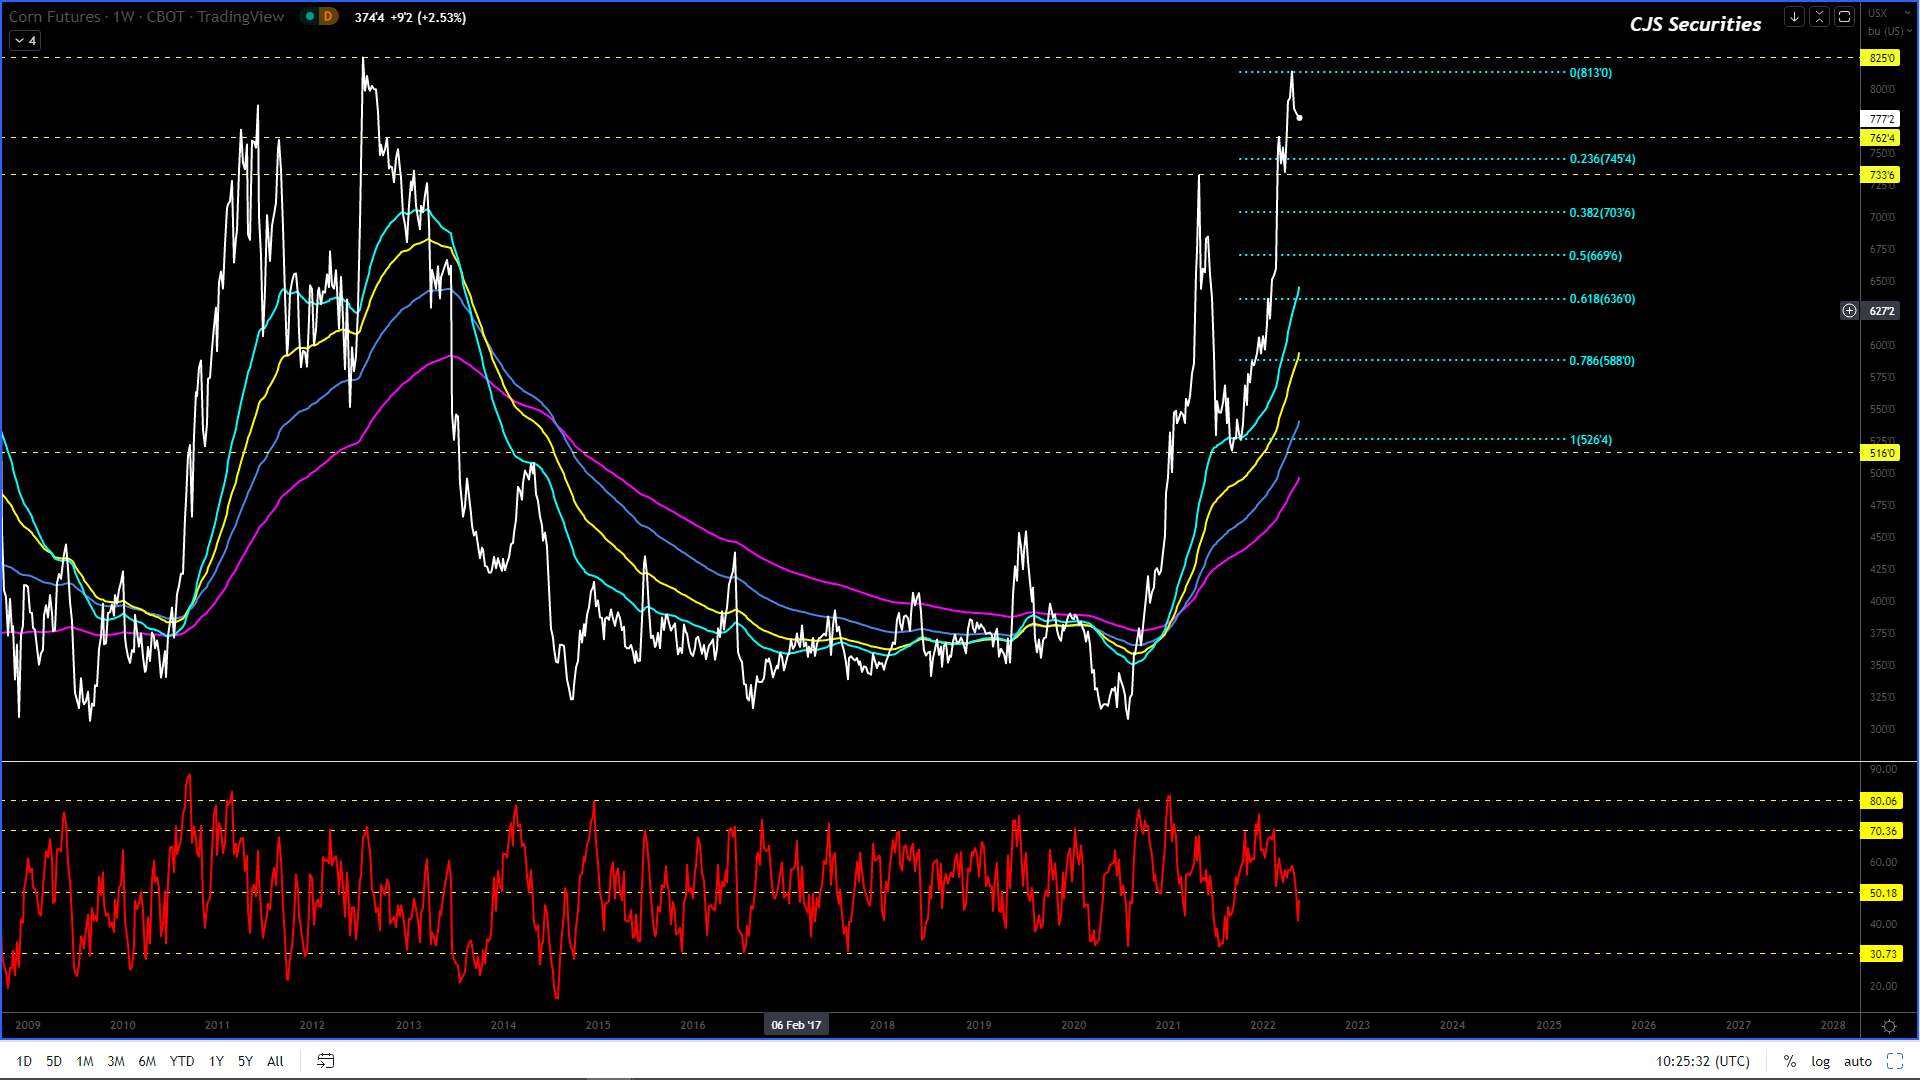
After doing some seriously LT tech research, this is the very first chart I have seen that has an 11.08 extension and its with this in mind that I feel we will have a multi week correction that eventually comes and prints the low $7.00 levels again.
I remain bullish in the greater scheme of things and a pullback of this nature would be seen as a magnificent buying opportunity.
240 Min July 22 Corn Candle Chart Close
The chart has made a low in the $7.50’s and kicked well off those levels.
I am now very unsure if this chart will kick from here or look at testing the ST low again, but either way I still favour buying a dip.
I would only look to hold onto positions for $0.30 and no more as volatility is here to stay in a very big way.
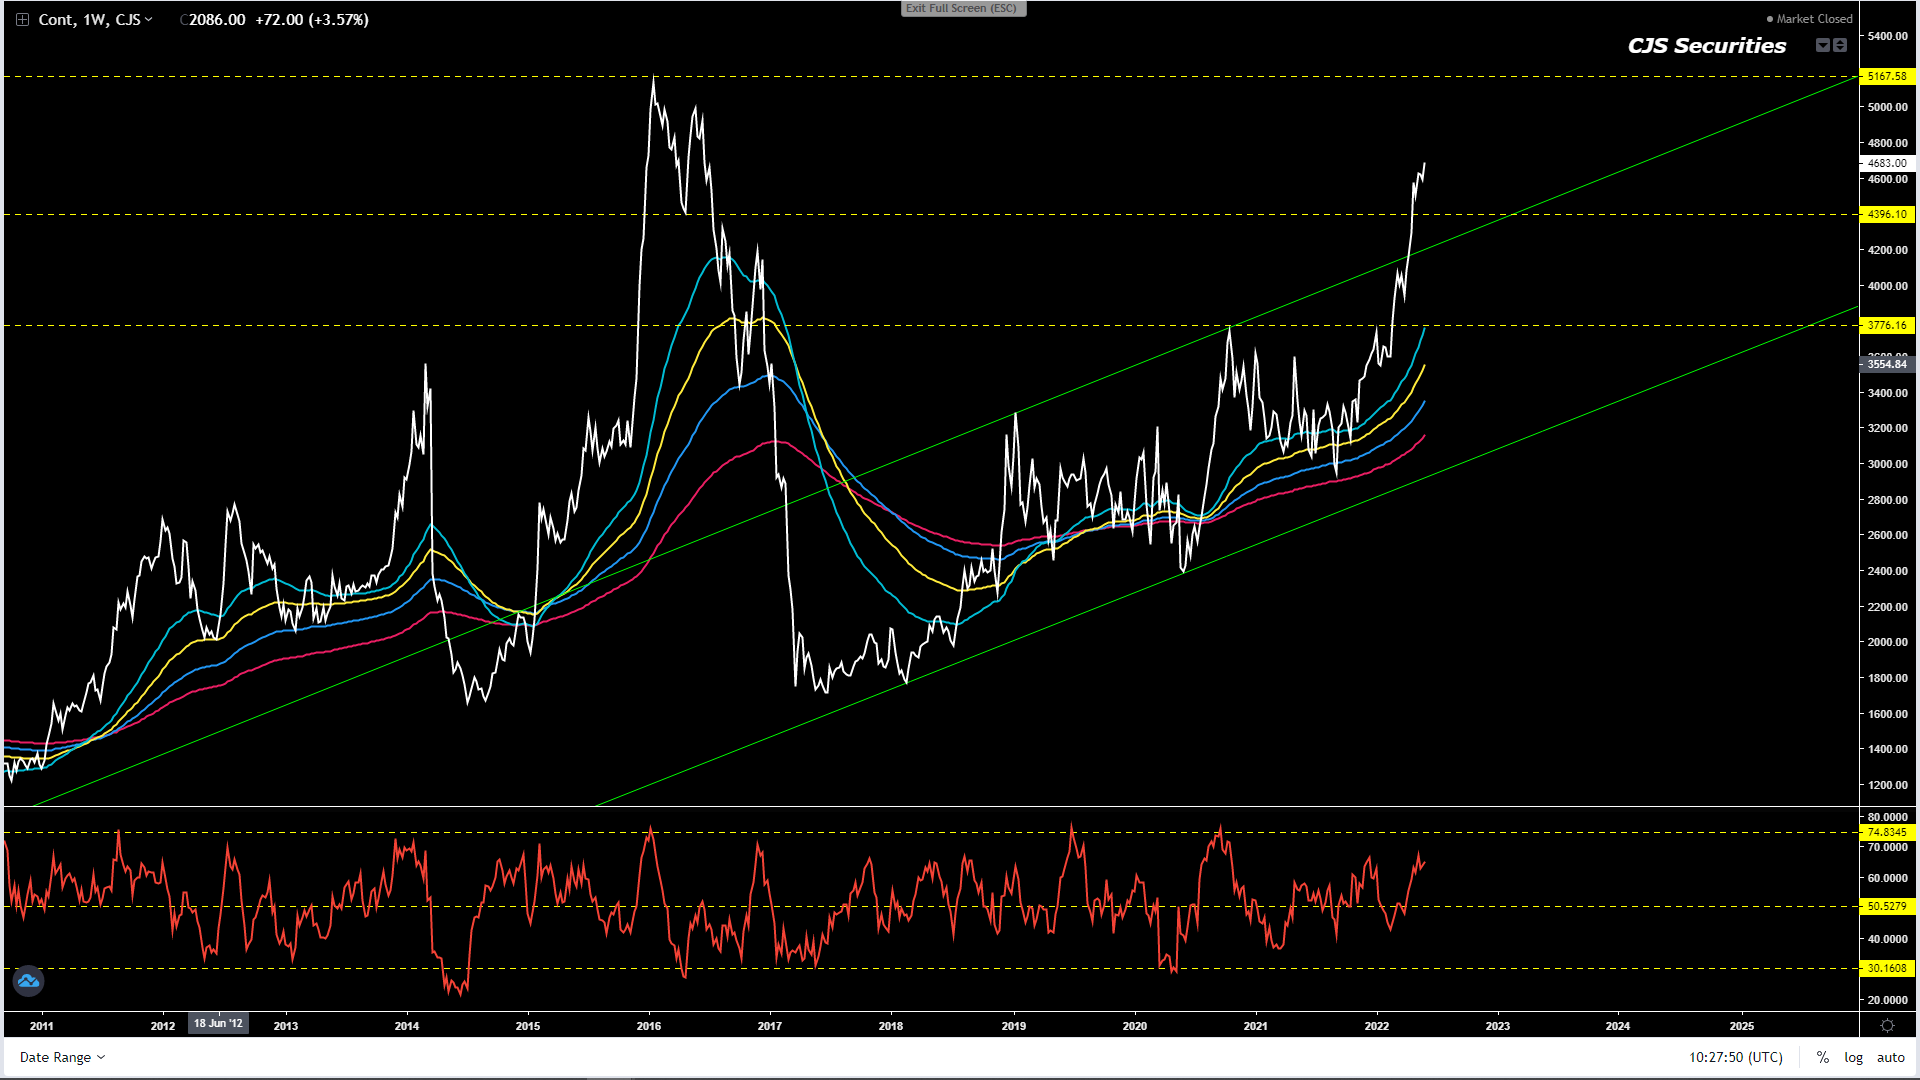
Weekly WM Continuous Close
#No Change in Commentary
There remains ZERO technical reason to sell this chart, but its could easily experience a R250 downside correction.
If you are a producer and you are reading this, now is your chance to price. – starting to sound like a broken watch
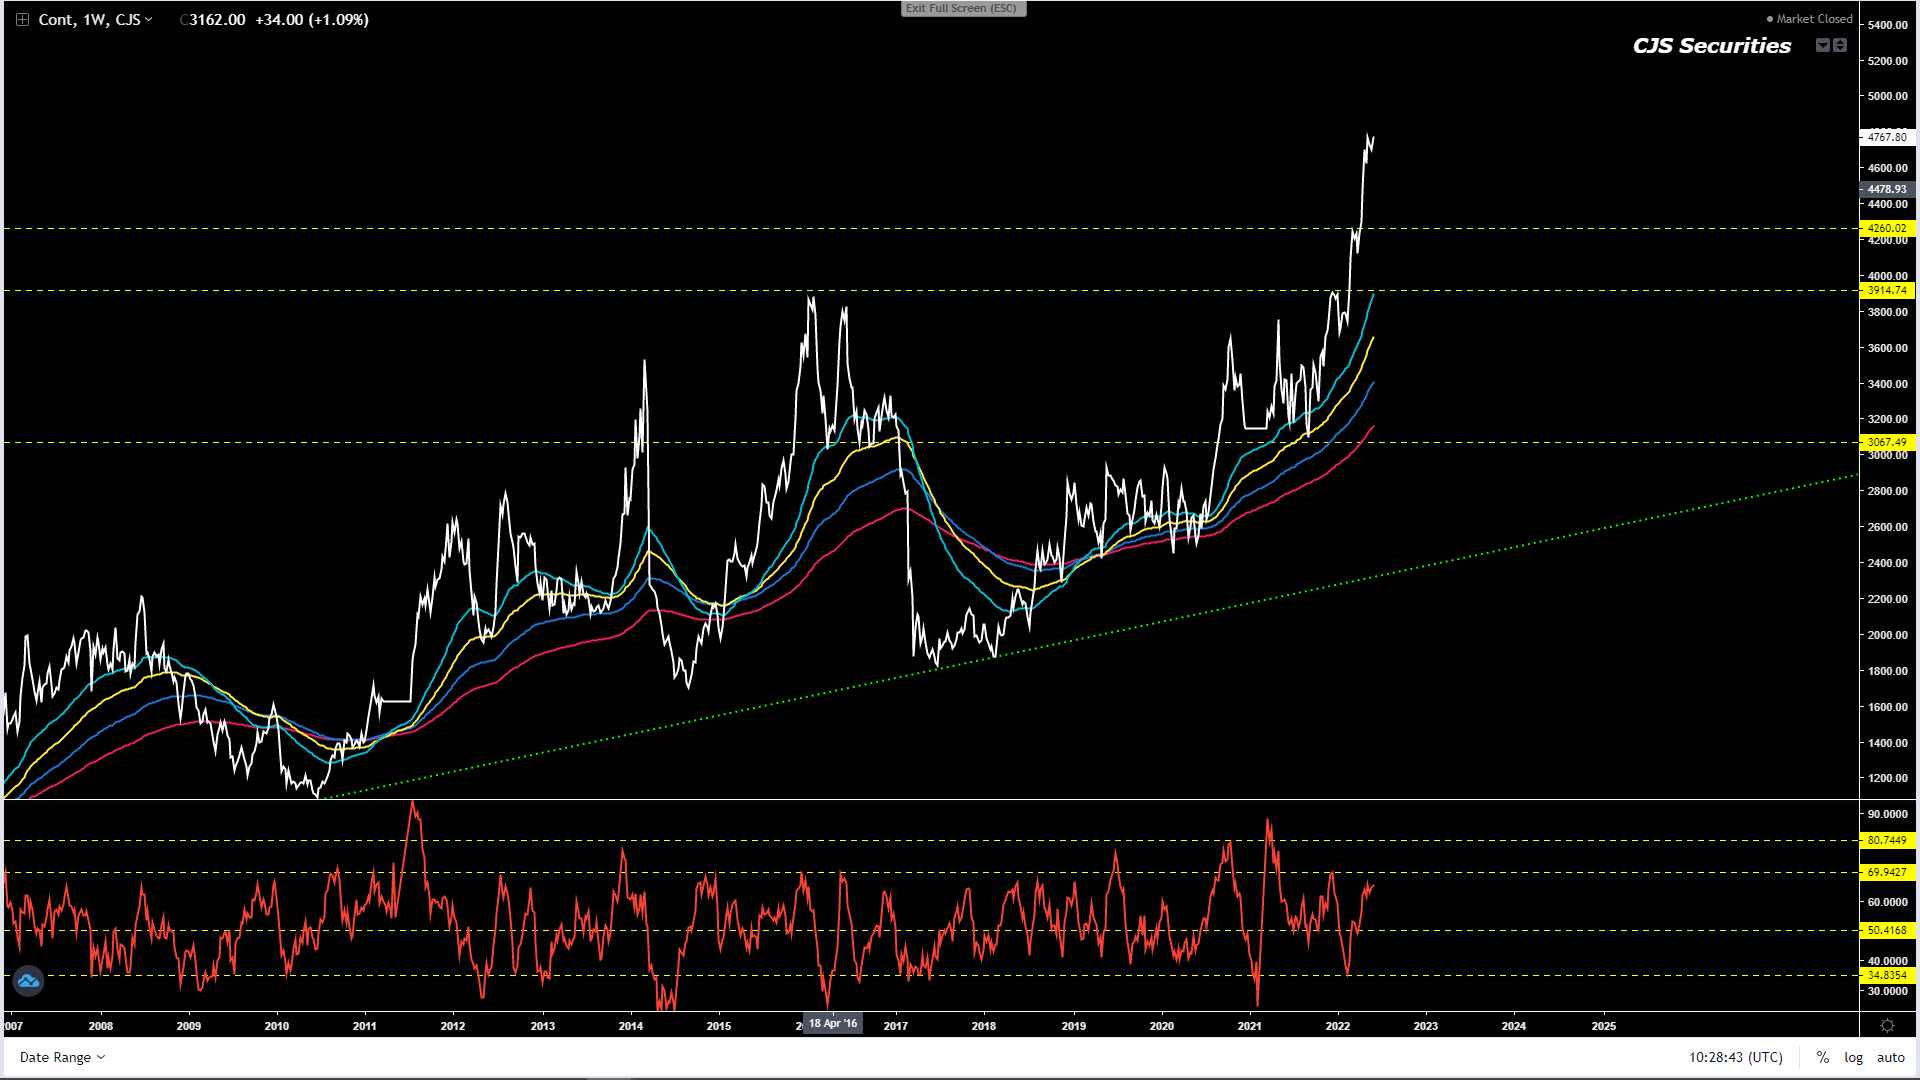
Weekly YM Continuous Close
#No Change in Commentary
The techs looks really good and I cannot find a reason to be short this chart even tough it could pullback R250 from here quite easily.
We could easily see the price rally from here.
If you are a producer and you are reading this, now is your chance to price. – starting to sound like a broken watch
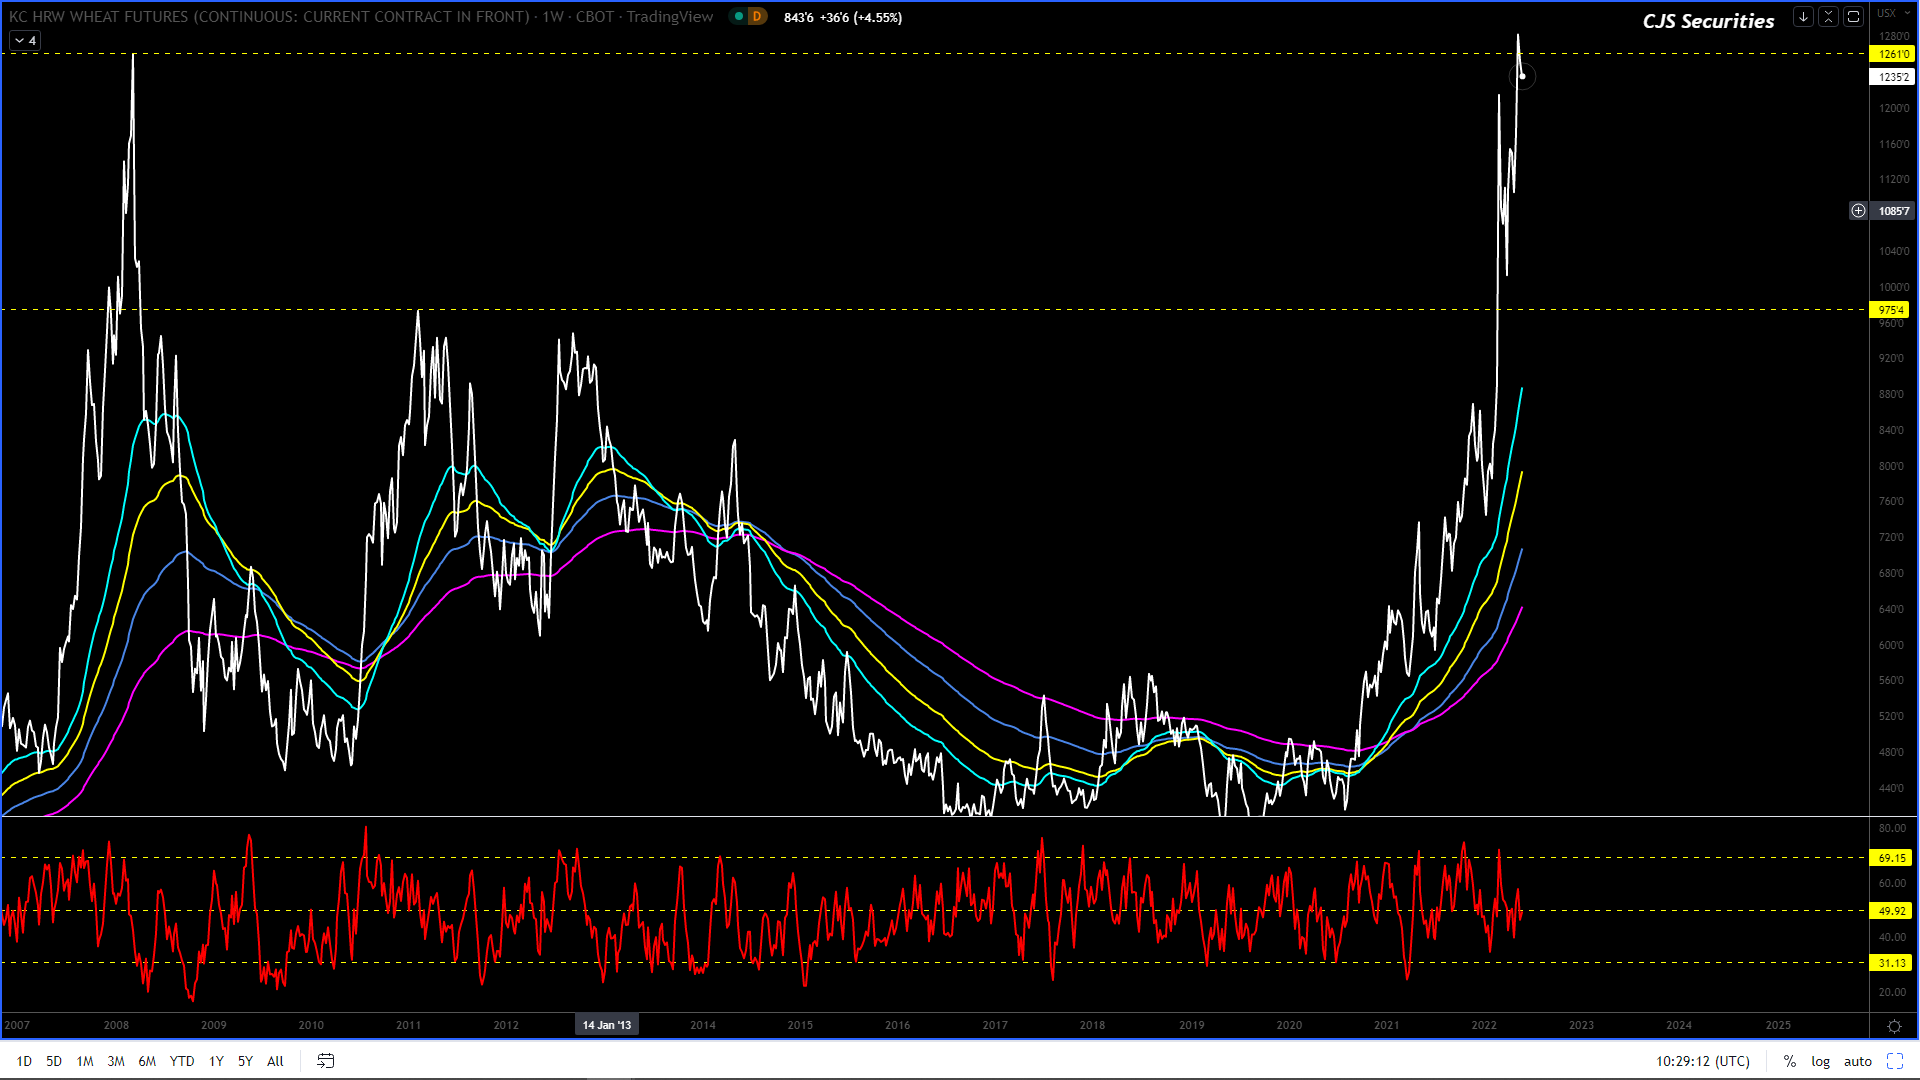
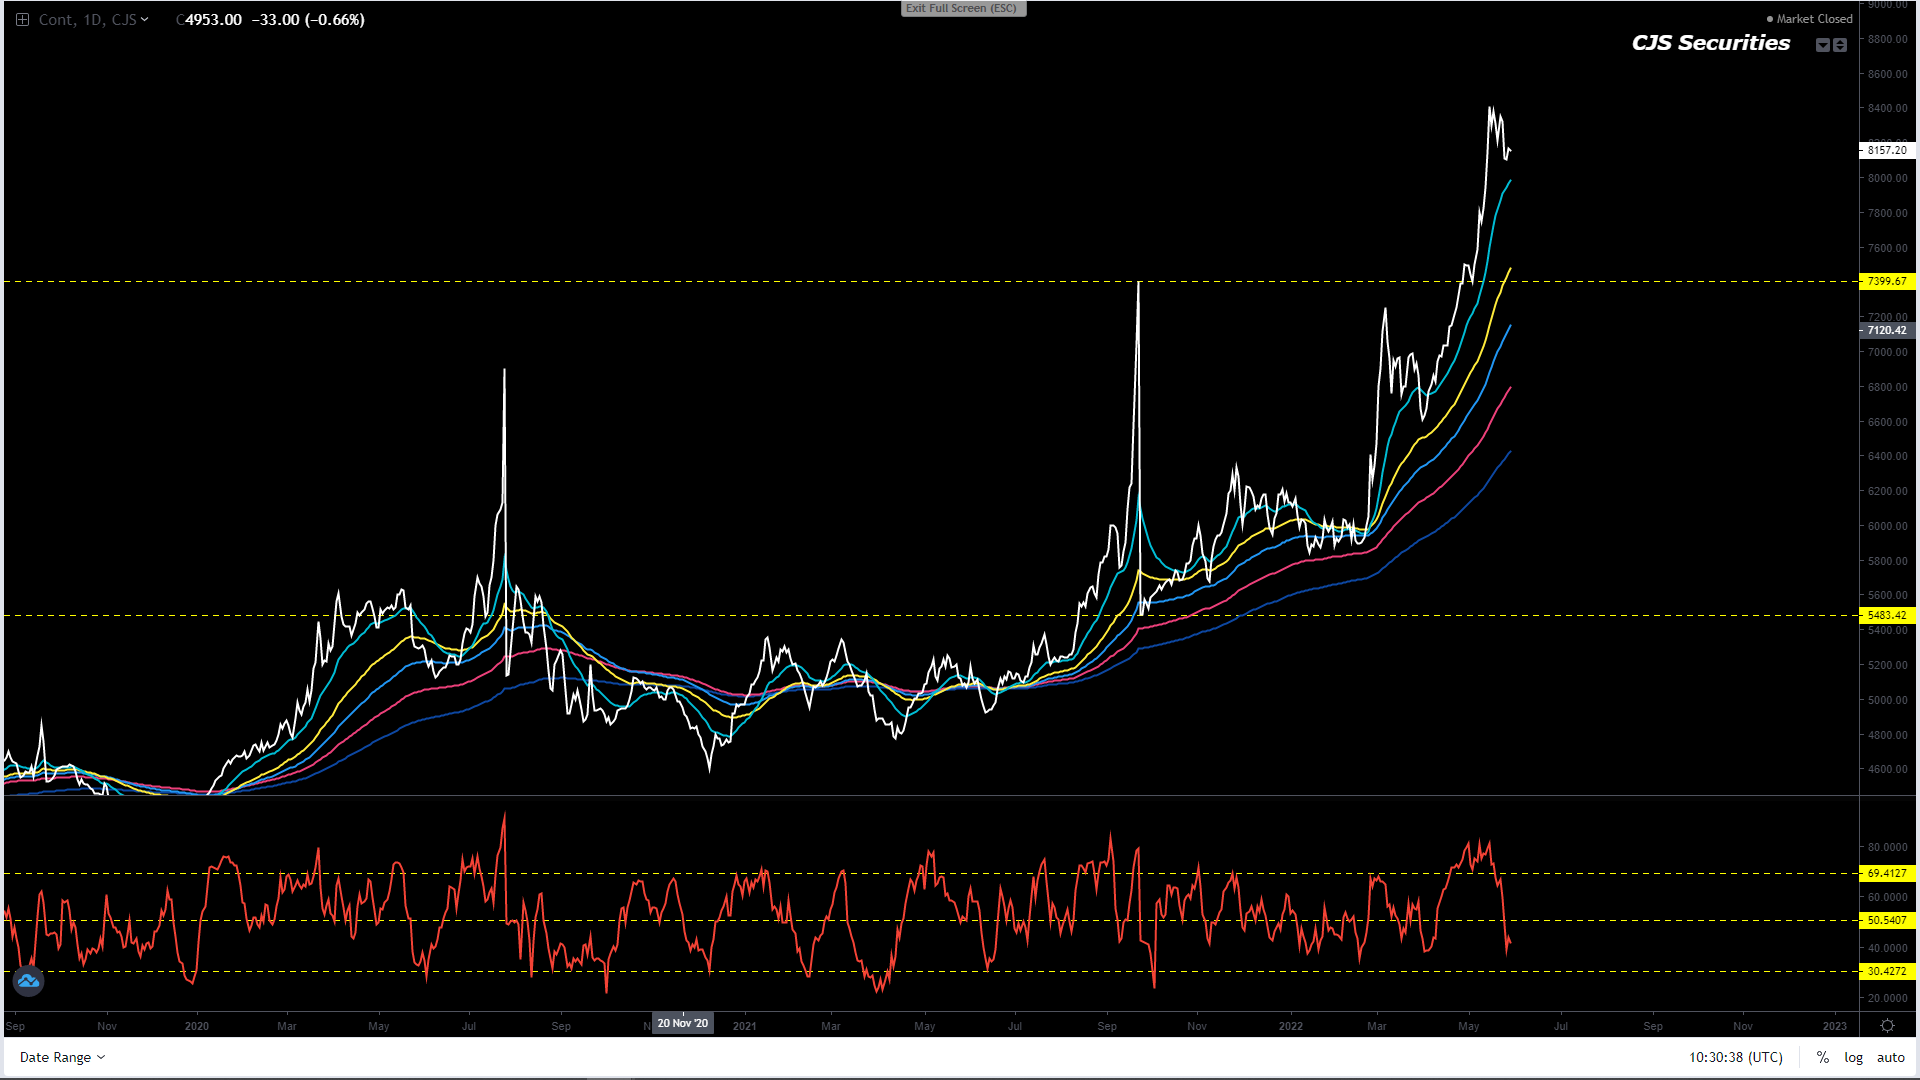
Weekly KC Wheat Continuous Close
I would advise sitting out until further notice as the risk of a deep pullback is very high.
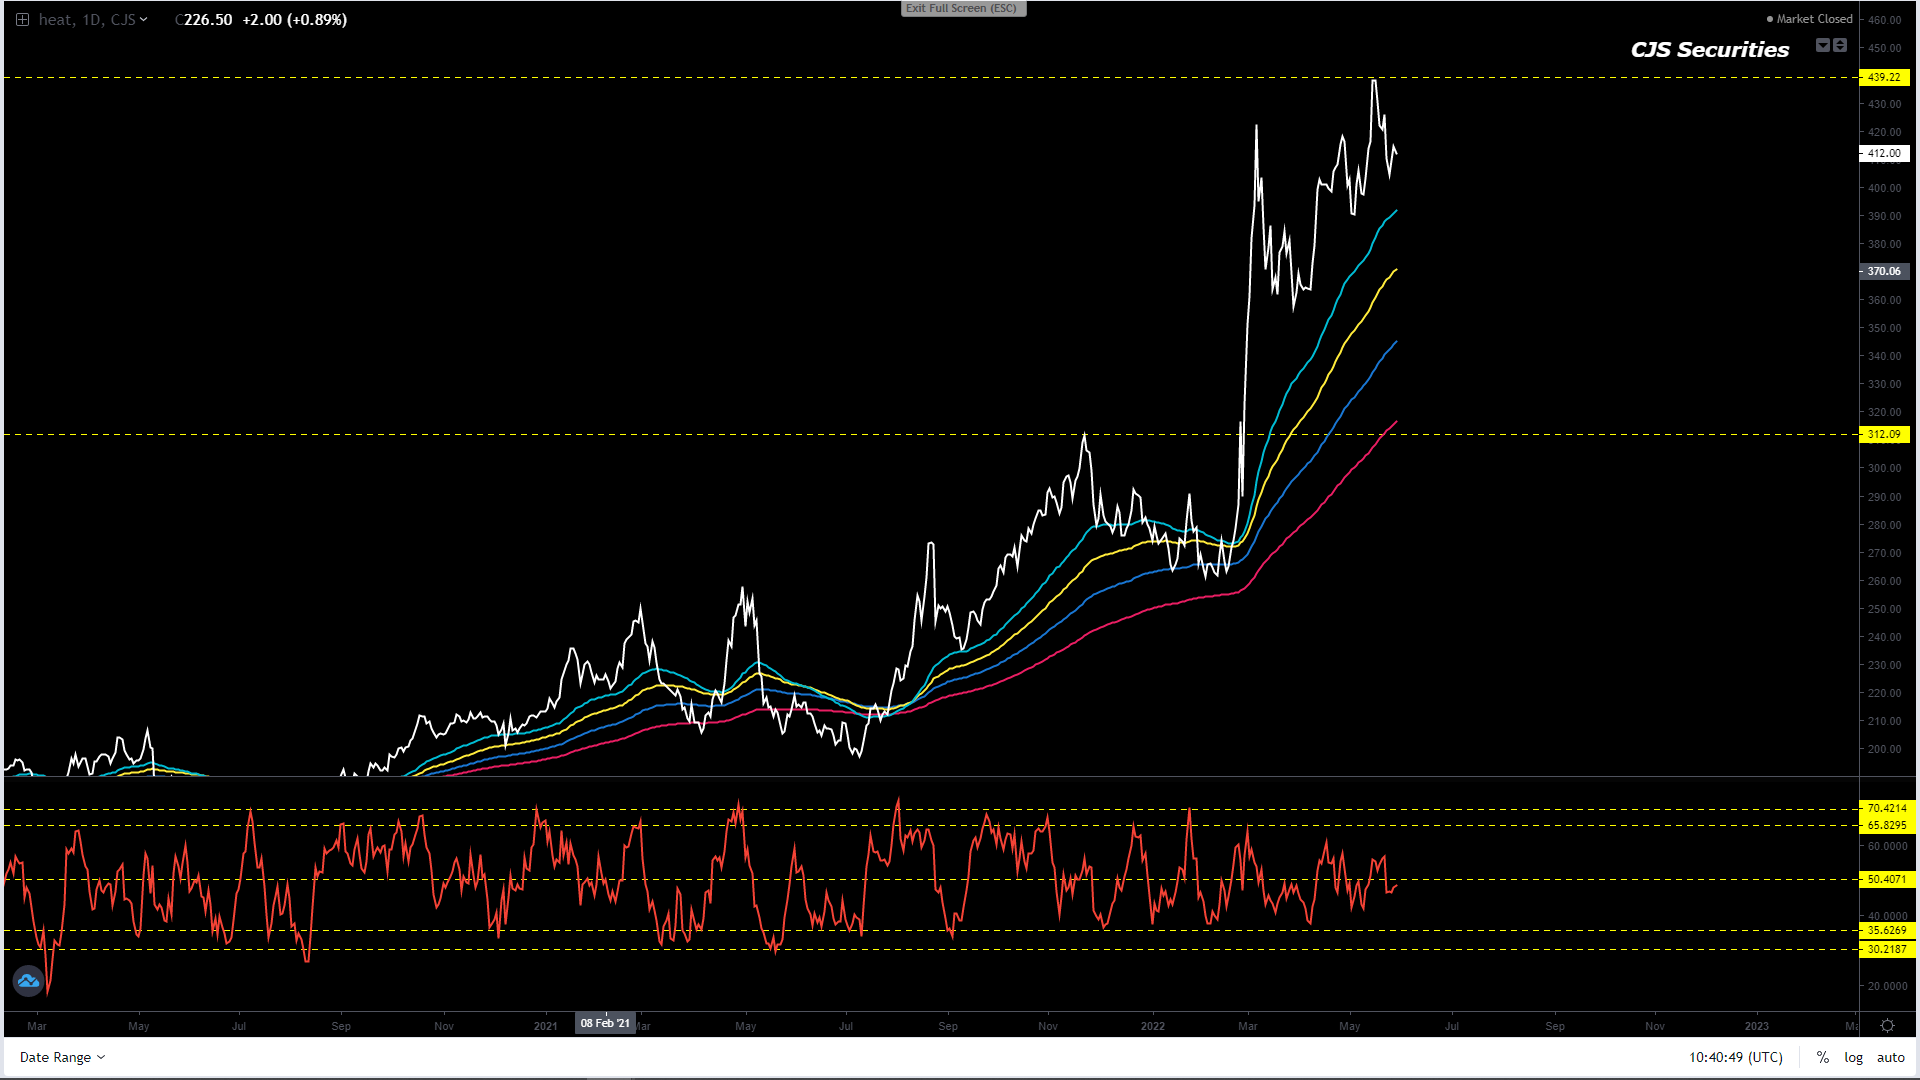
Weekly Chicago SRW Wheat Continuous
I would take profit on all longs and go square as the risk of a deep pullback is pretty high.
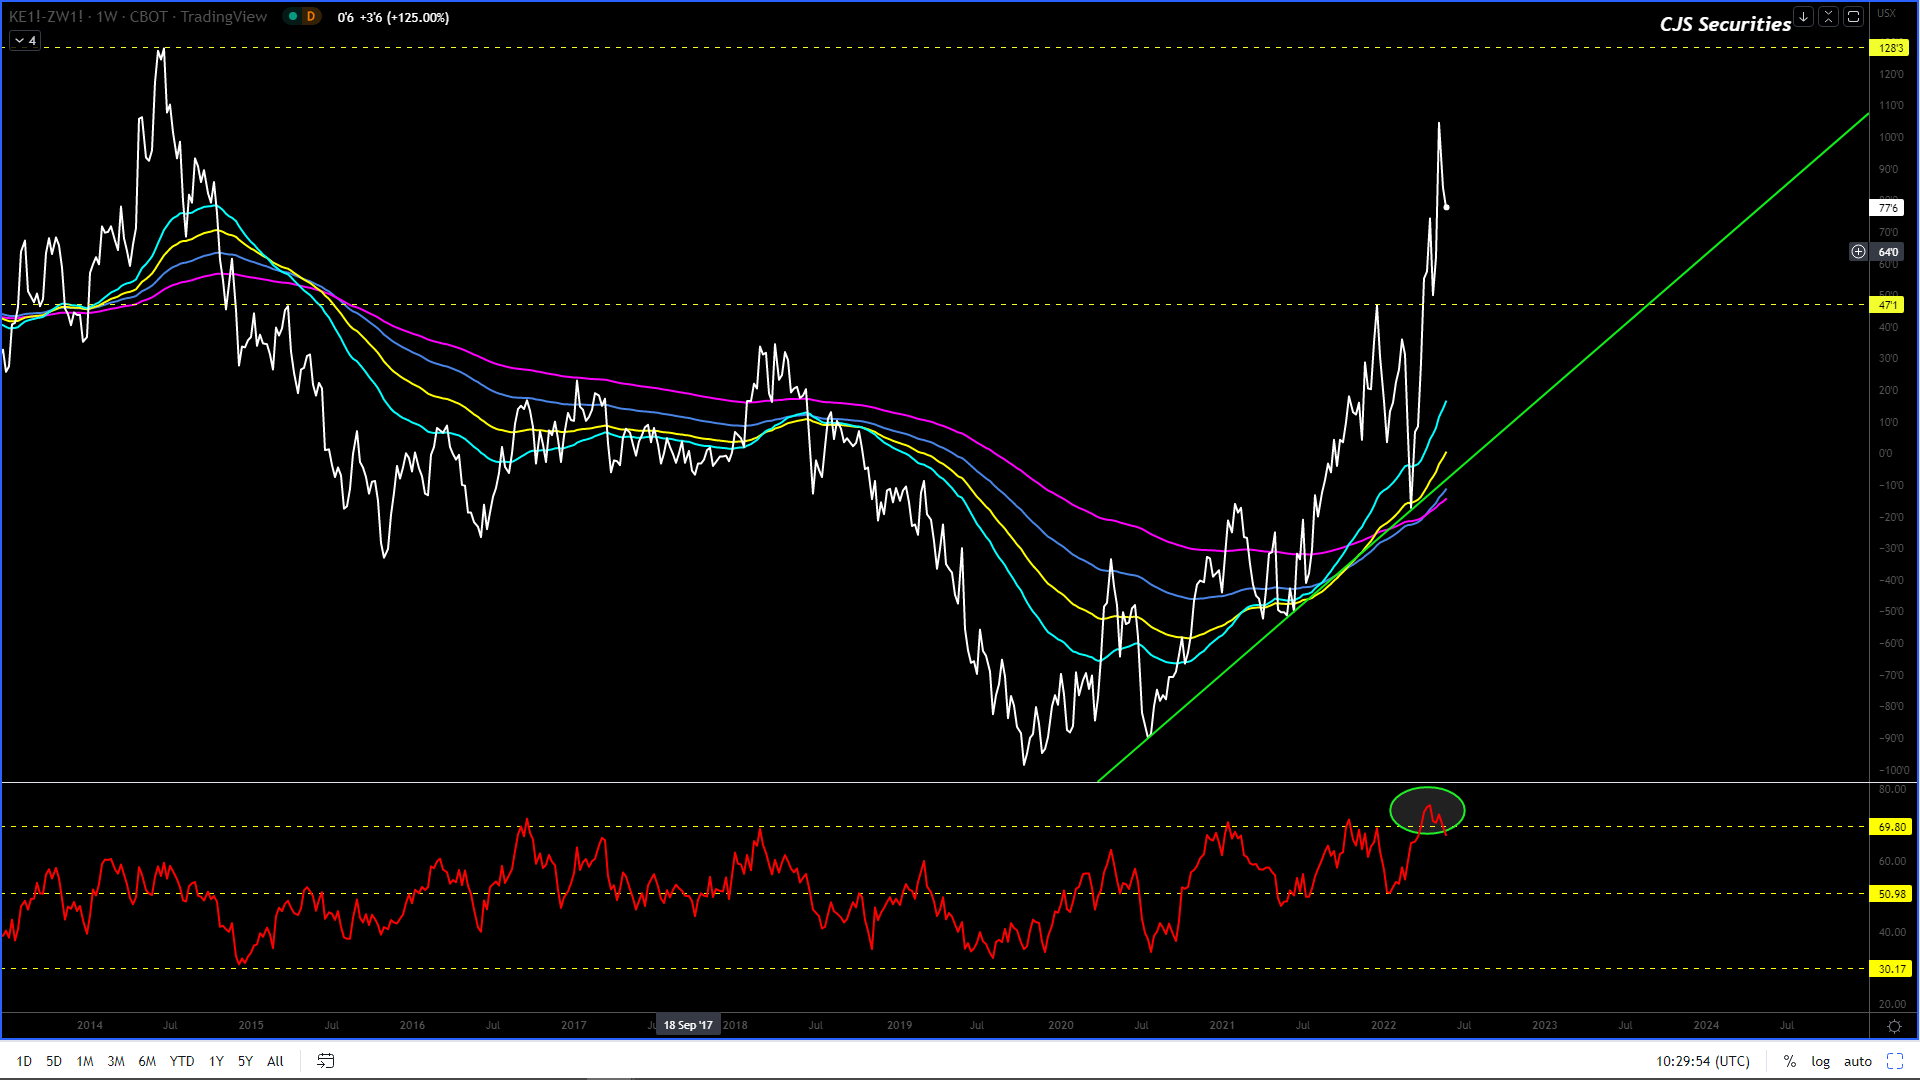
Weekly Close KC Wheat v Chicago SRW Continuous Close
I want to buy this chart at $0.60!
The chart REMAINS overbought on a weekly basis
Weekly SAF Wheat Continuous Close
Should this current formation hold we will not be too far away from a buying opportunity.
I would however like this to correlate with the chart being oversold and hence will sit on the side line for now.