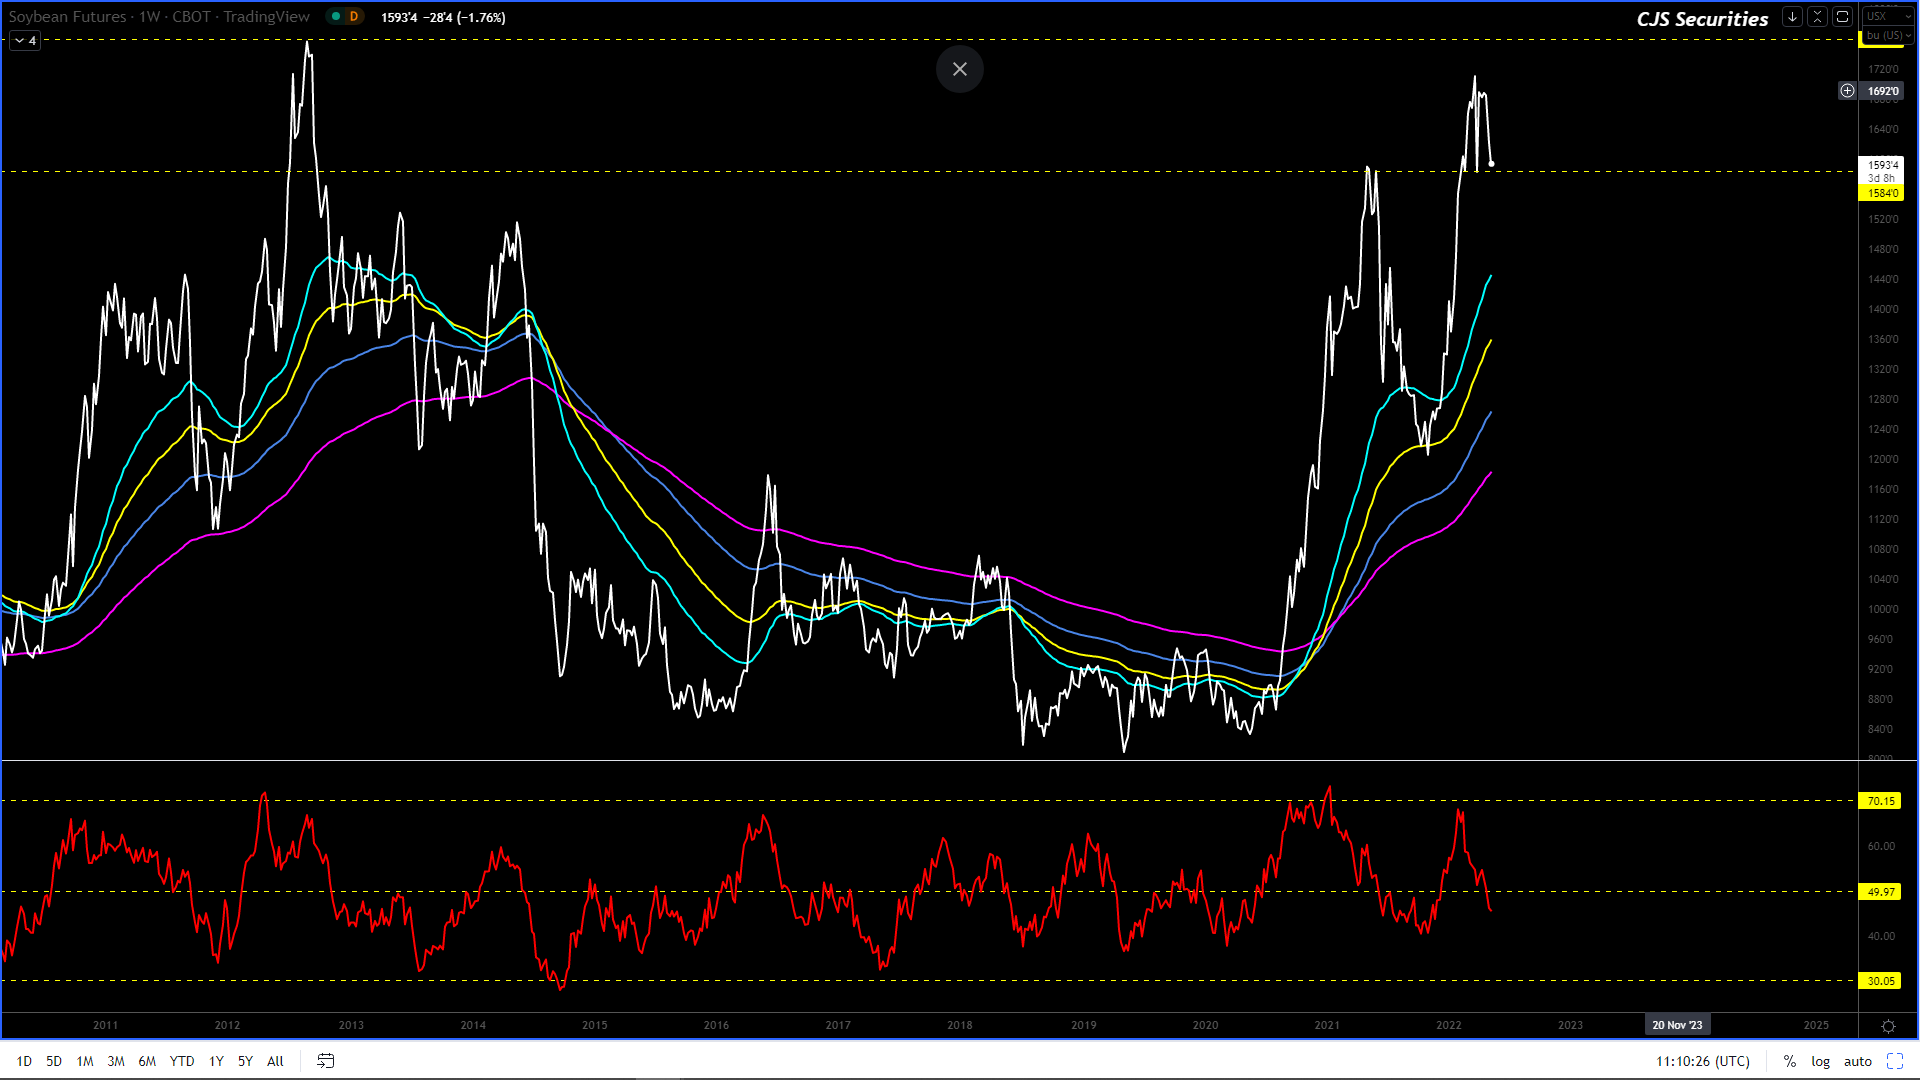
All the pullbacks REMAIN buying opportunities, as $15.84 should provide massive support. – looking good so far!
I would use a move to sub $16.00 to get long in size as this rodeo is far from over!
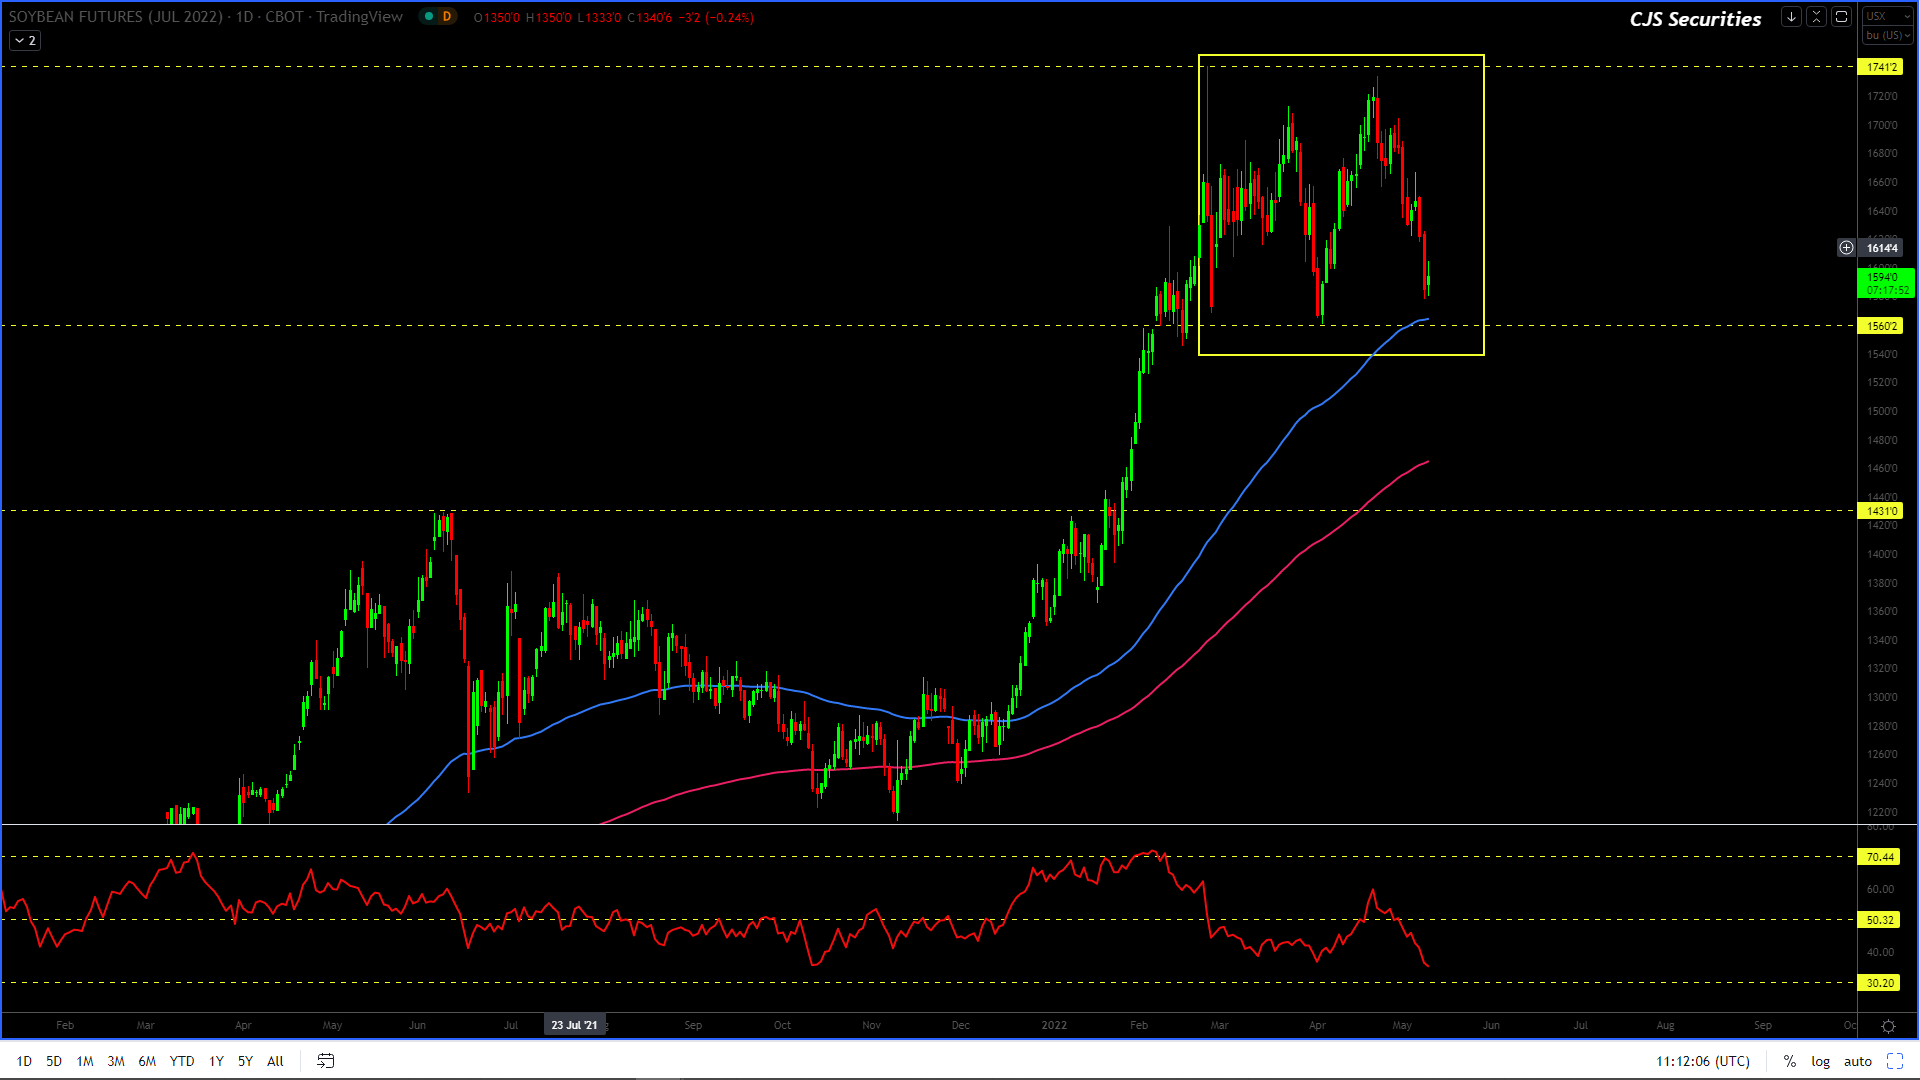
240 Min CBOT July 22 Soybean Candle Chart
#No Change in Commentary
The 240 min chart is clearly busy making a correction and based on its current formation we could be headed to $15.75. – looking very good to date!
A move of this nature would be considered a massive buying opportunity and I would even look at buying here downscale.
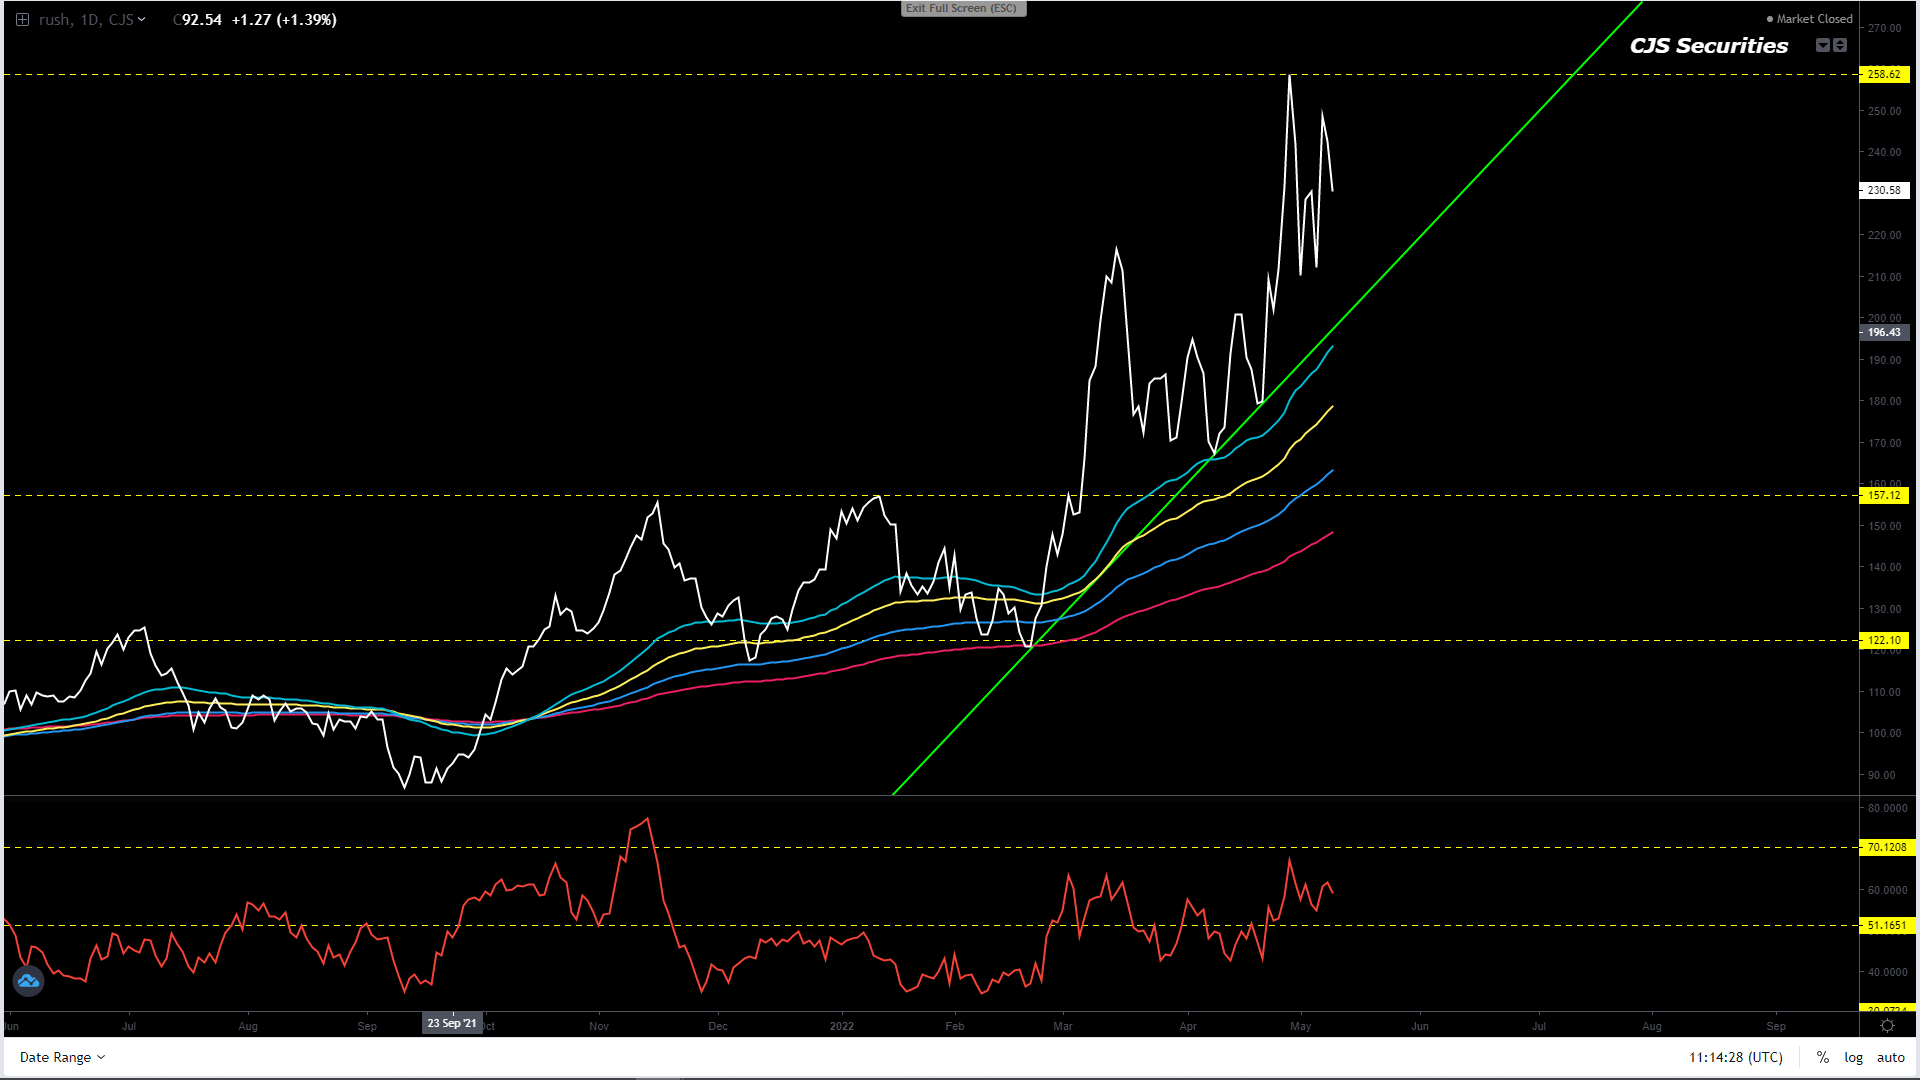
Board Crush Continuous Daily Close
Currently I am happy to sit out of this market for now.
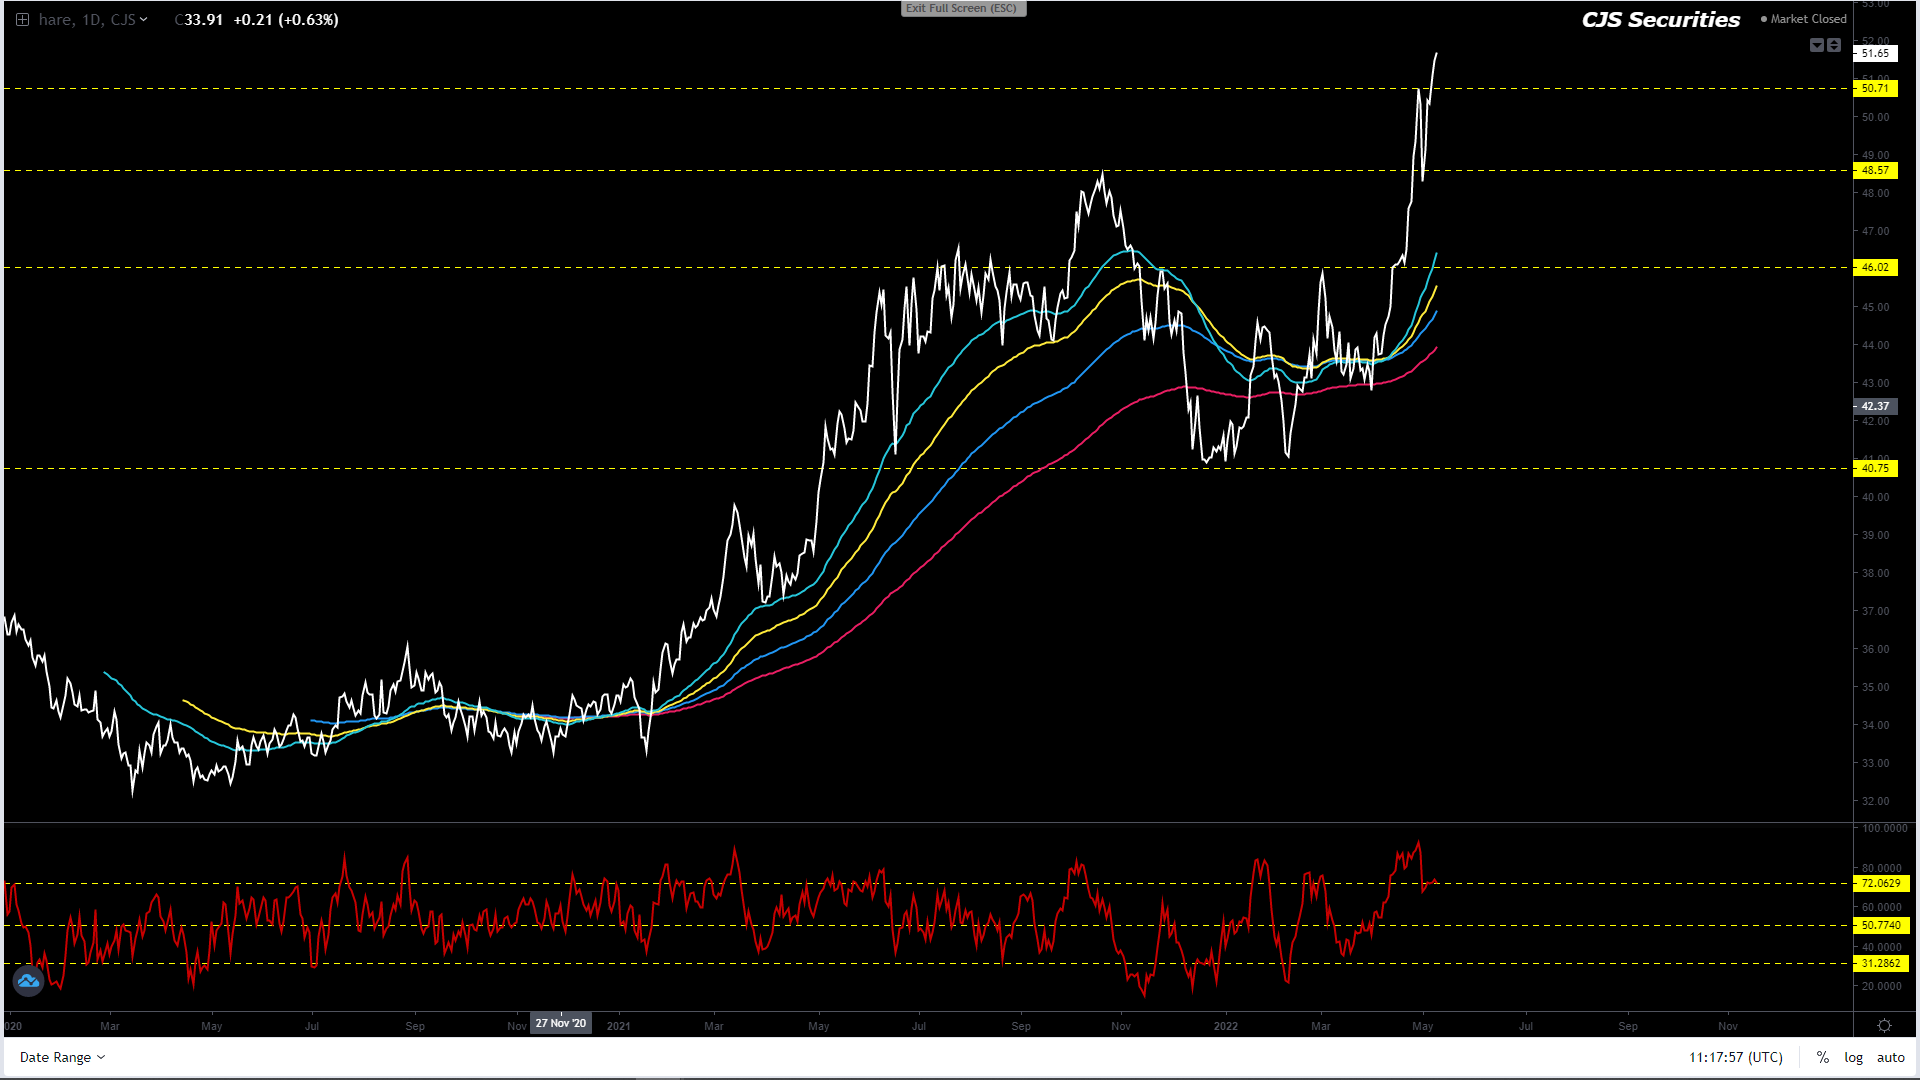
Oil Share Continuous Daily Close
I got the below completely wrong and I do not have much to say other than the chart is overbought.
Based on the current formation this chart could come down significantly before heading higher, hence we are happy to wait. – going lower was way wrong!
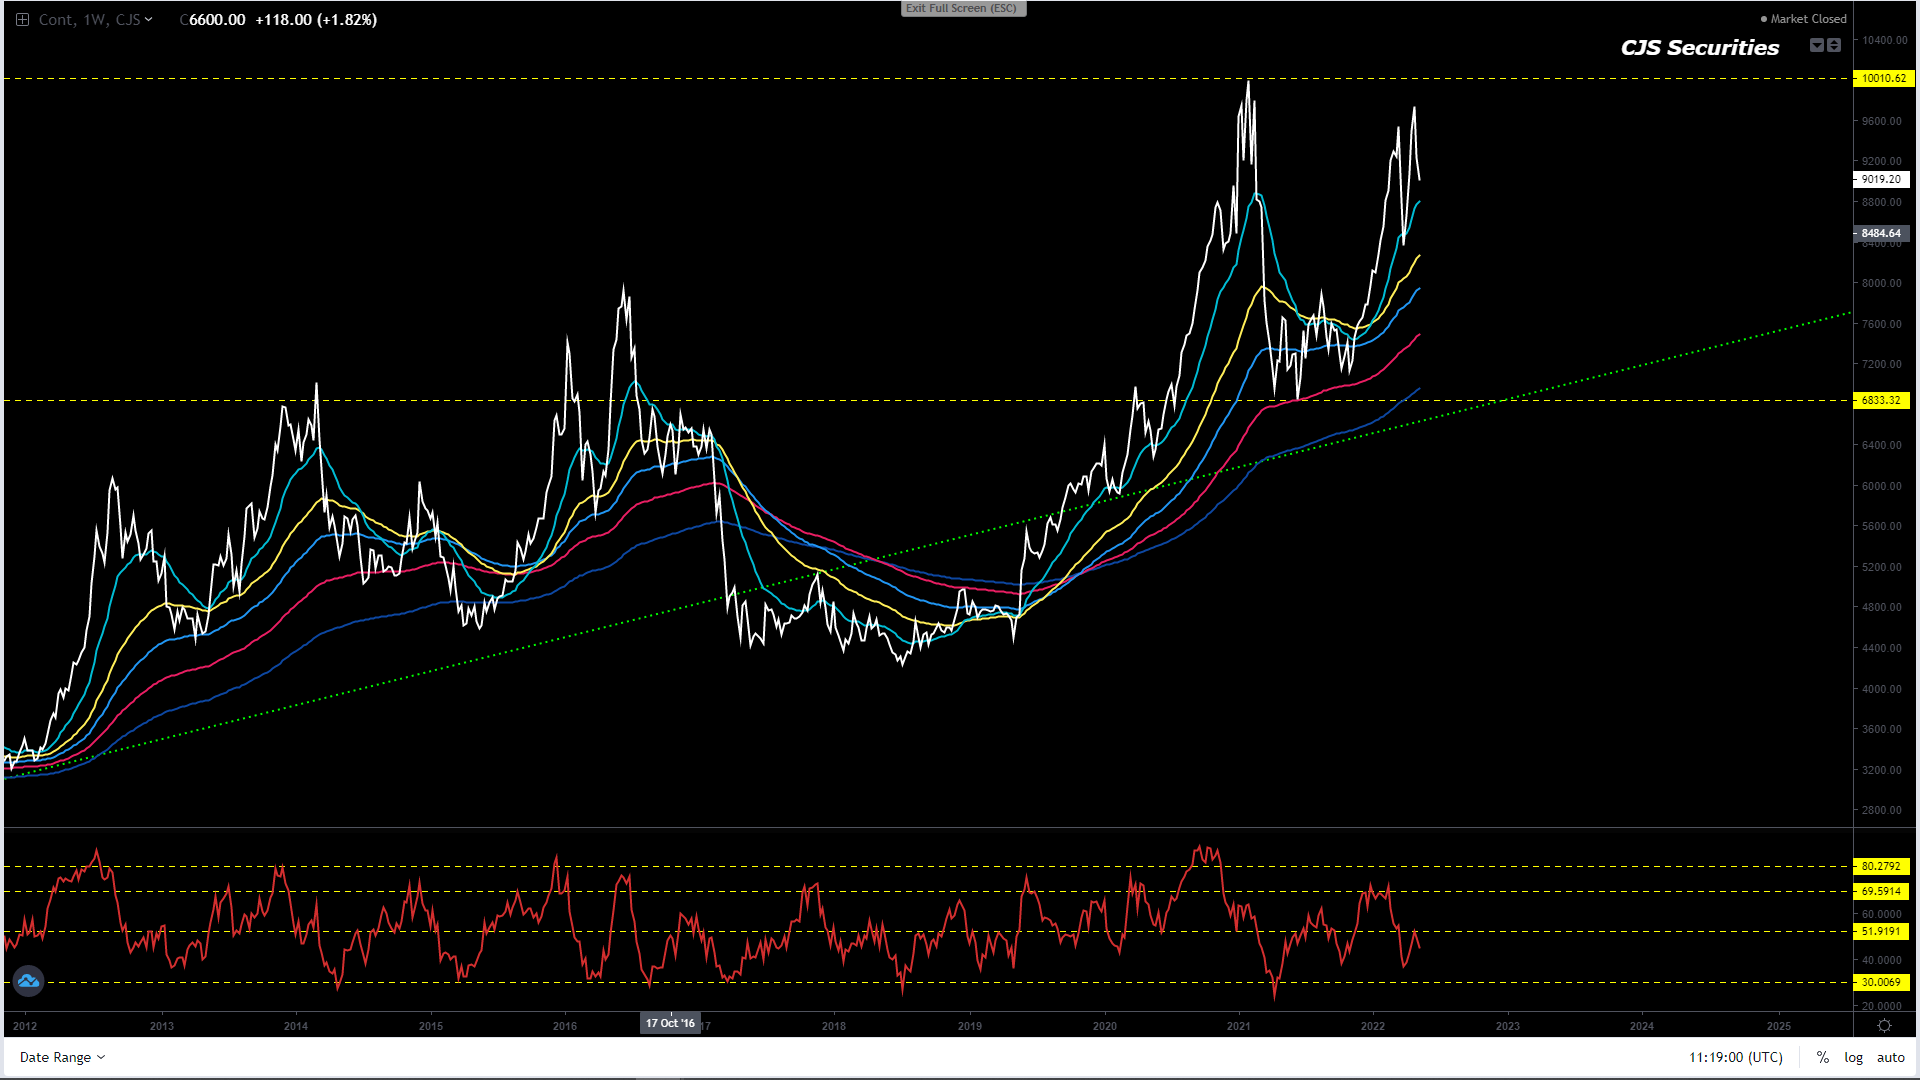
Weekly SAF Soy Continuous Close
There remains no reason to sell this chart but a pullback appears to be well on the cards. – as we are currently experiencing.
We are waiting for buying opportunities R400 – R600 lower.
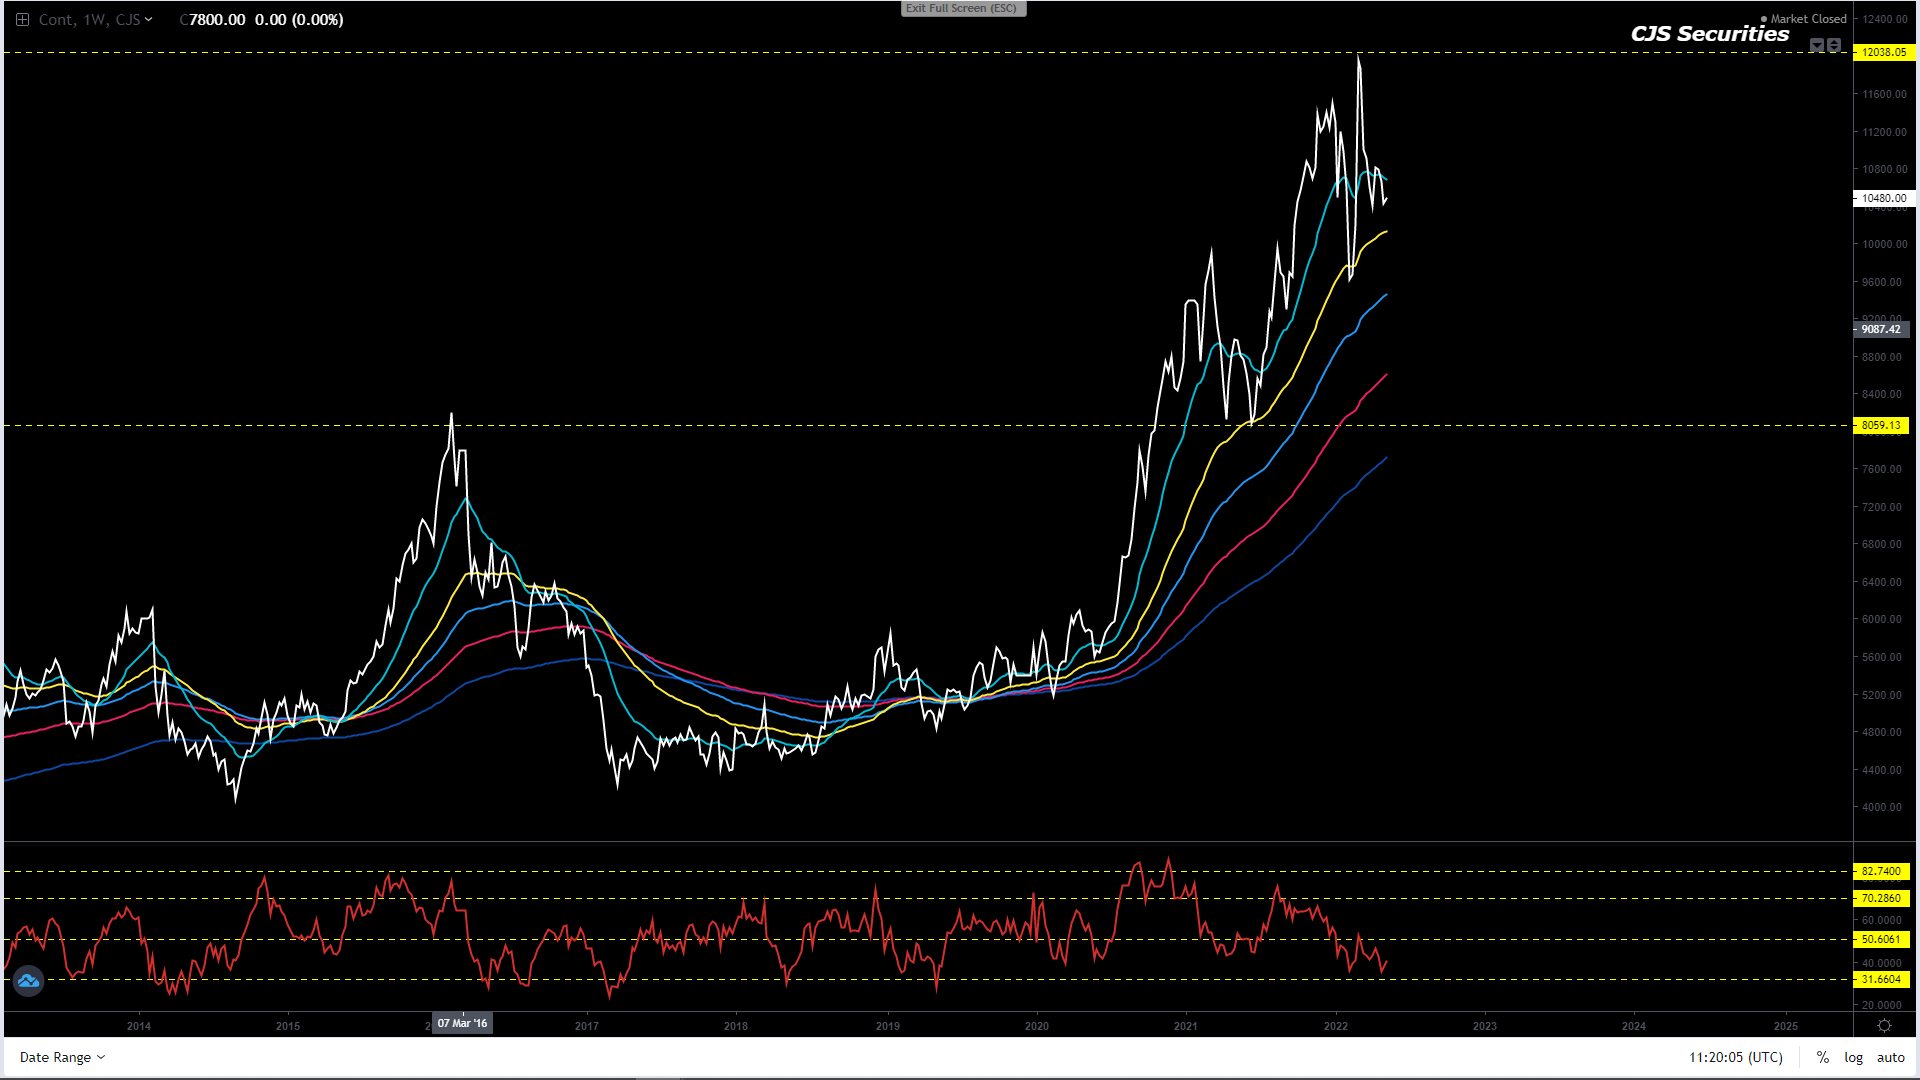
Weekly SAF Suns Continuous Close
#No Change in Commentary
Technically I am very confused and will be happy to sit on the side line until further notice.
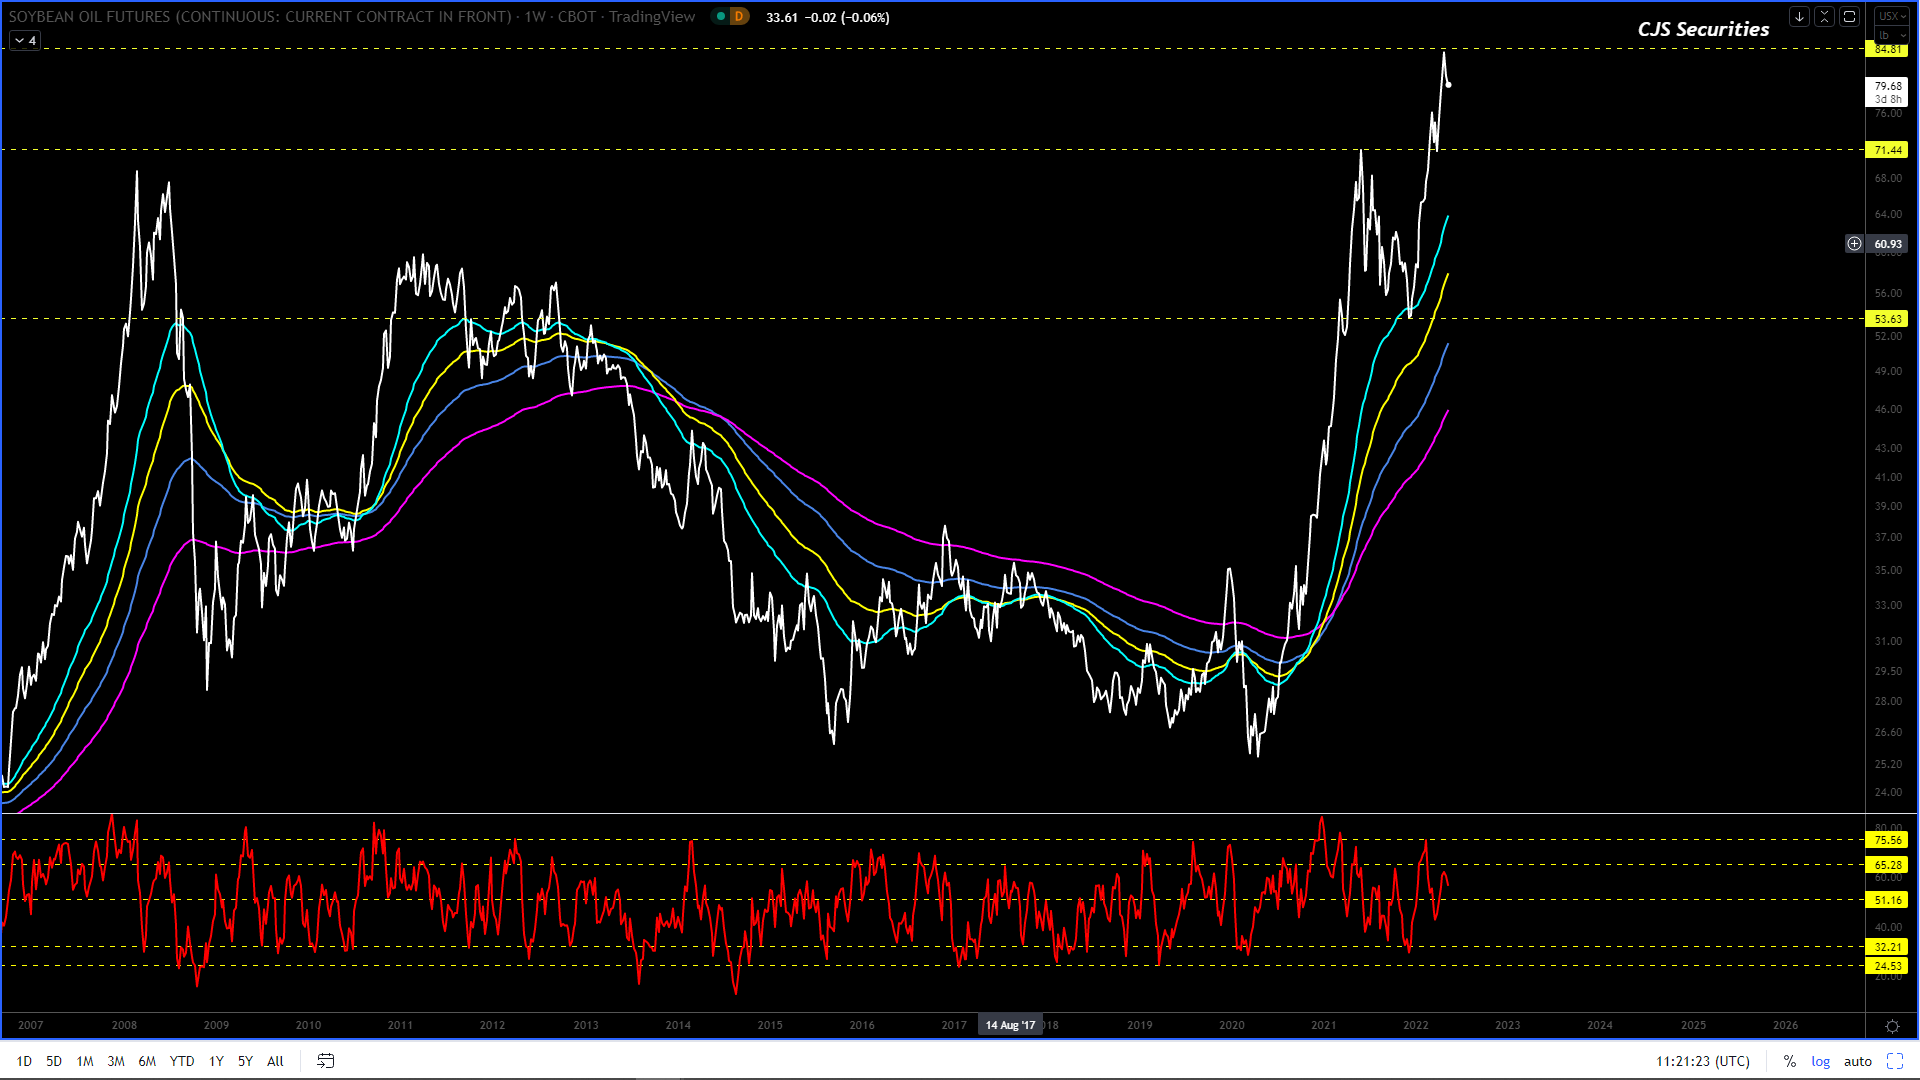
Weekly CBOT Soy Oil Continuous Close
#No Change in Commentary
I would now advise taking your cash and keeping it, while letting the market play out for a good few weeks. – I remain very happy with this view.
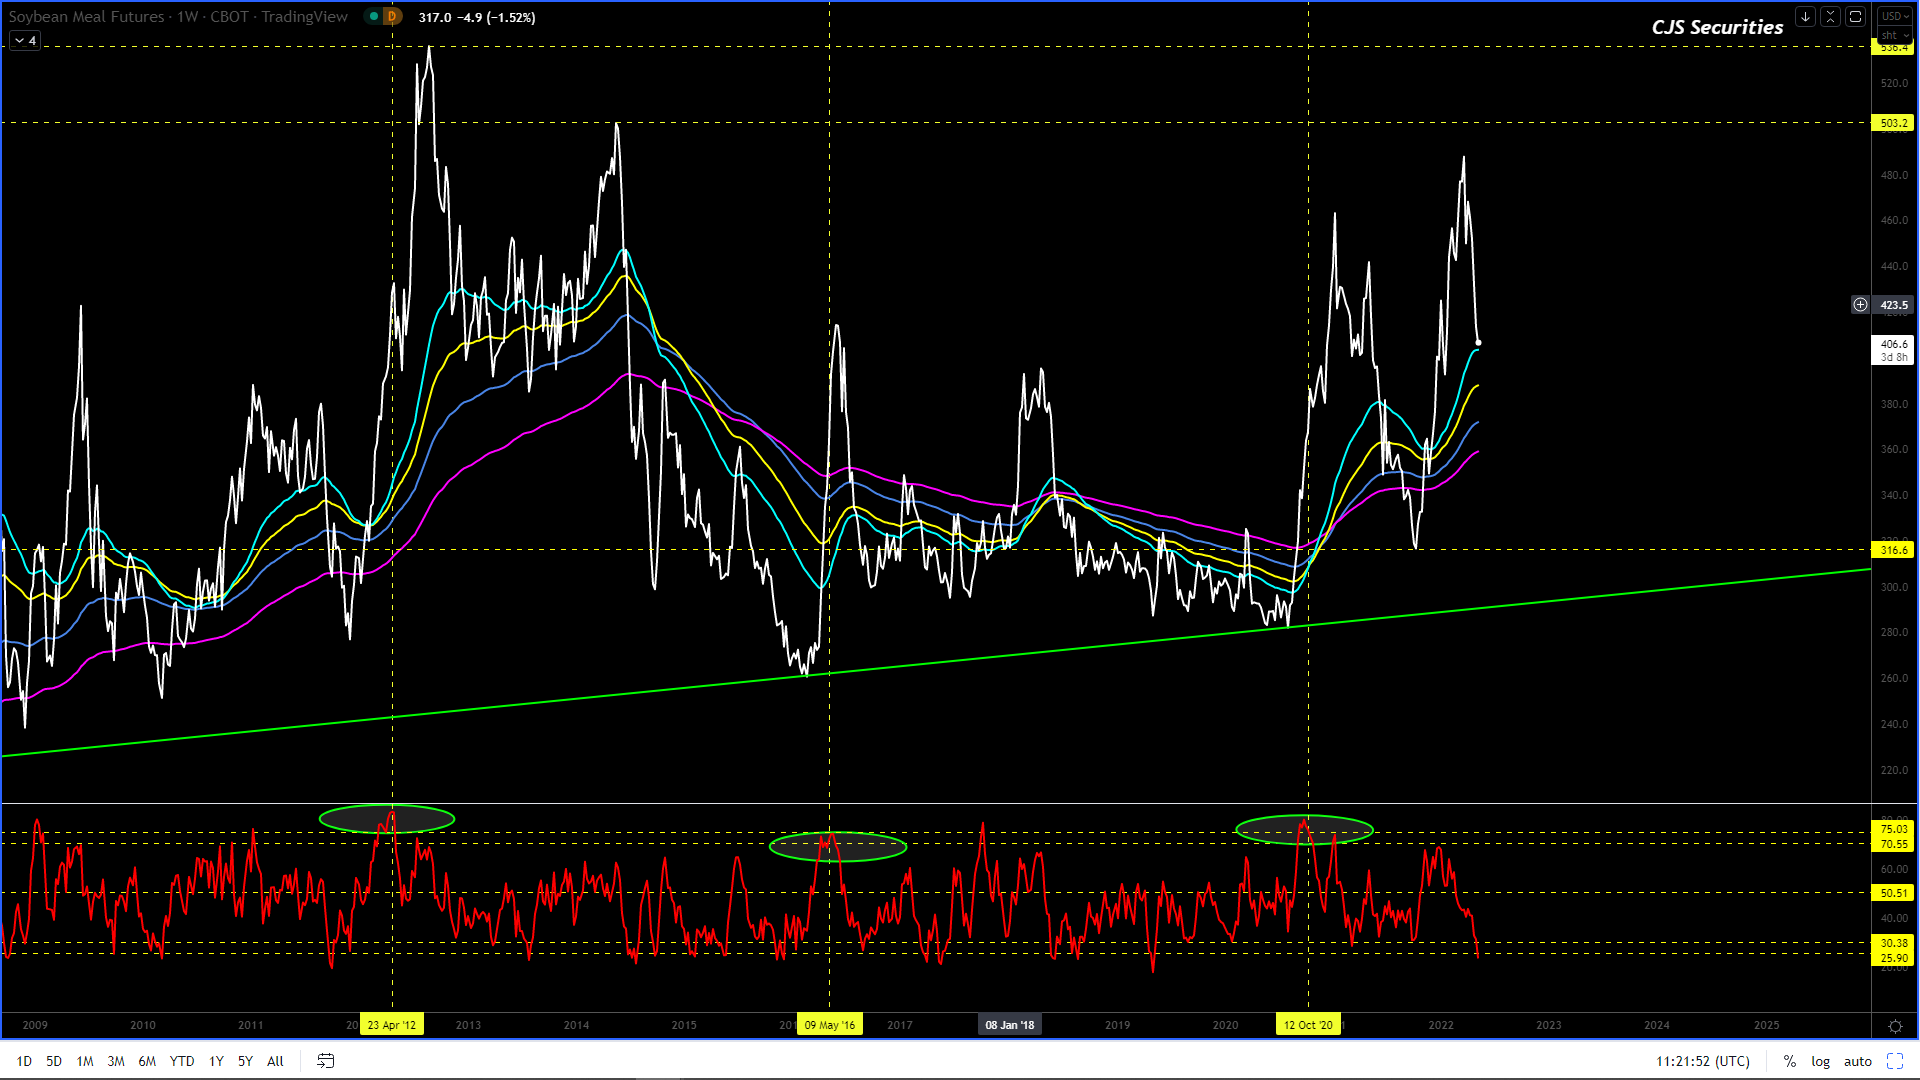
Weekly CBOT SBM Continuous Close
We
are long after the below commentary and will buy more down to $390, as this market is grossly oversold, and on a
rally we will look at getting out over $429 as
the overall formation still appears to have some decent MT downside.
This
market looks corrective and the oscillator is pretty low and hence we now
waiting to buy sub $428!