I remain of the opinion that, currently, this chart looks far more like a correction than a top.
The pullback level I had was as low as R17.60 before going higher has a minimum downside target of R17.87 that could have been reached yesterday.
I would seriously consider locking in Dollars (if you need to buy them) under R17.90 and buying into weakness. – there was a 2-hour period yesterday when the price traded sub R17.90.
The only way the market is not in a corrective phase based on the Weekly chart is if we close under R17.07. – this looks highly unlikely.
The good news is that the next leg higher would be well worth a top picker’s chance, as IMO this should be the last leg higher before starting a decent corrective phase.
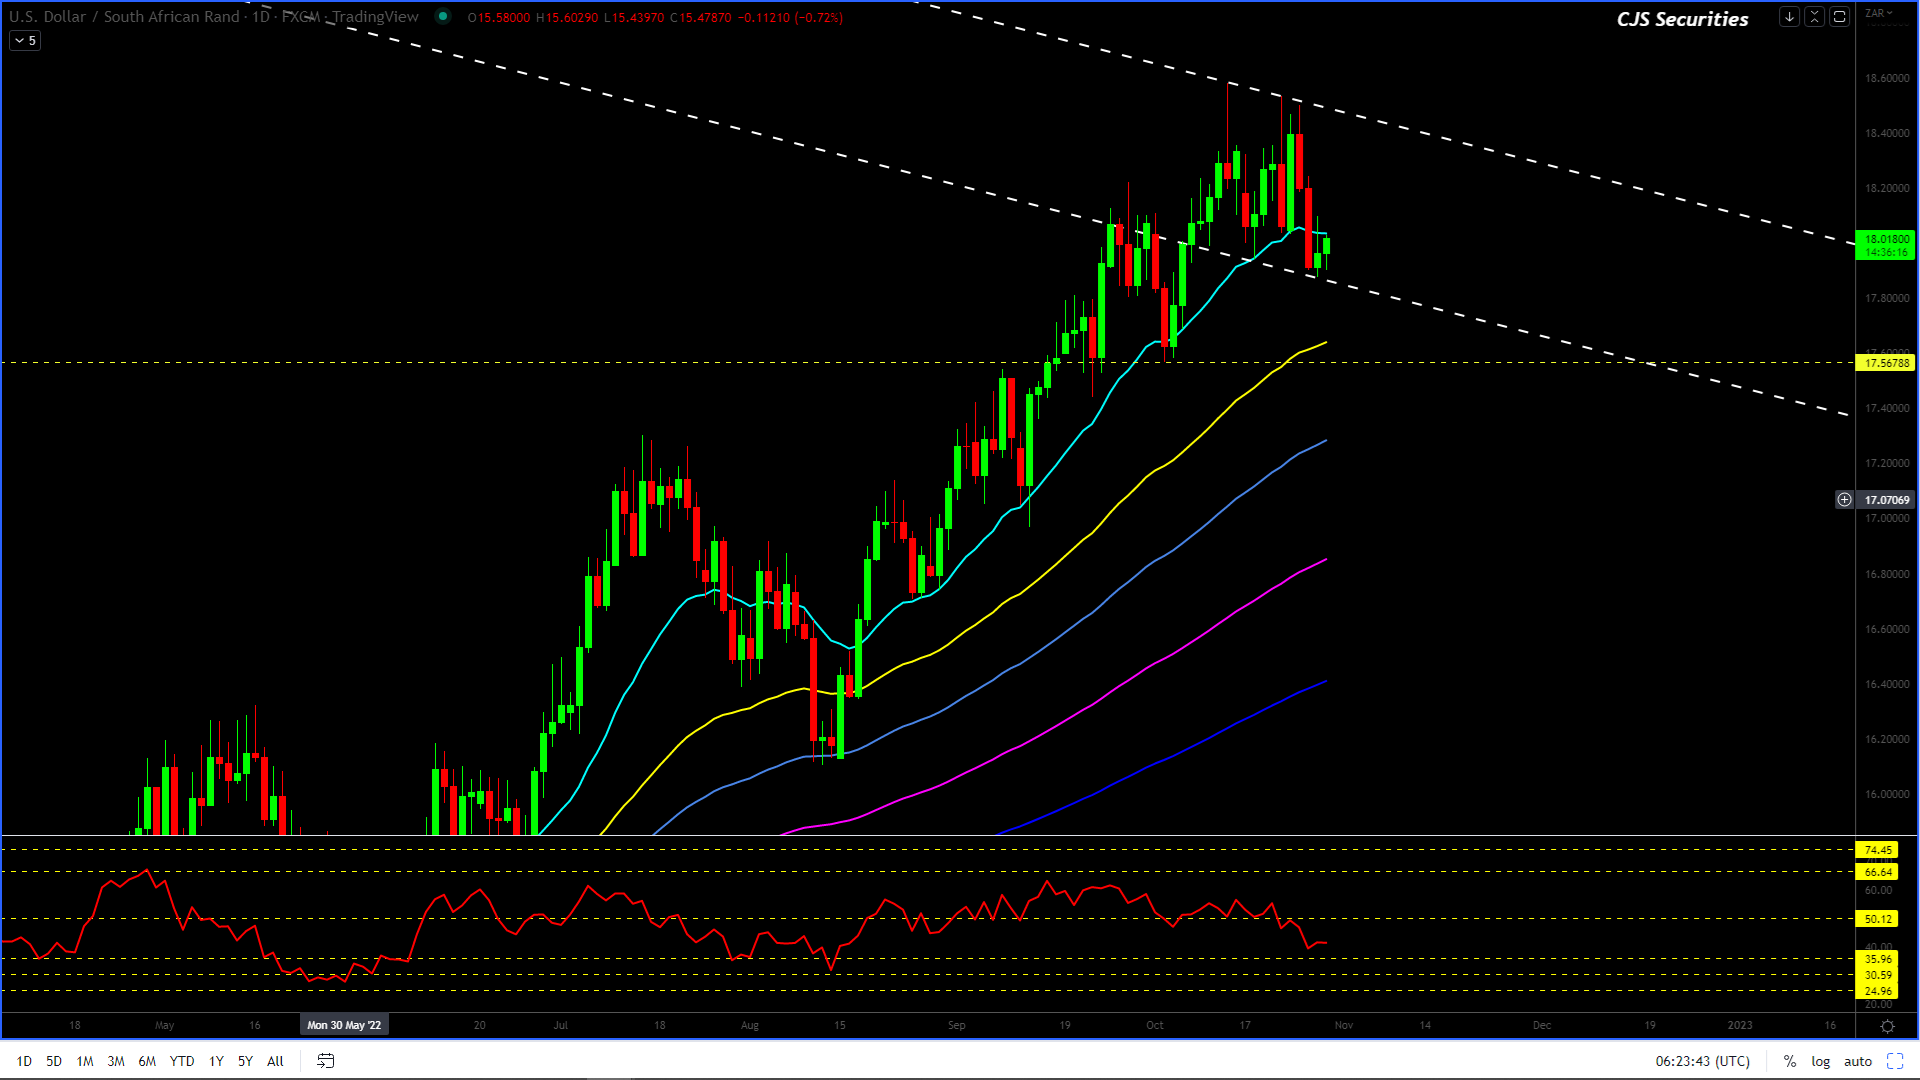
Dollar/Rand Daily Candle
The
Daily Chart starts to look more corrective than its Weekly counterpart.
The pullback
level on the Daily could potentially still trade as low as R17.60.
I would look to buy a dip of this nature as scale down
to R17.45with
a stop under R17.40.
The Daily chart will only reverse
the upward trend based on a close under R17.17.
With the current price ranges
trading this wide, we would prefer to adopt a risk-off approach unless we see
the lower levels at which we can get long USD.
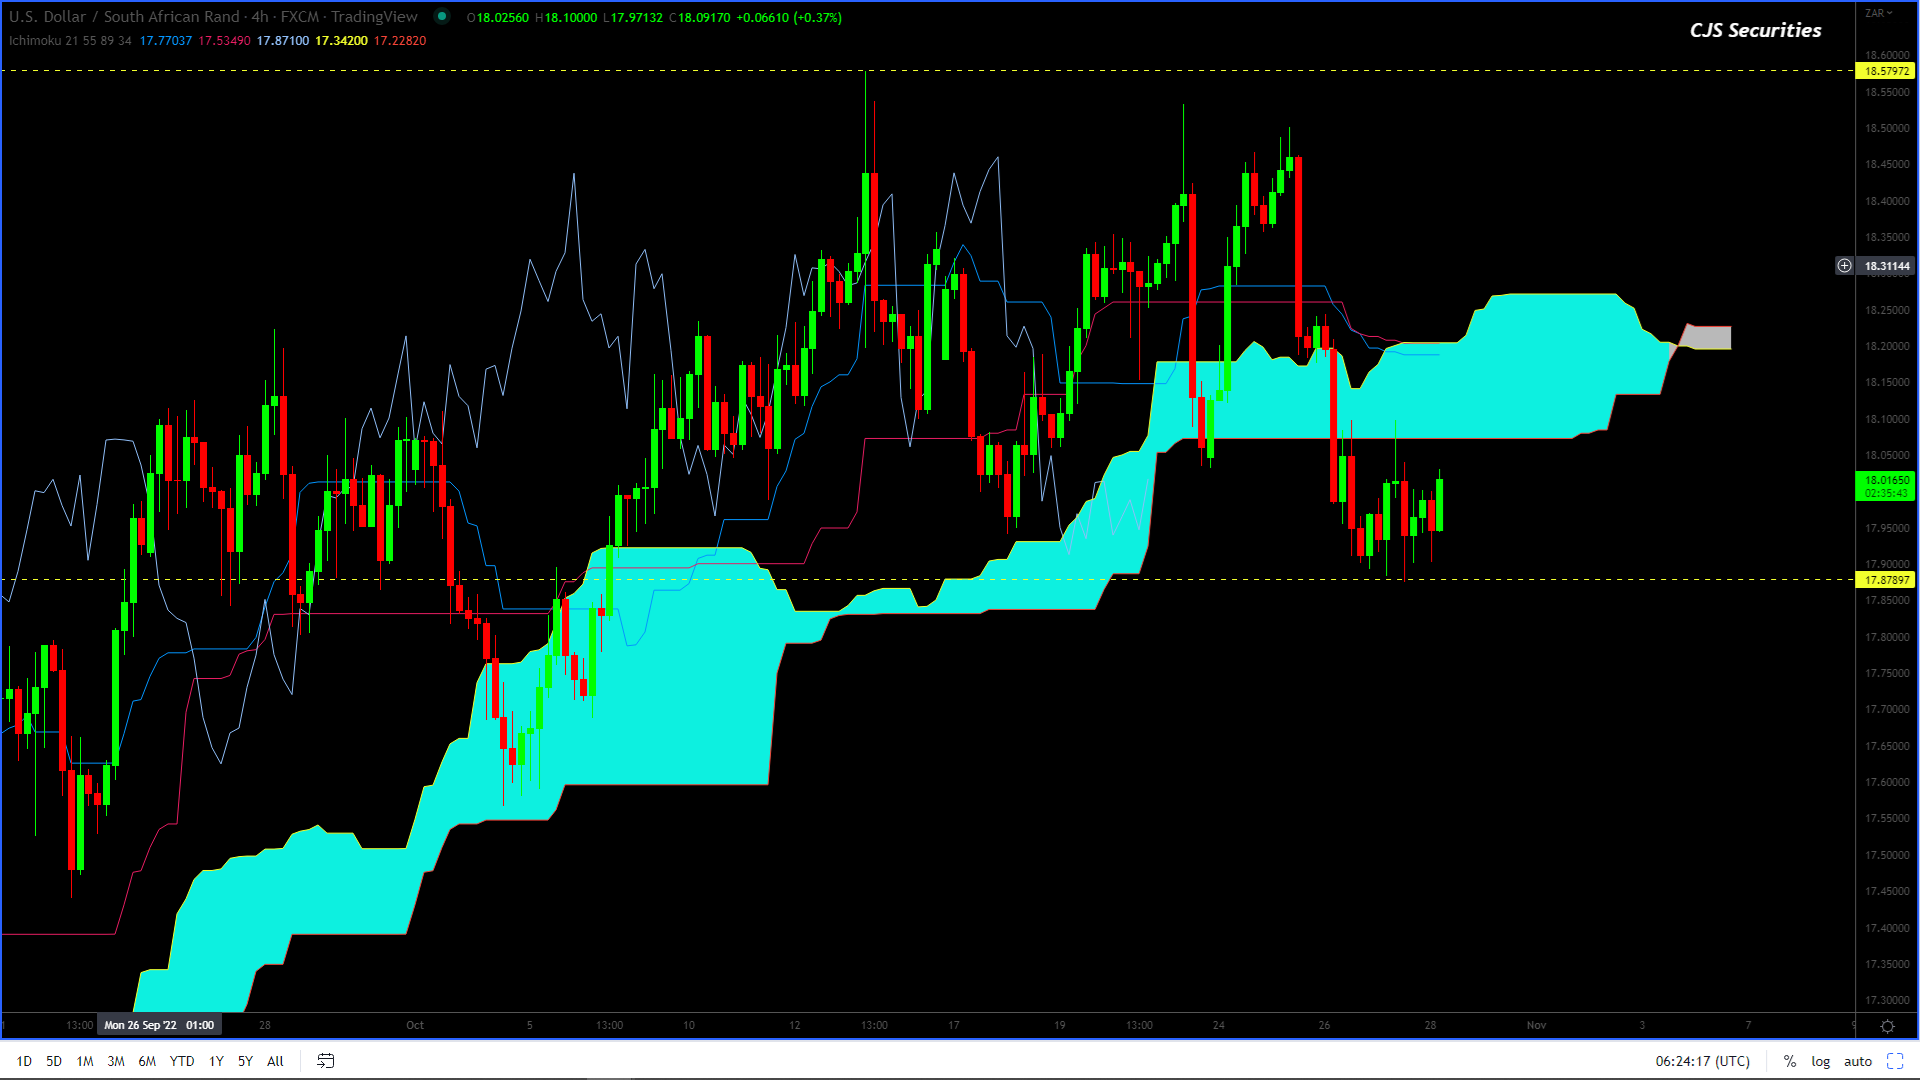
Dollar/Rand 240 Min Candle
The 240 Min Chart appears to be making a consolidation that will trade
anything between R0.12 – R0.30lower.
As mentioned, I feel we
are more in a corrective phase, and the chart’s current formation also lends itself
more to being corrective rather than a top formation.
Technically, I would look to
own the USD on a decent move lower with an SL under R17.55.
Because I feel this is a
correction, I would start buying Dollars under R17.90.