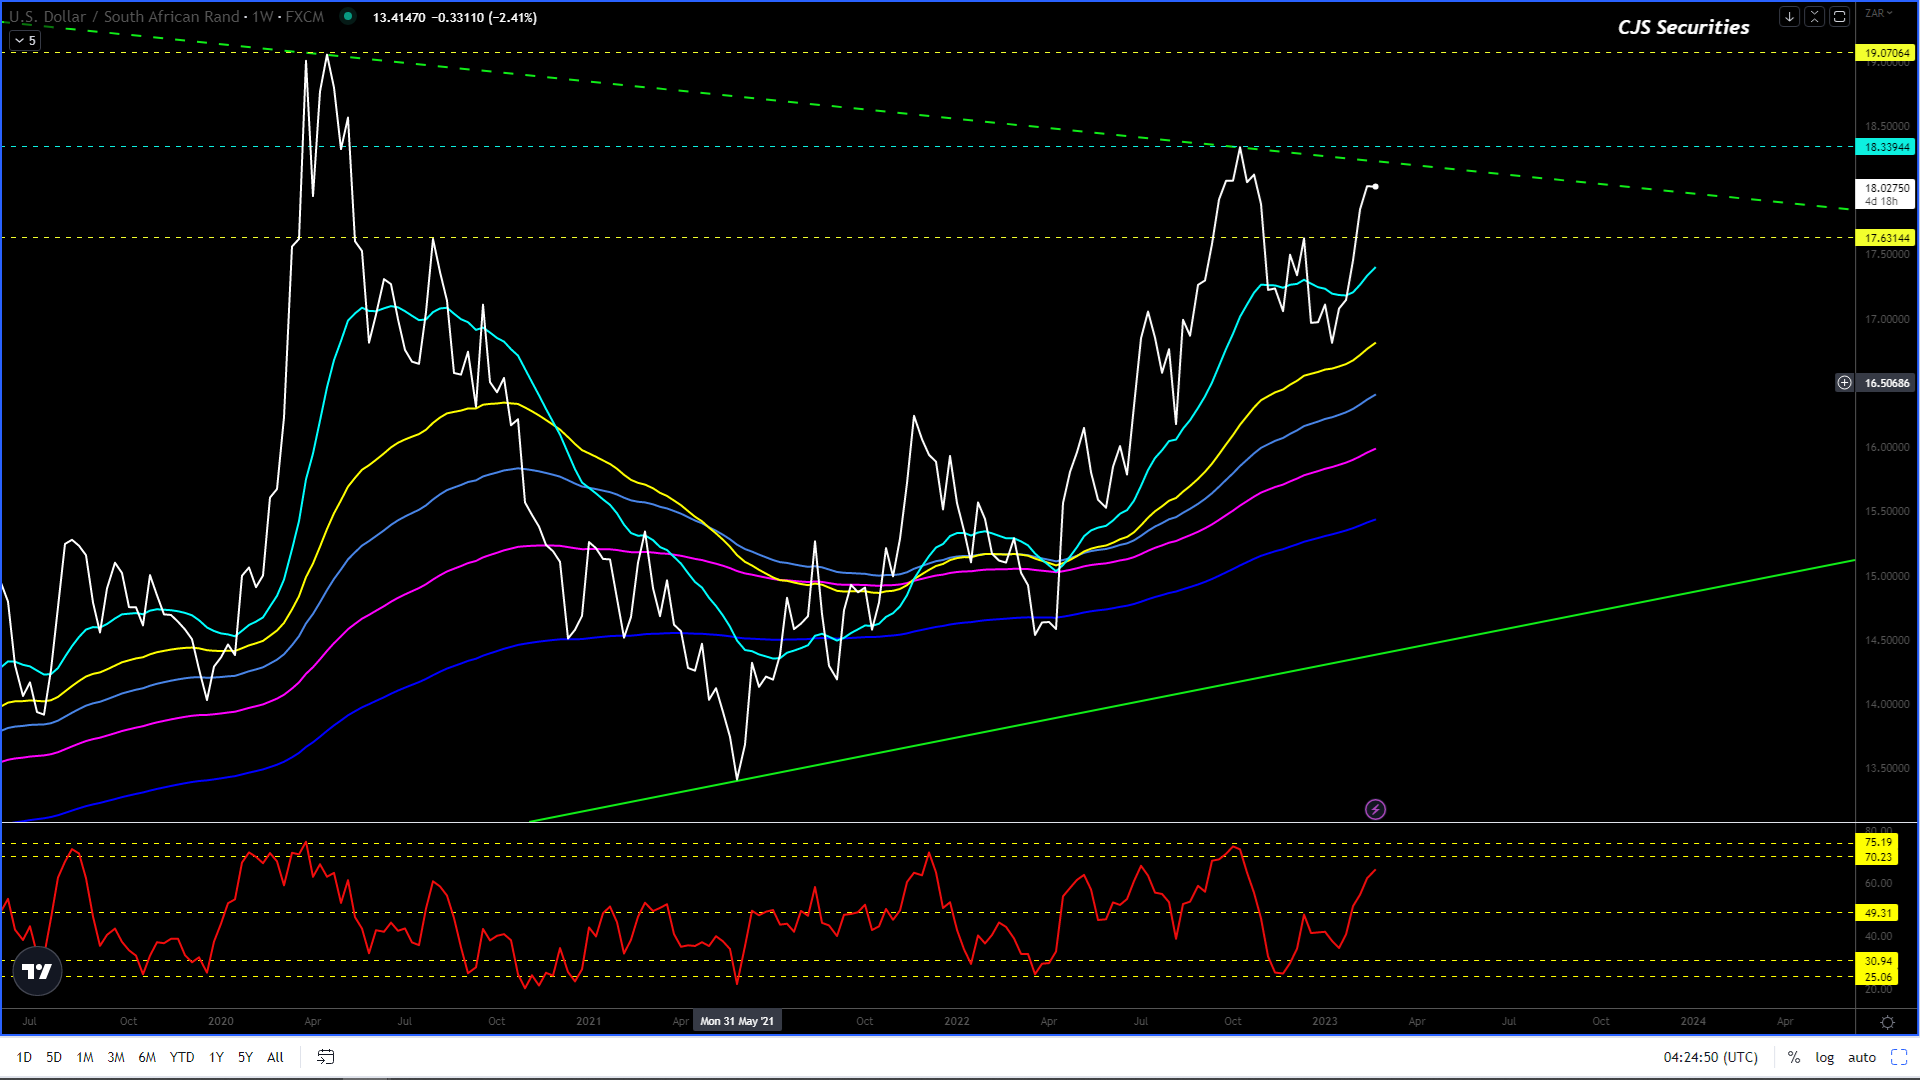
As per the last report sent out on Jan 30th, the ZAR has weakened significantly against the USD.
We are now experiencing a pullback/correction from these levels, but IMO the weakening trend is not over as it stands on the LT charts.
This trend will only reverse once we have a Daily Close under R17.40 combined with a Weekly Close under R17.60.
Until then all major pullbacks are USD buying opportunities.
Most of you will know that IMO the USD bull run is over but that we are currently experiencing a correction and this along with the sentiment and SA’s own internal strife is adding to the ZAR weakness.
In the big picture, there will most certainly be an opportunity to buy the ZAR as IMO the ZAR will have a decent Bull run before year-end, but that time is not now.
Stay focused, and don’t get sucked into being bullish, bearish, or right, focus on your hedge or capitalize on volatility, and the rest will follow.
“When you genuinely accept the risks, you will be at peace with any outcome.” – Mark Douglas
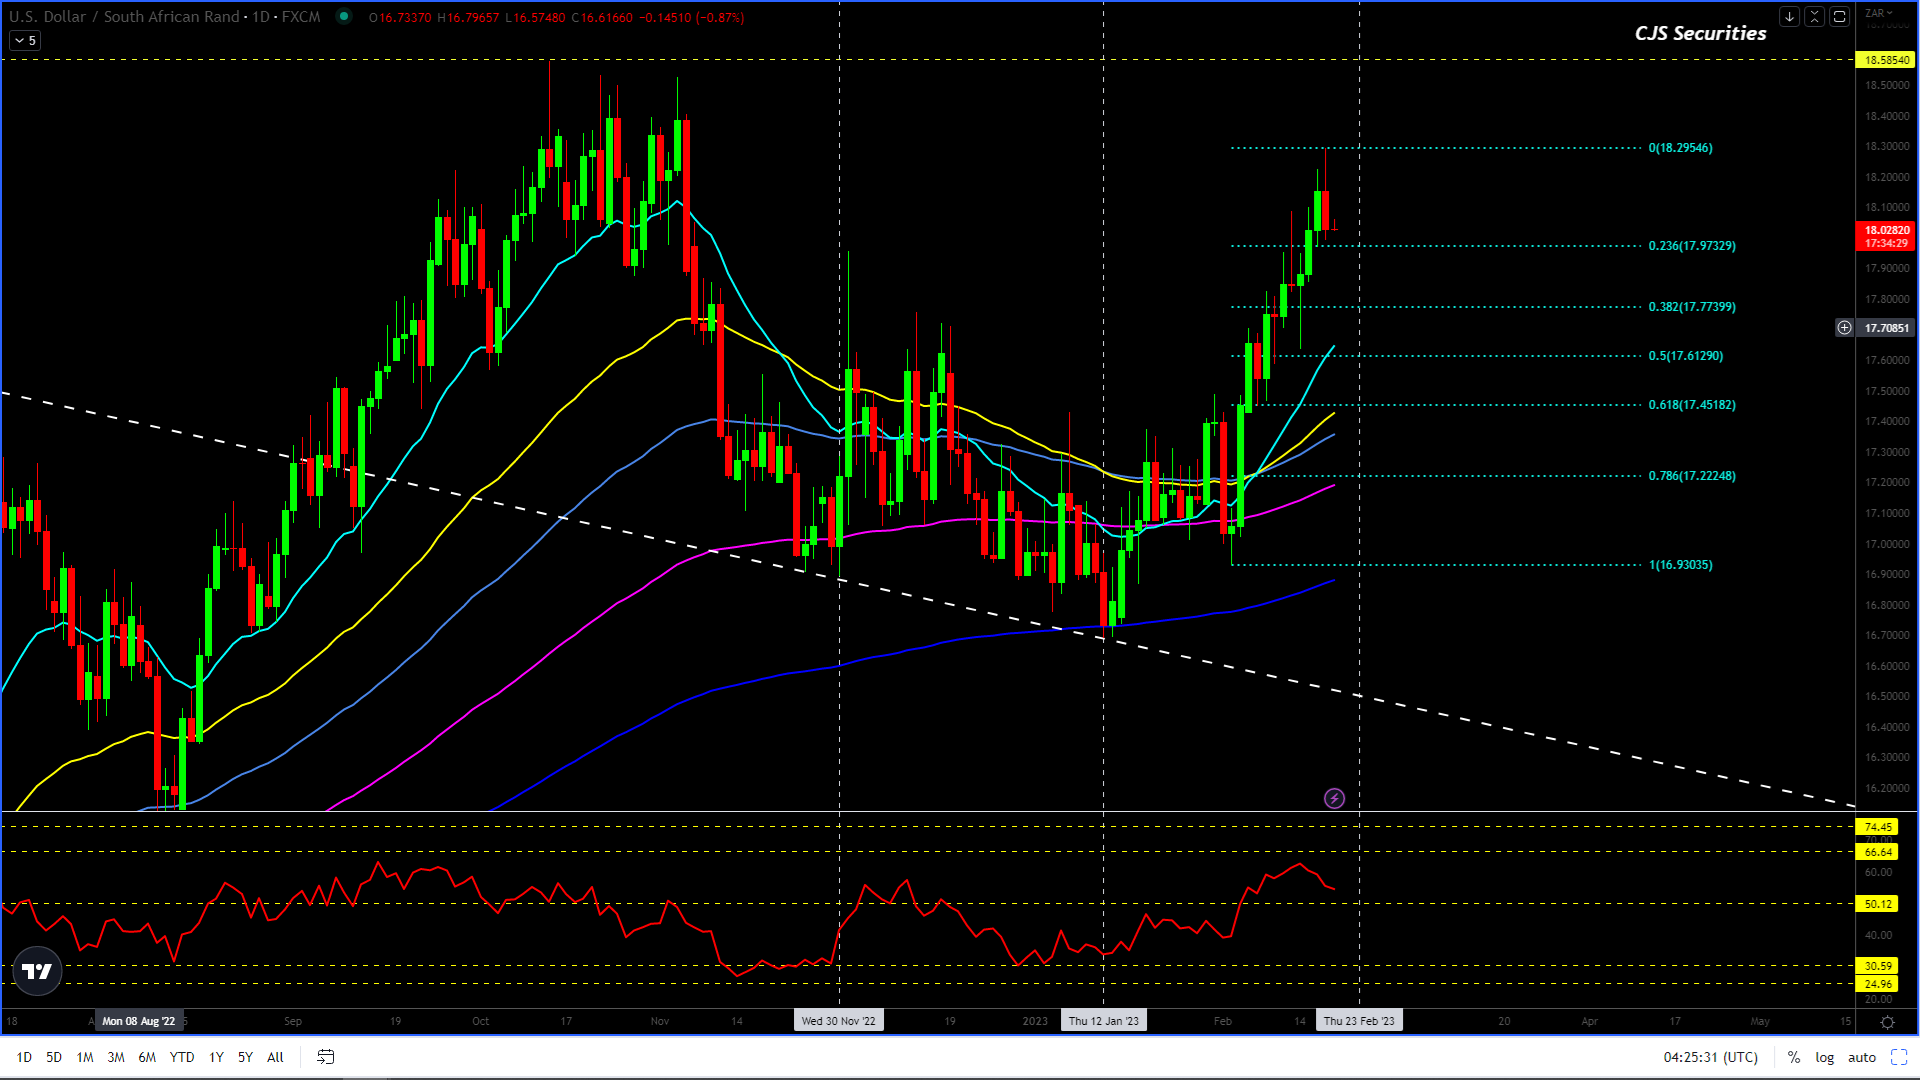
Dollar/Rand Daily Candle
The Daily Candle Chart is trading very nicely on a technical basis.
After a very decent rally, off the low of R17.63 after the US CPI print this chart looks set to consolidate between R18.30 and R17.75.
I would look to buy a dip sub R17.80 scale down to R17.48 (if it gets this low) as there is another leg higher IMO.
The ‘last” upward leg in this move should target R18.58 as a minimum target, and potentially even test the charts ATH’s at R19.35.
In closing, all pullbacks are buying opportunities until the ZAR breaks under R17.40.
If we keep our heads there should be a significant opportunity to make very good returns or hedging decisions in the coming weeks and months as volatility is here to stay.
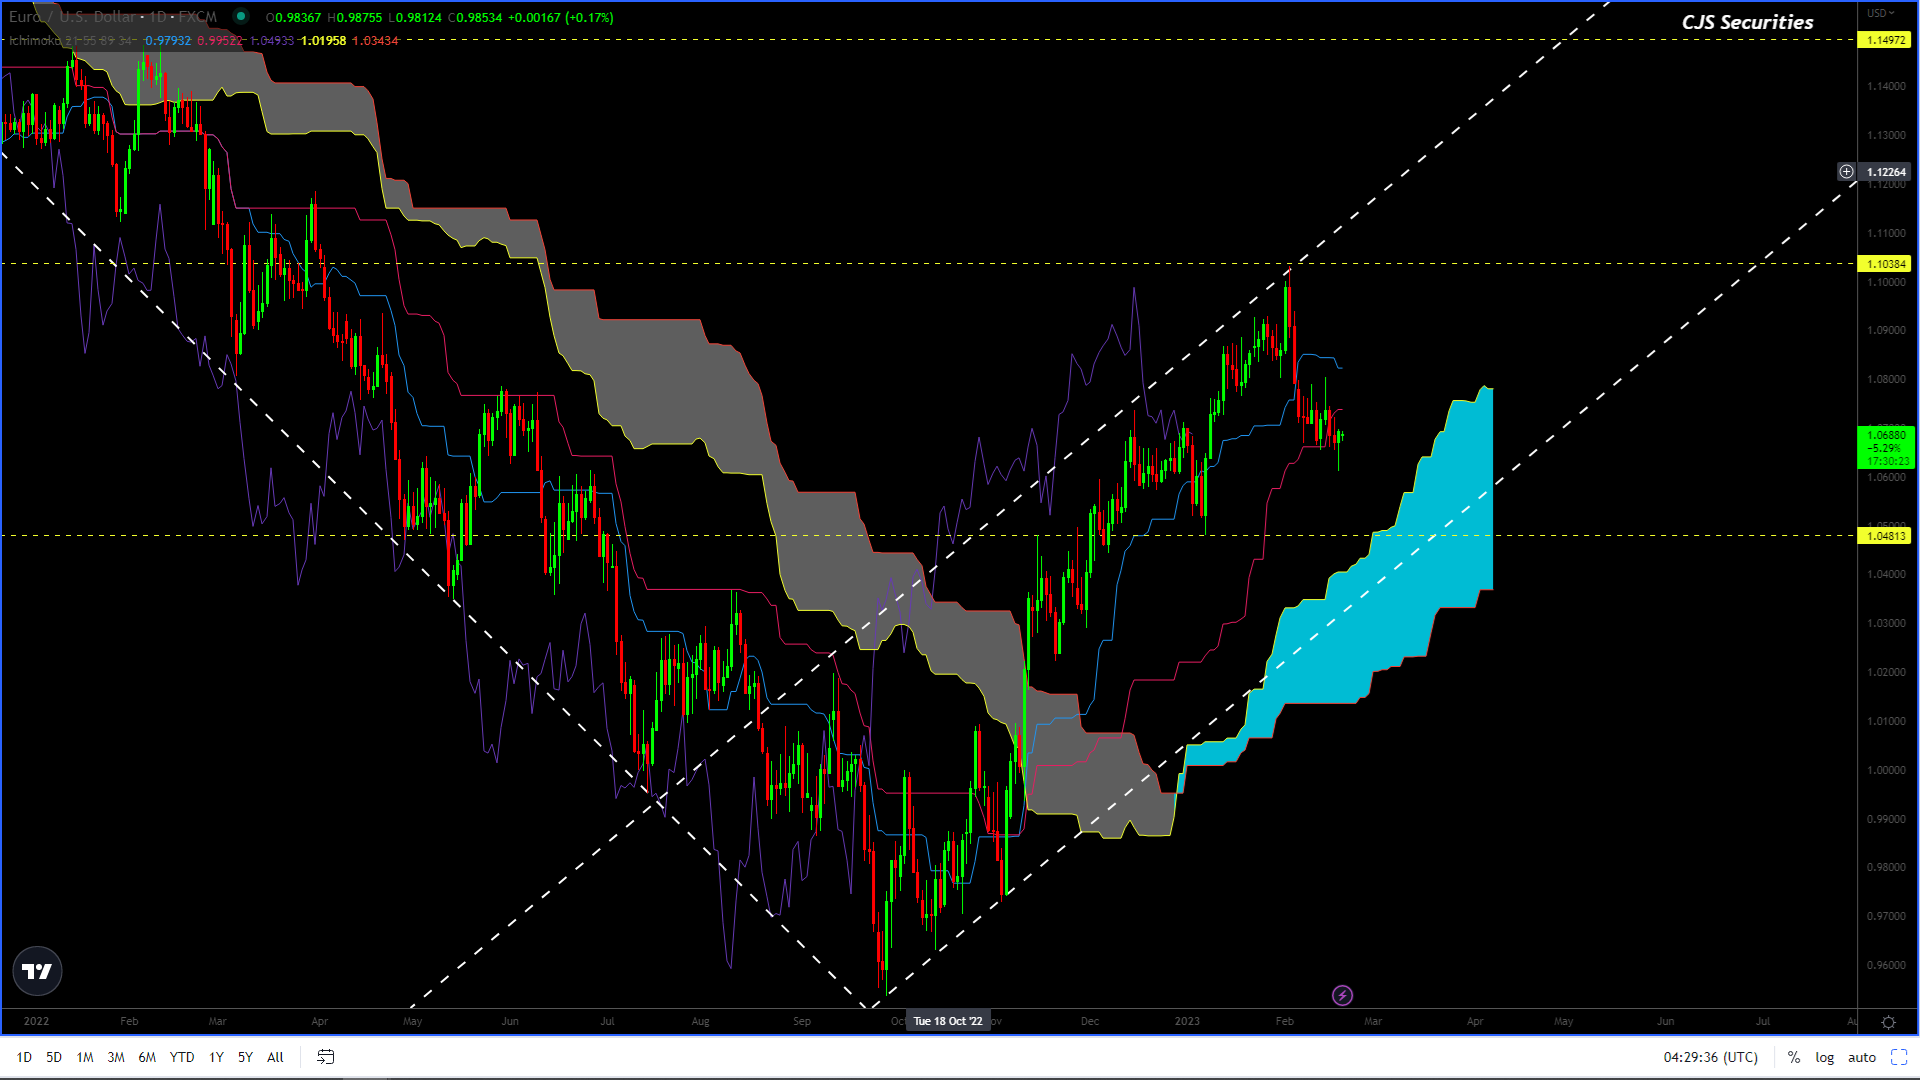
EURO/USD Daily Candle
Ladies and Gentlemen.
I cannot truly explain just how “perfectly” the Euro / Dollar chart is trading.
IMHO, the Dollar is done, at least for the next 24 months and all pullbacks like the one we are experiencing now are Euro-buying opportunities.
My targets over the next 24 months range from $1.15 (which the chart should easily achieve) to $1.25.
This is one of the clearest pictures I have seen in a while and coincides with the DXY chart below.
“Don’t be a hero. Don’t have an ego. Always question yourself and your ability. Don’t feel that you are very good. The second you do, you are dead.” – Paul Tudor Jones
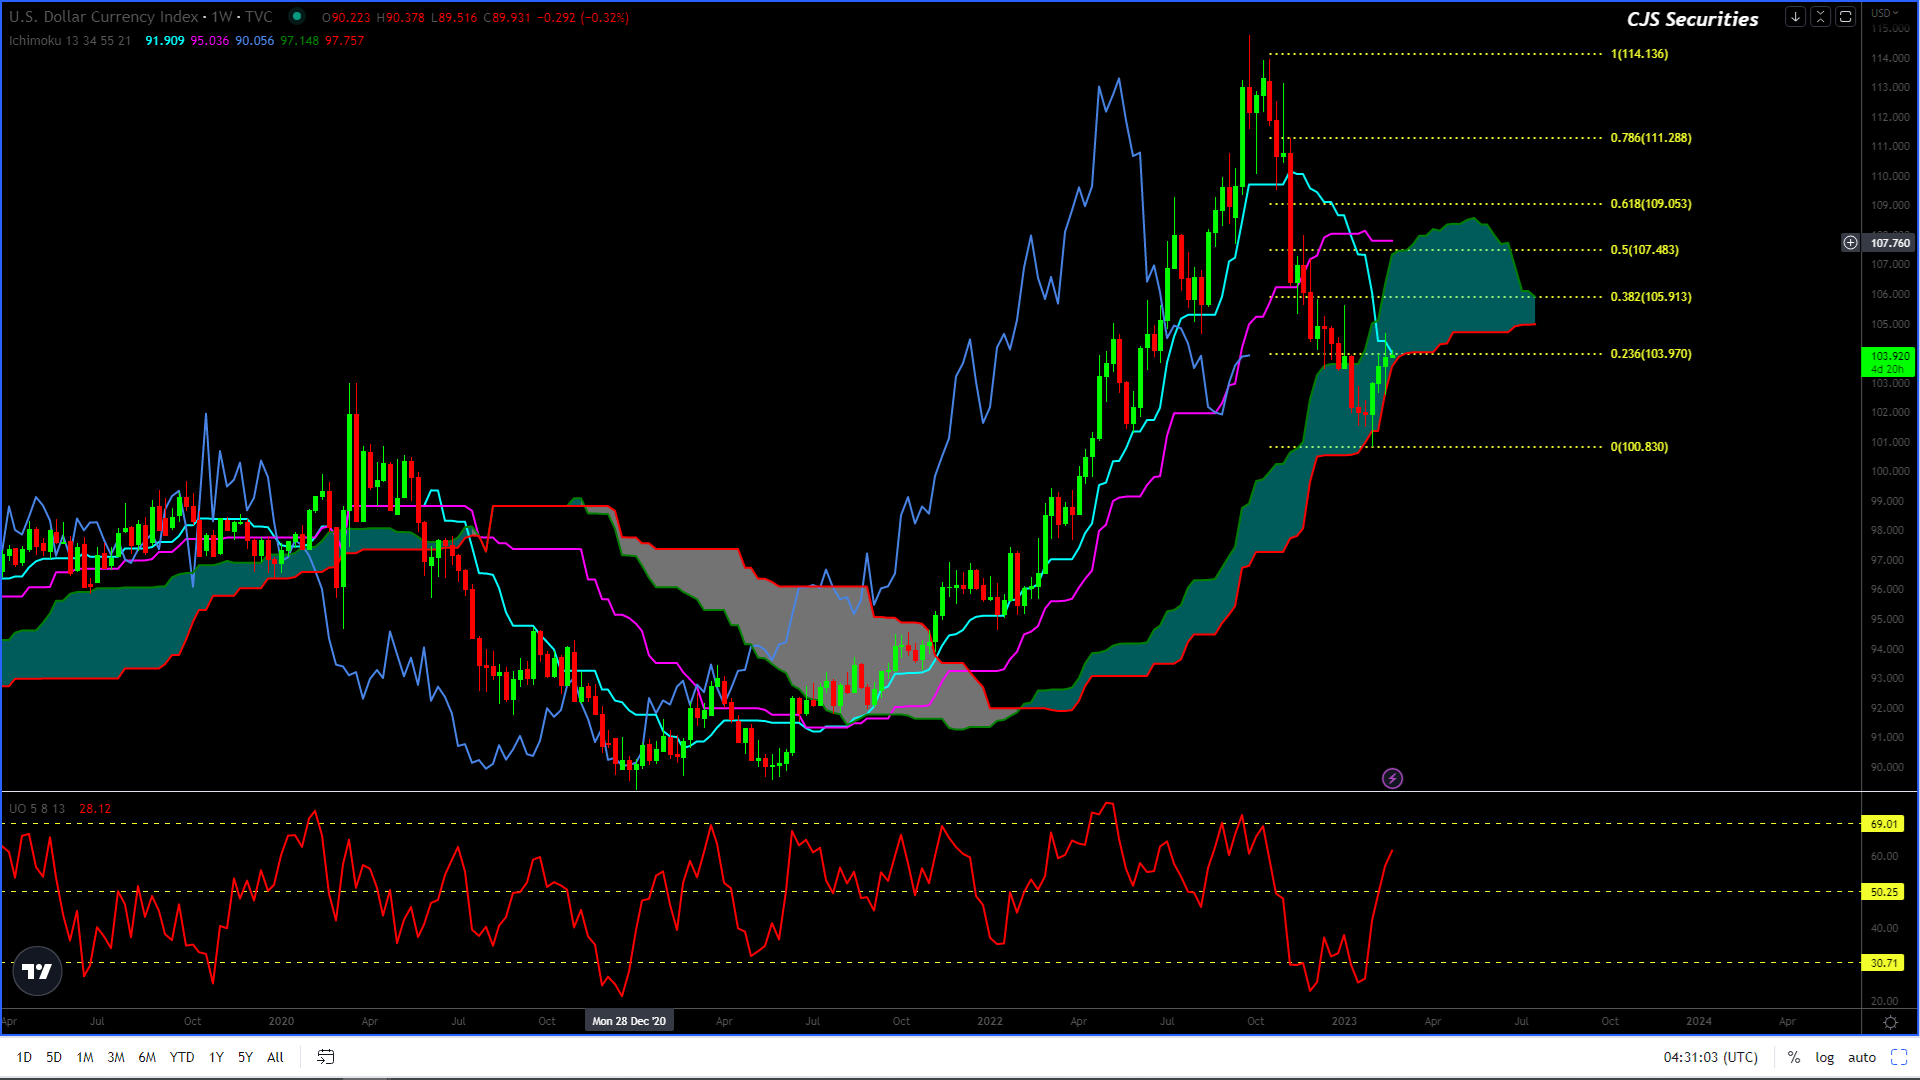
US Dollar Index Weekly Candle
My Friend the DXY
This Weekly Candle / Cloud chart is another chart that paints a pretty picture and dovetails wonderfully with the Euro chart.
Very few people were bearish about this chart over 110, but after printing what IMO is the MT – LT high at 115there is serious scope for this chart to trade back to the low 90’s.
I Am looking for this chart to make between a 38.2% – 50% pullback before heading lower.
This will also see the chart test the top of the cloud.
In Technical analysis terms this chart along with the Euro chart is trading amazingly, let us all hope it holds!