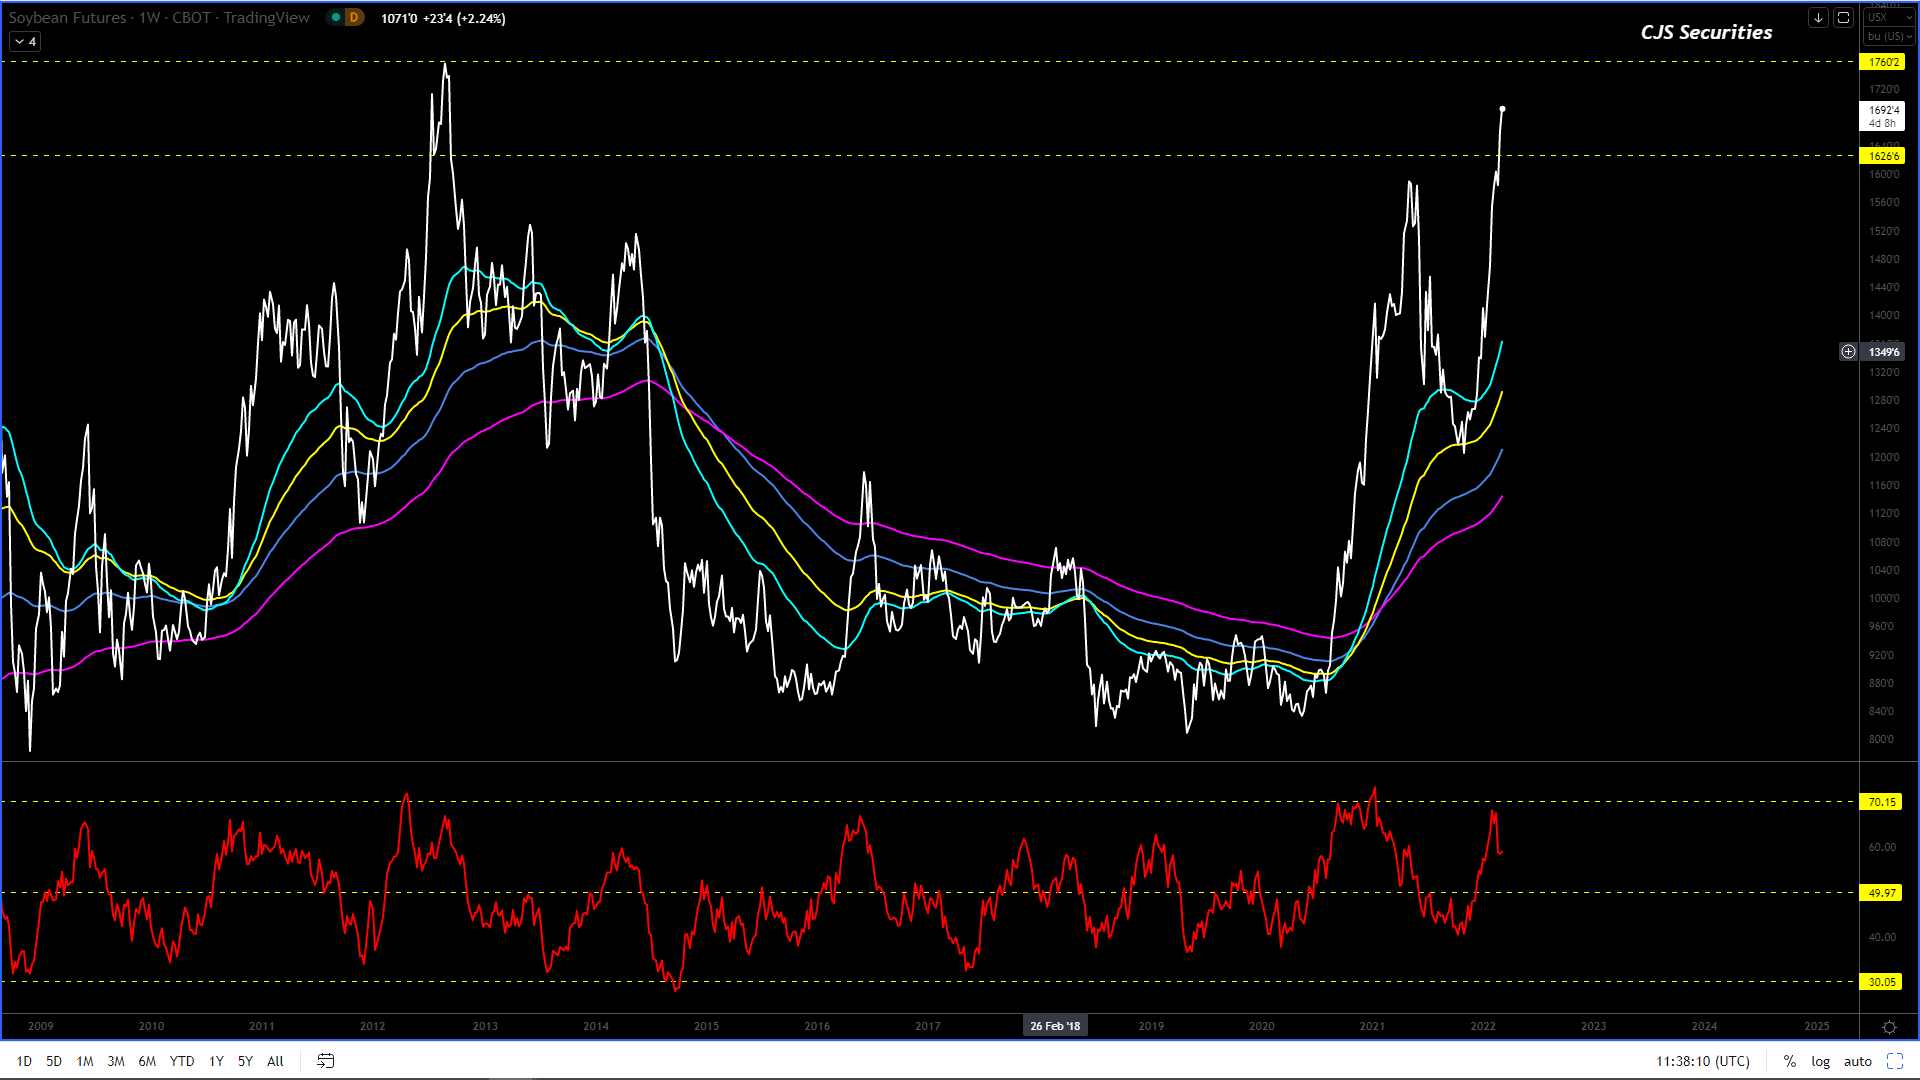
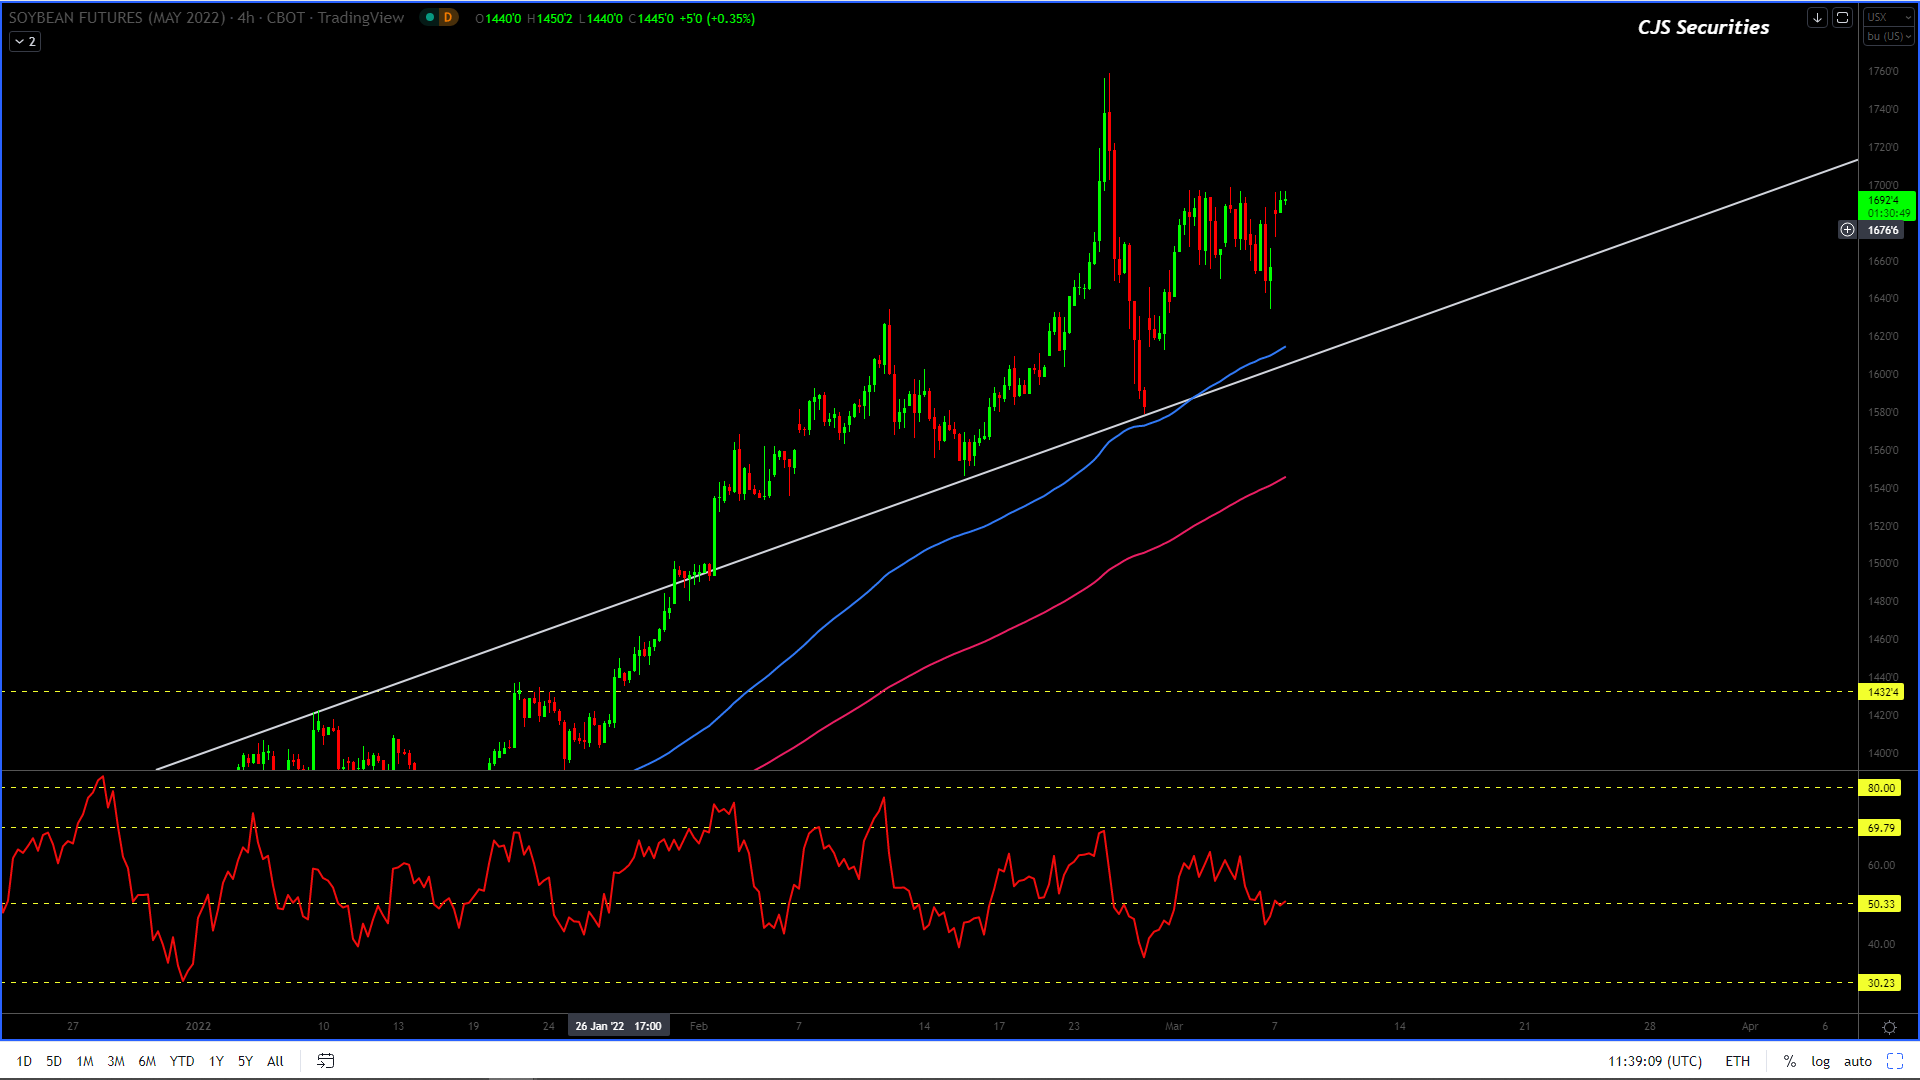
This chart needs a decent correction before it can rally much more.
If we are busy correcting in a greater bull market then we could be headed down toward the $15.25 as a target.
Although we are in the throws of a raging bull market I will be patiently waiting to get long as sometimes these pullbacks go deeper than most anticipate.
240 Min CBOT May 22 Soybean Candle Chart
#No Change in Commentary
The 240 min chart is clearly busy making a correction.
This correction could trade as low as $15.40 in the coming weeks.
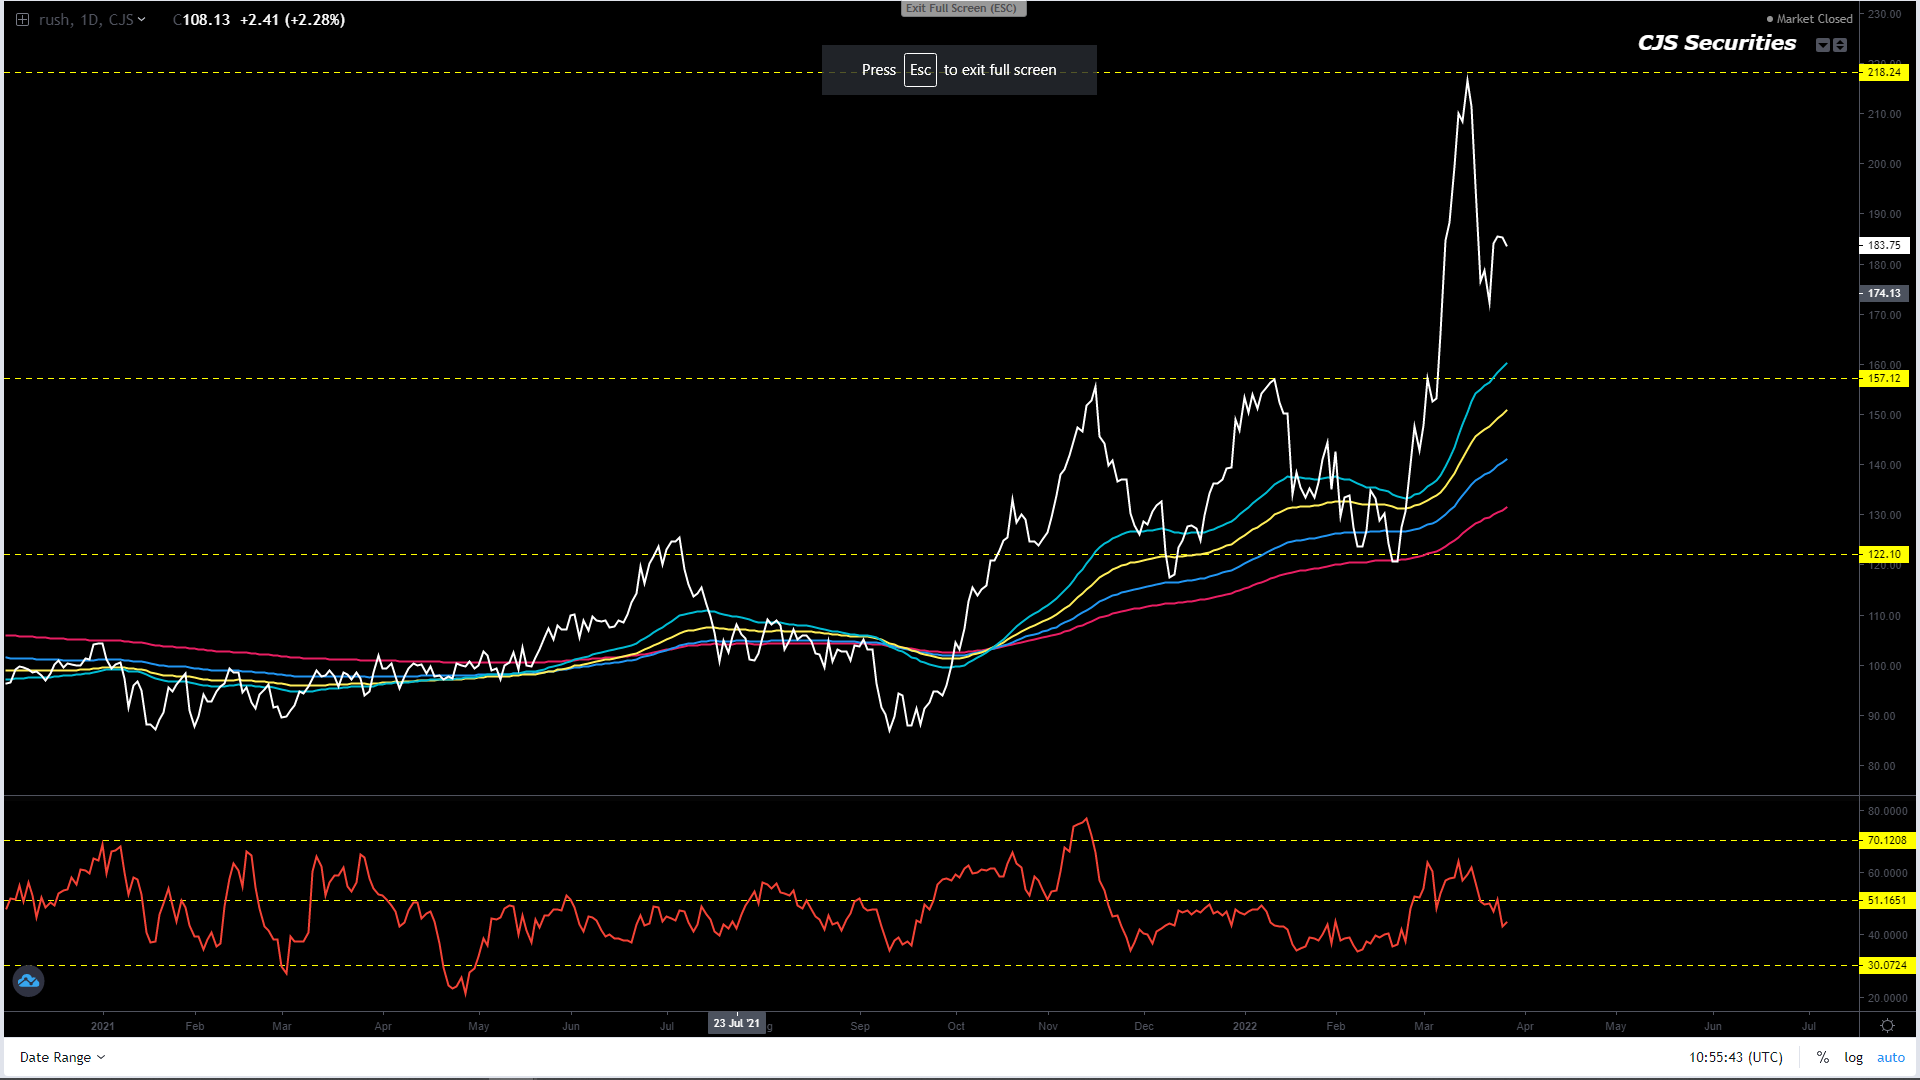
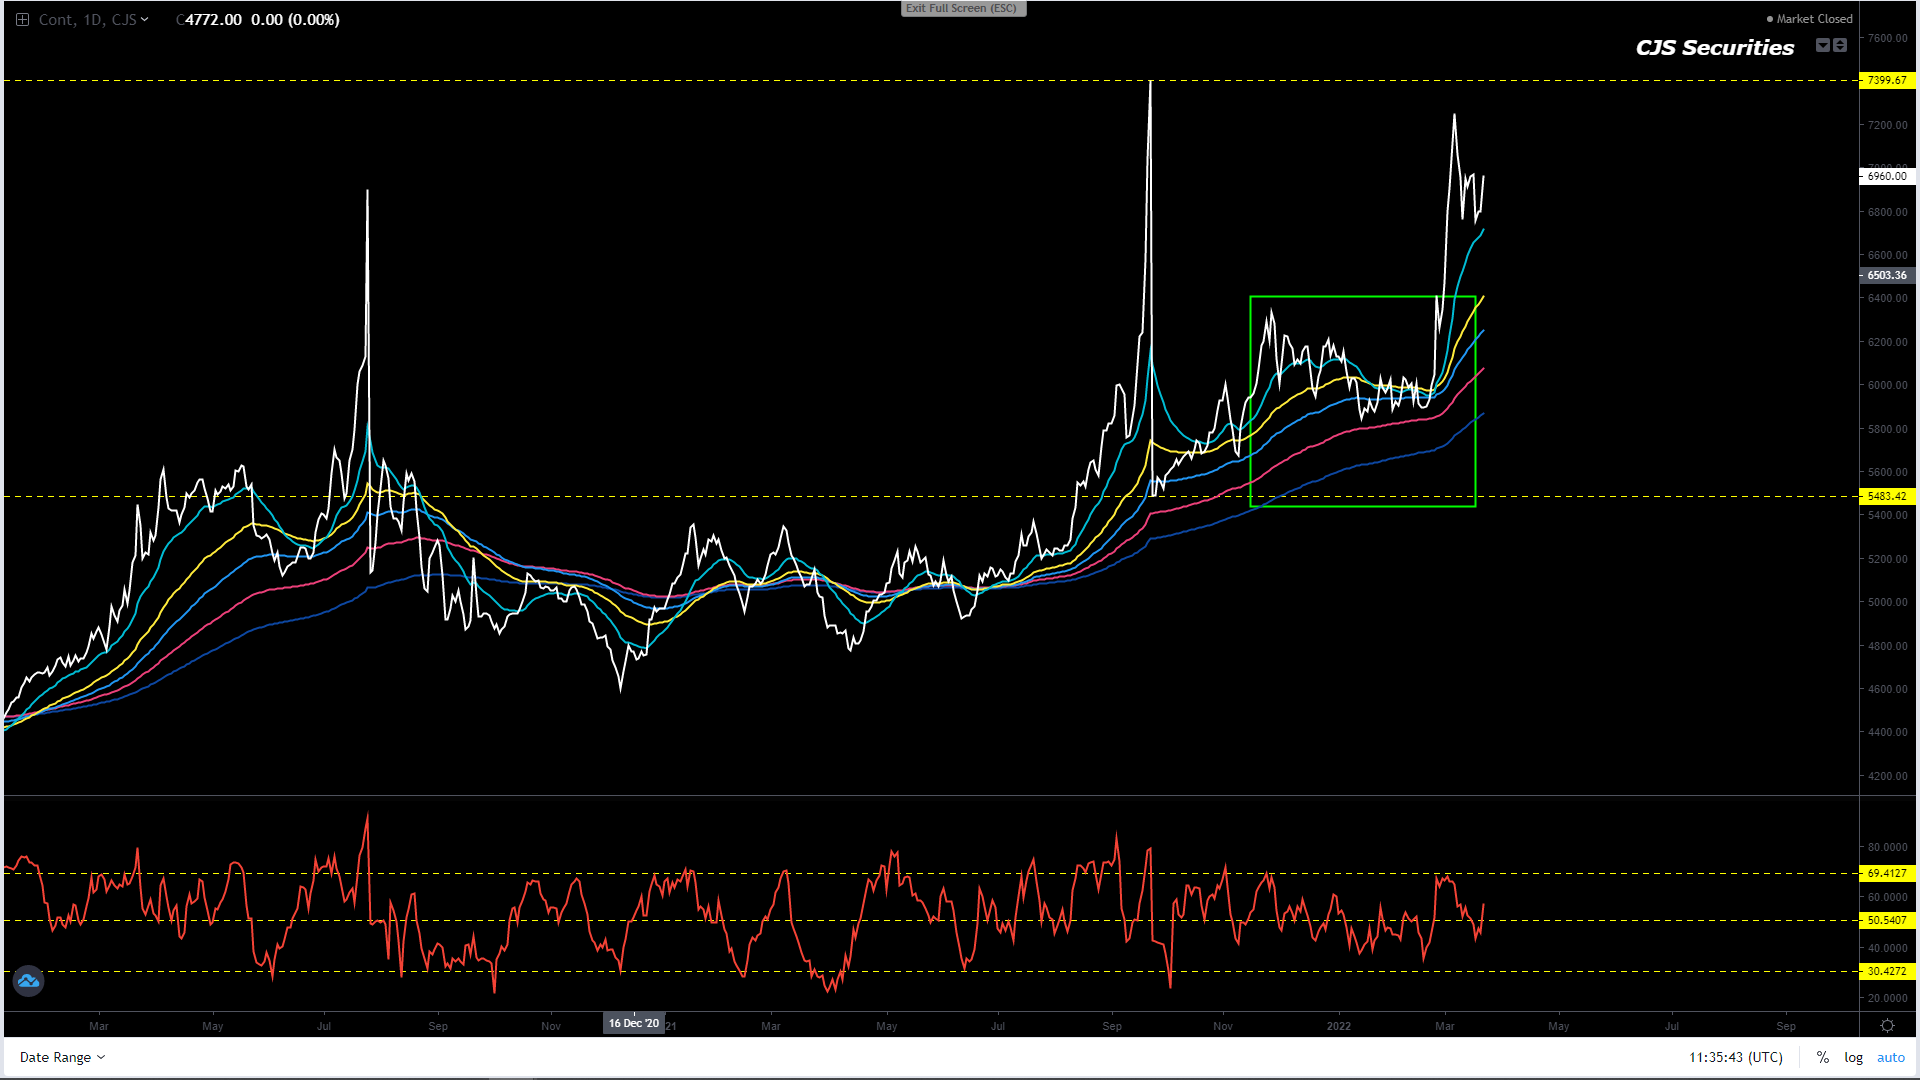
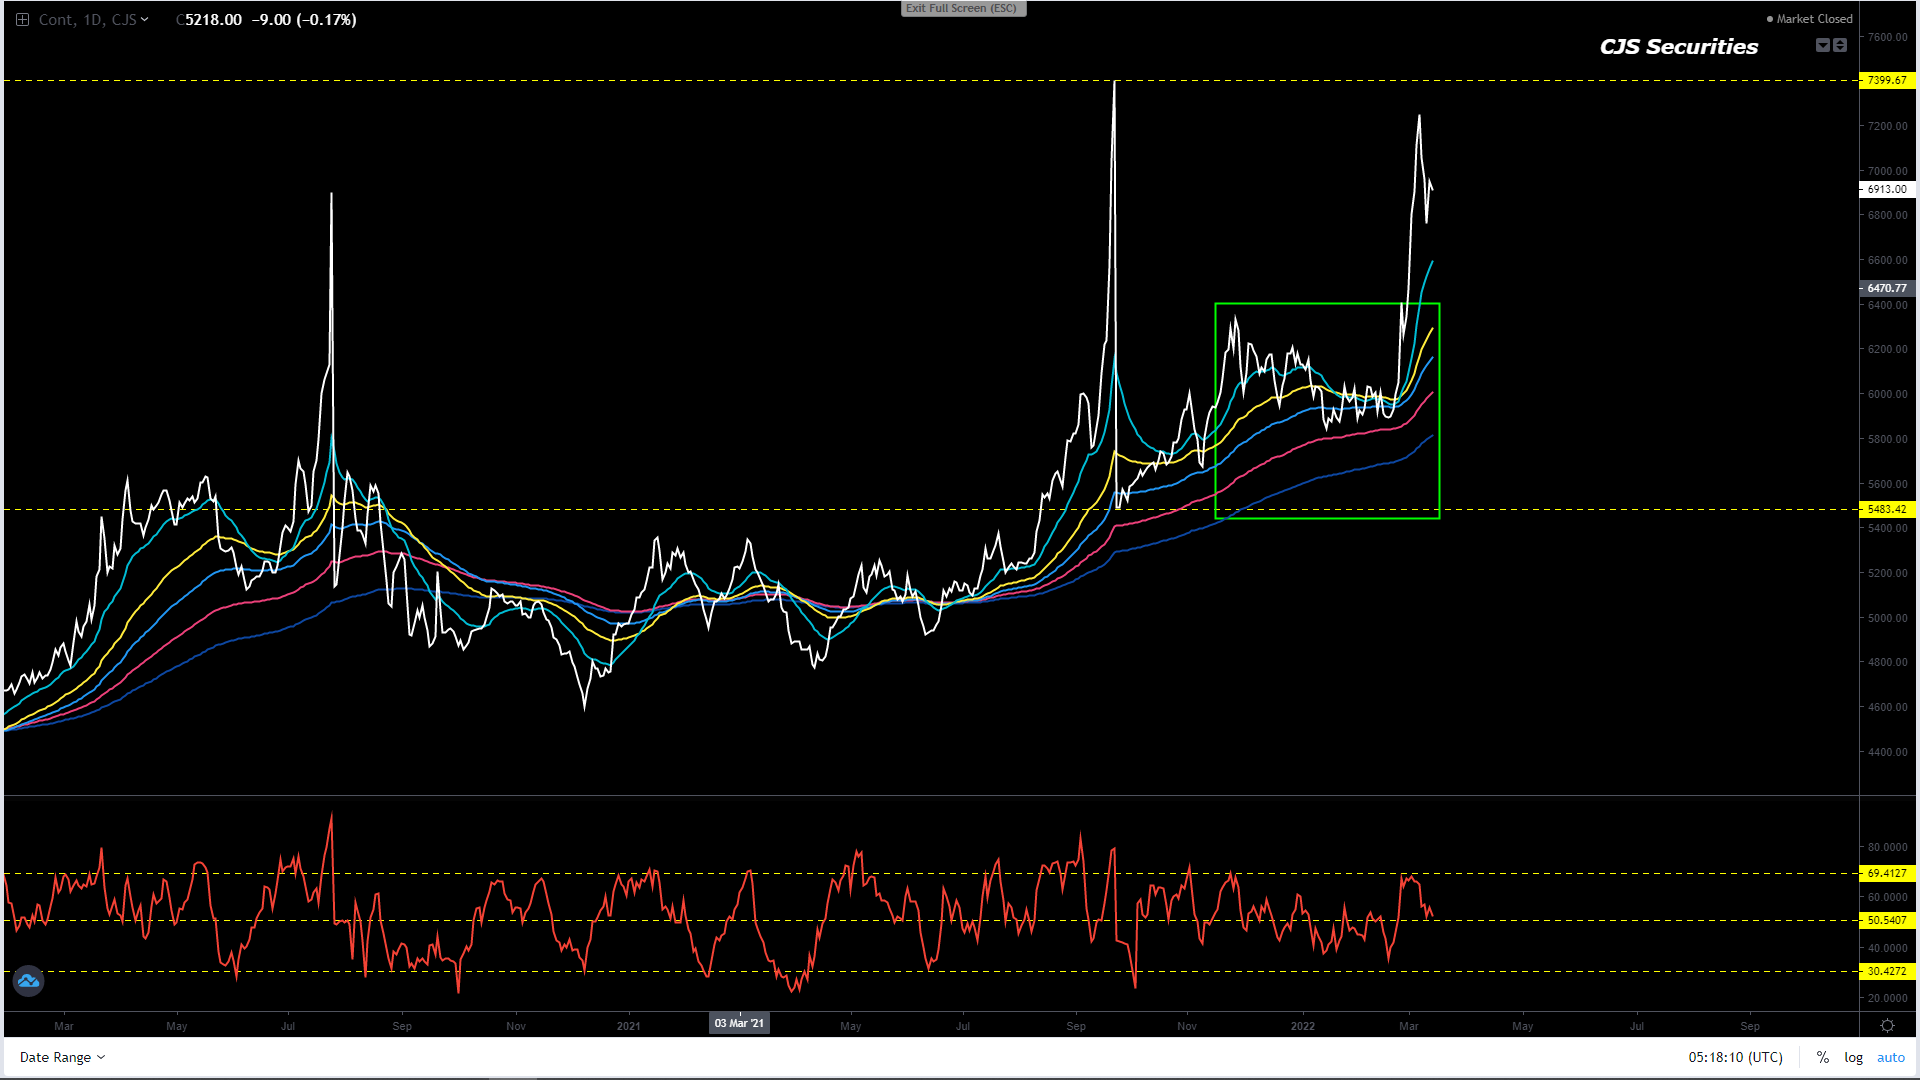
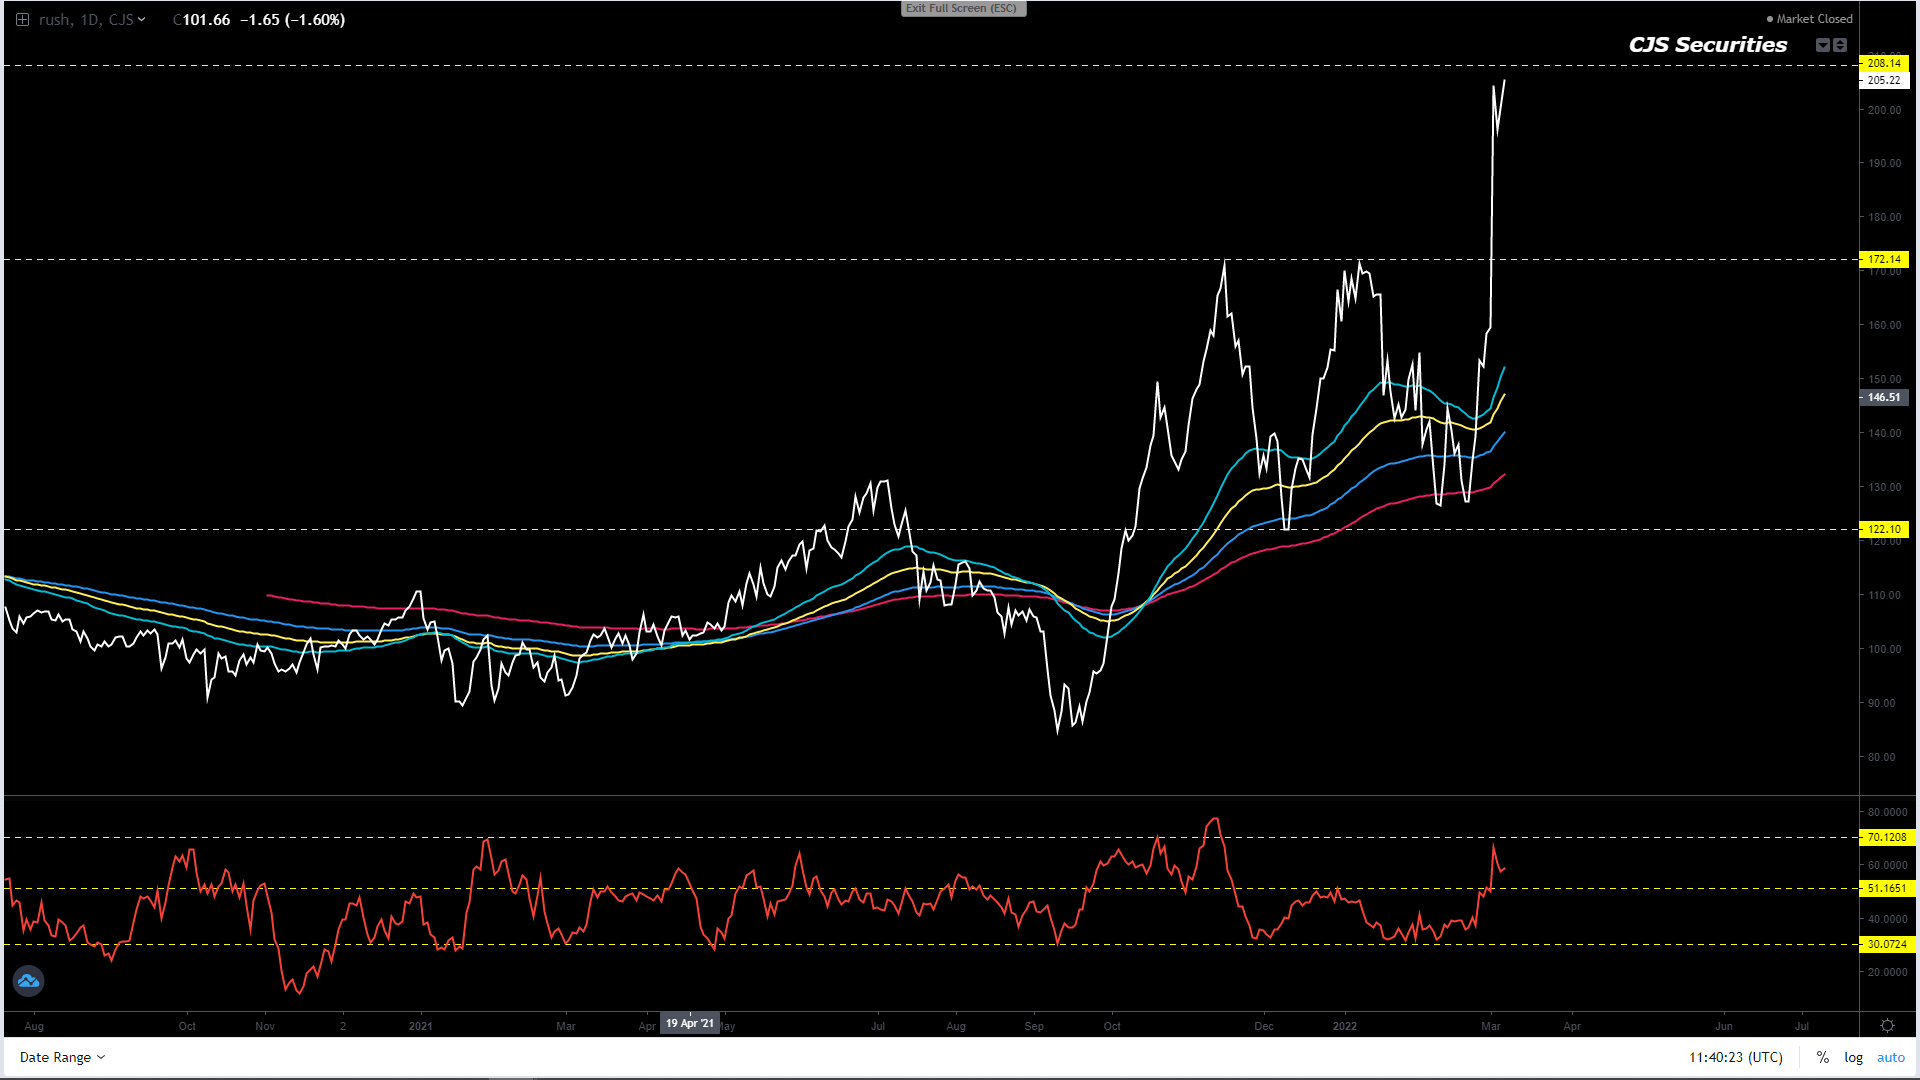
Board Crush Continuous Daily Close
There is nothing much to do here as I am confused as to what I see.
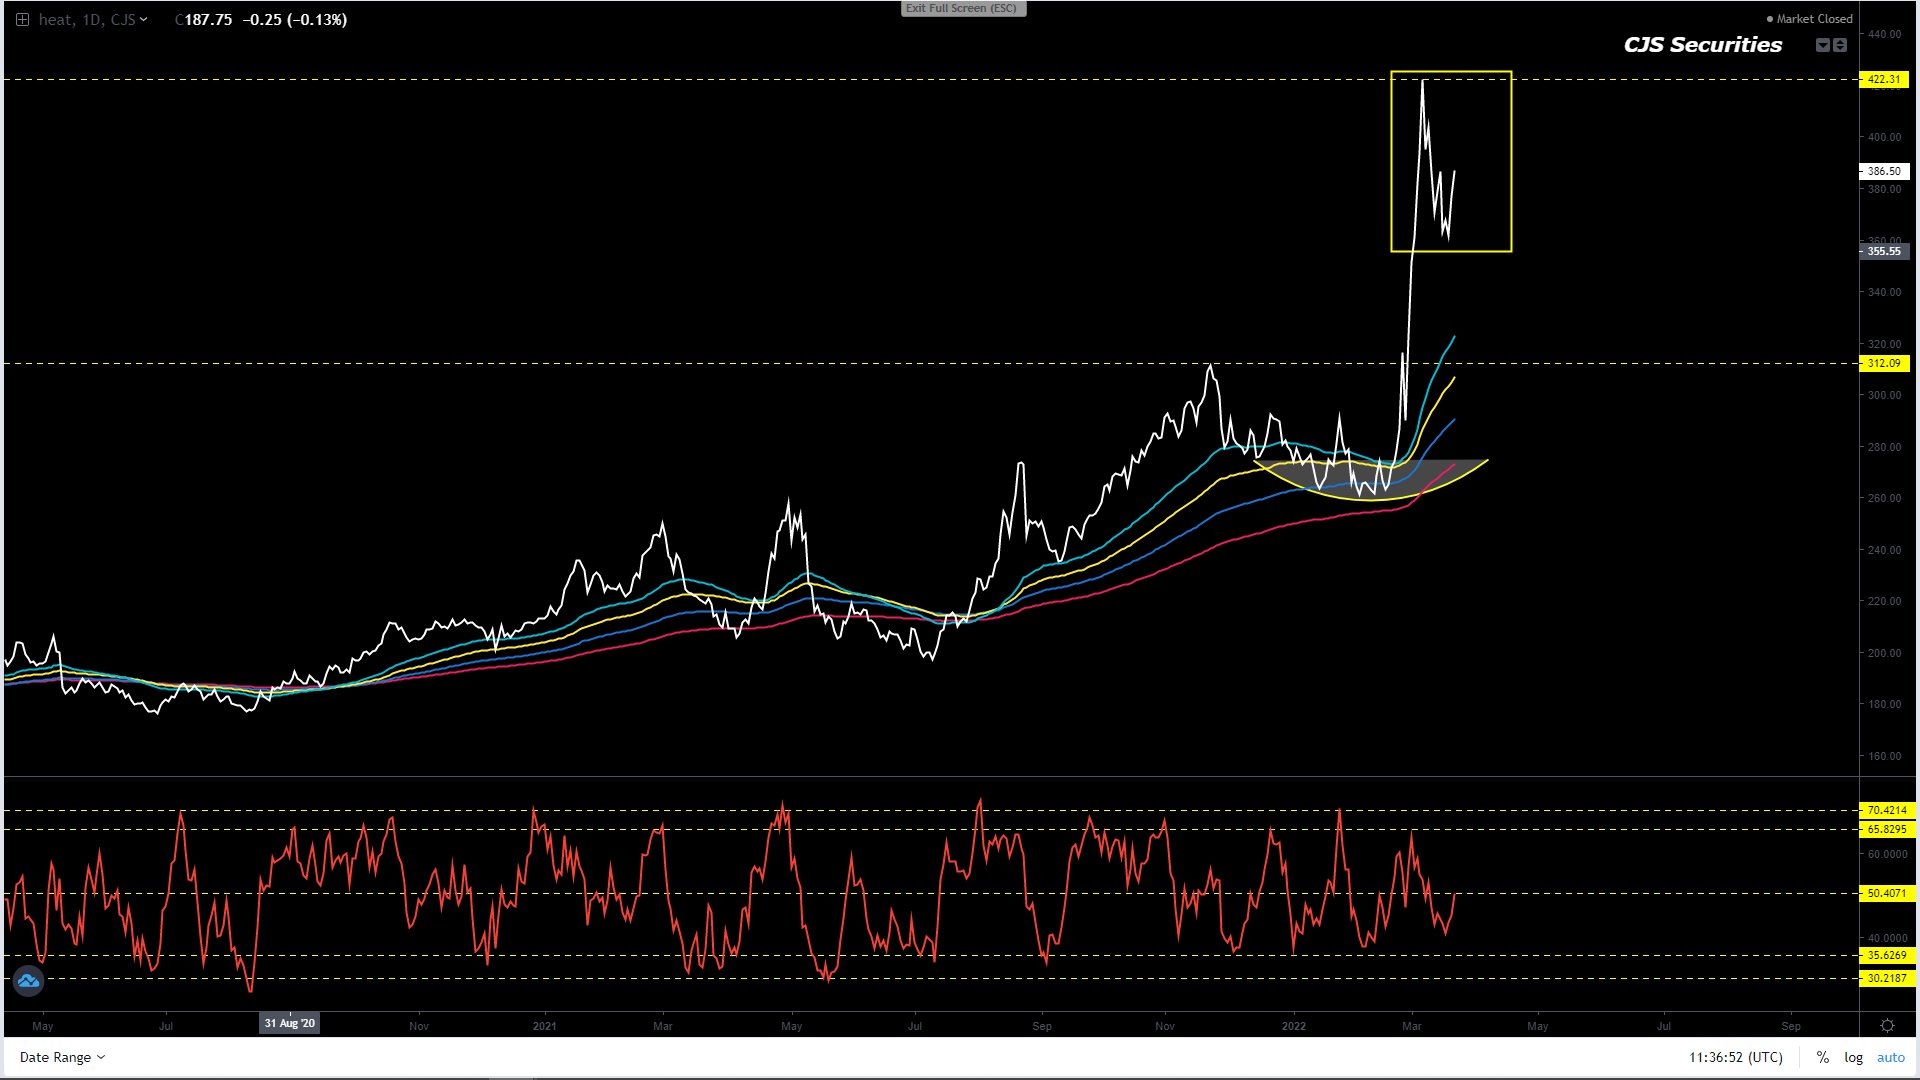
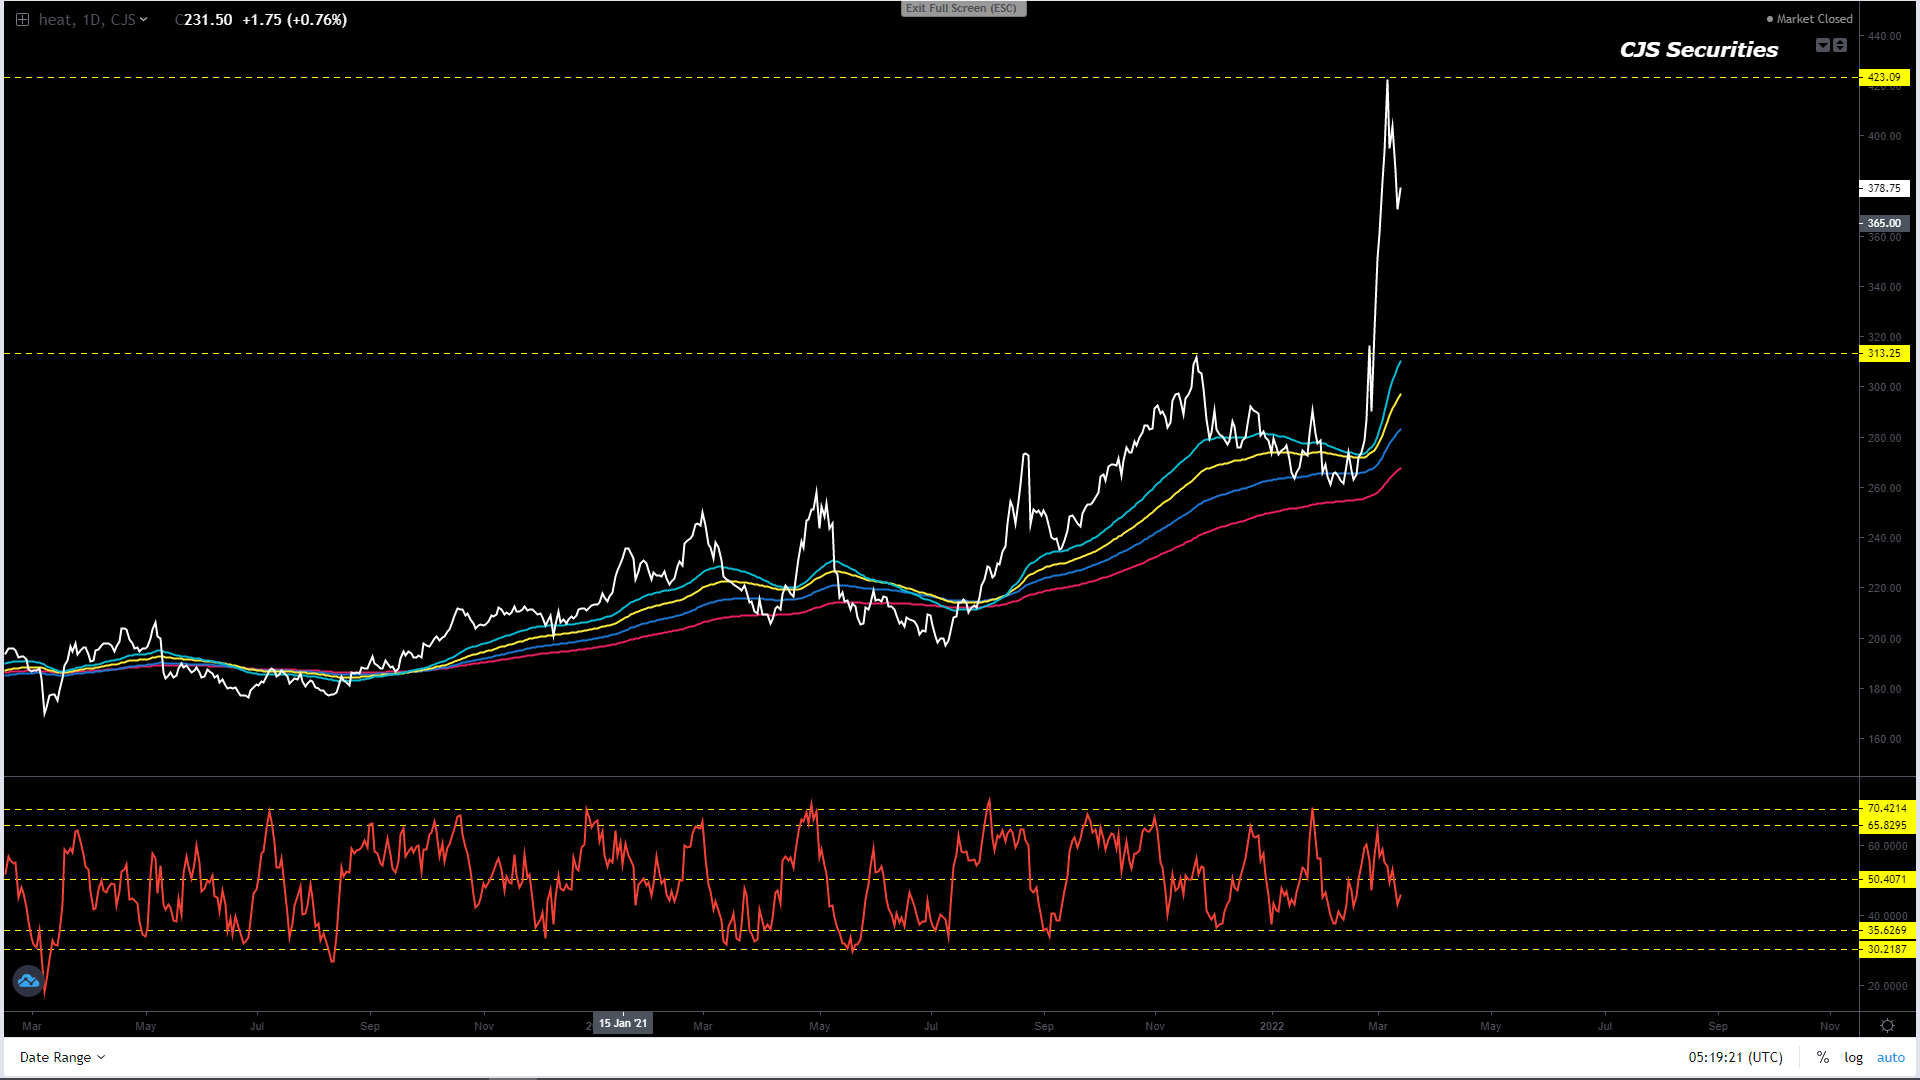
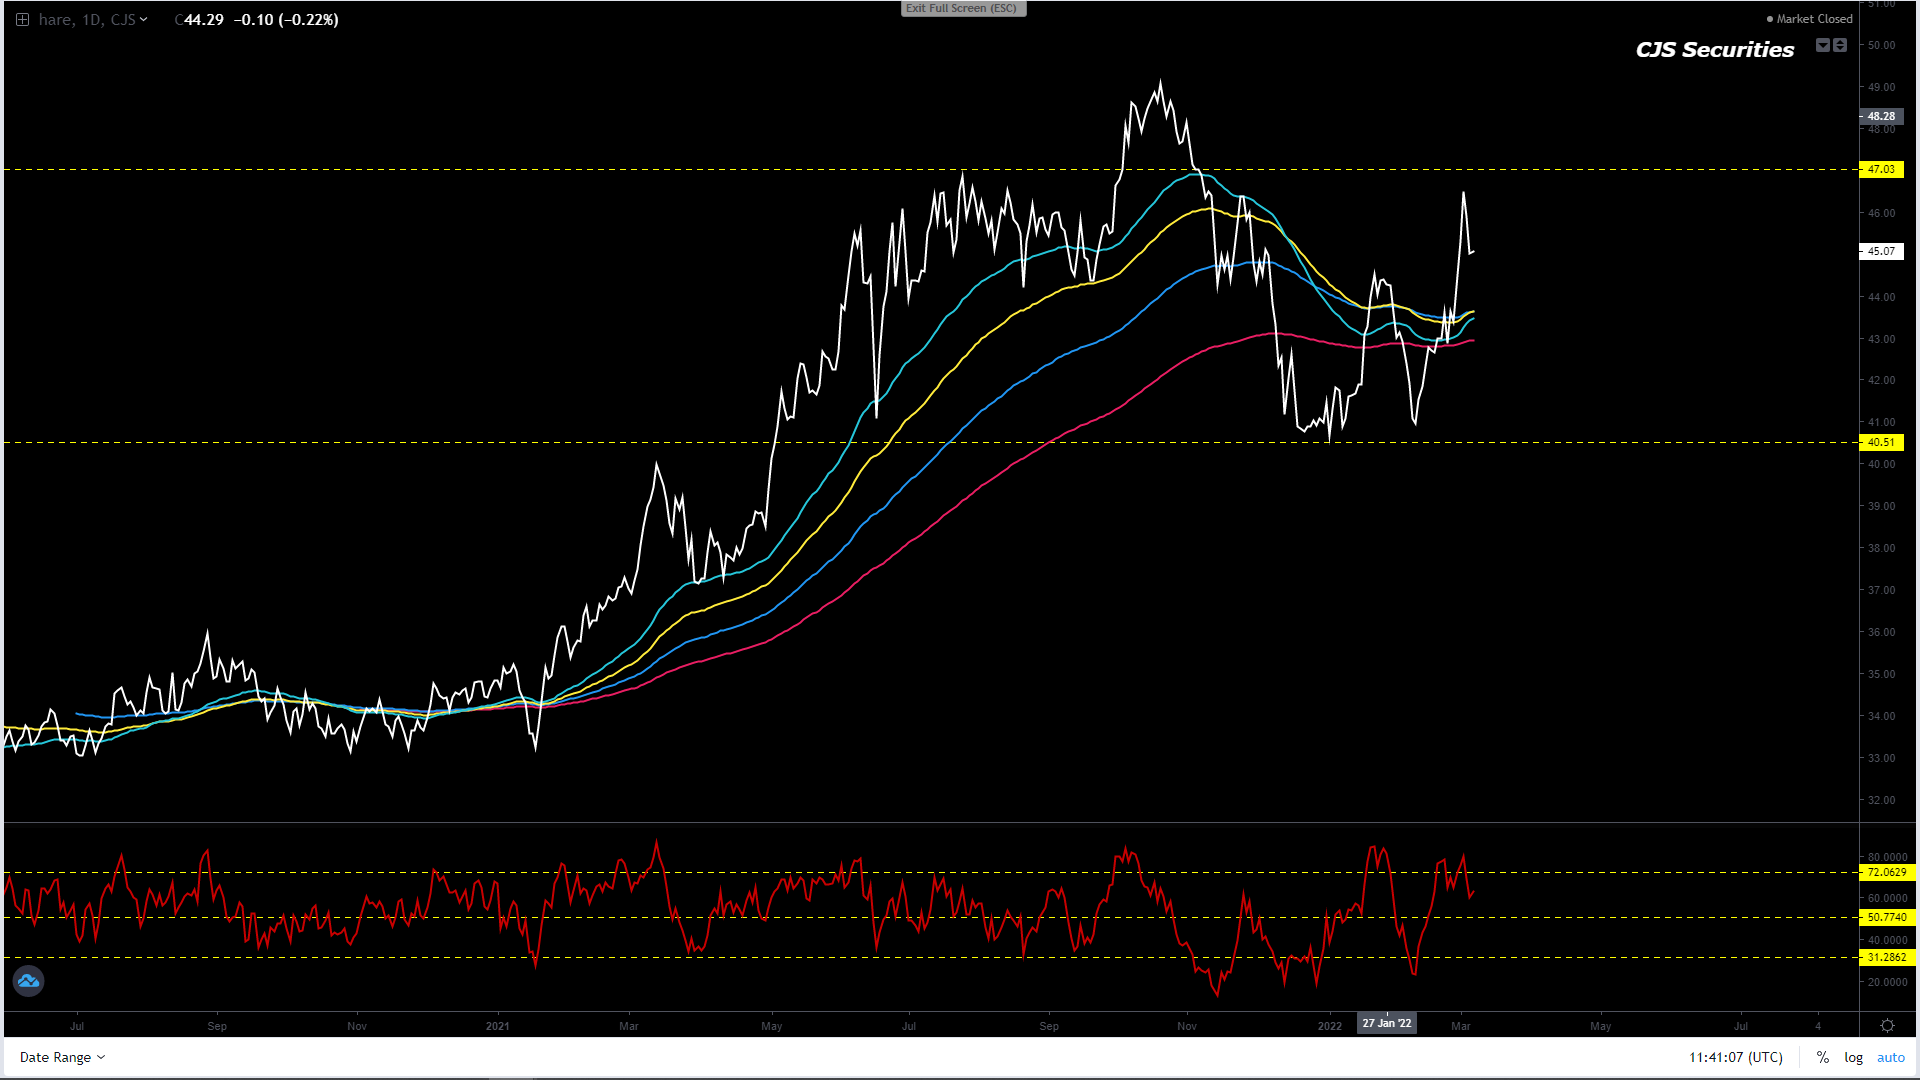
Oil Share Continuous Daily Close
We are now happy to sit and wait to buy in the coming weeks.
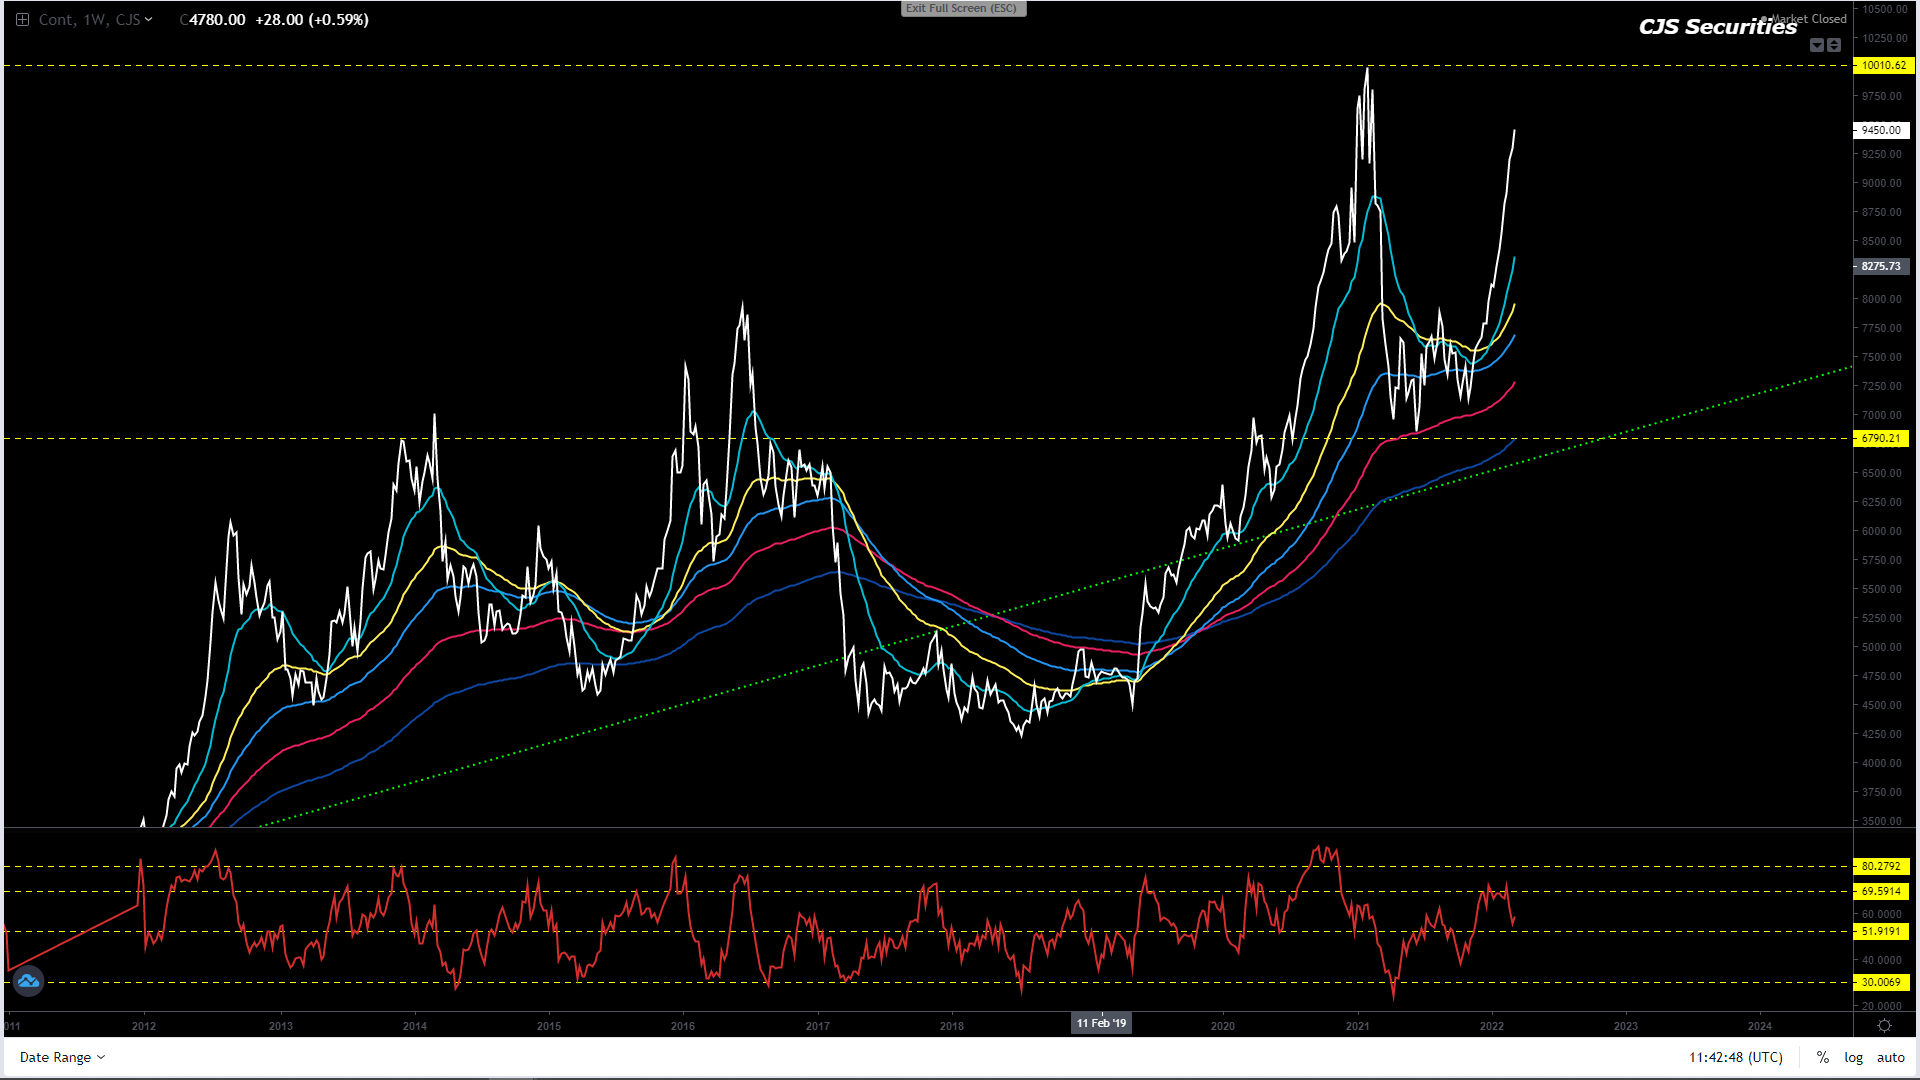
Weekly SAF Soy Continuous Close
There is no reason to sell this chart!
Now is the time to sit back and wait for the next buying opportunity.
Weekly SAF Suns Continuous Close
Technically this chart is as ugly as sin and we will happily sit out for another few weeks.
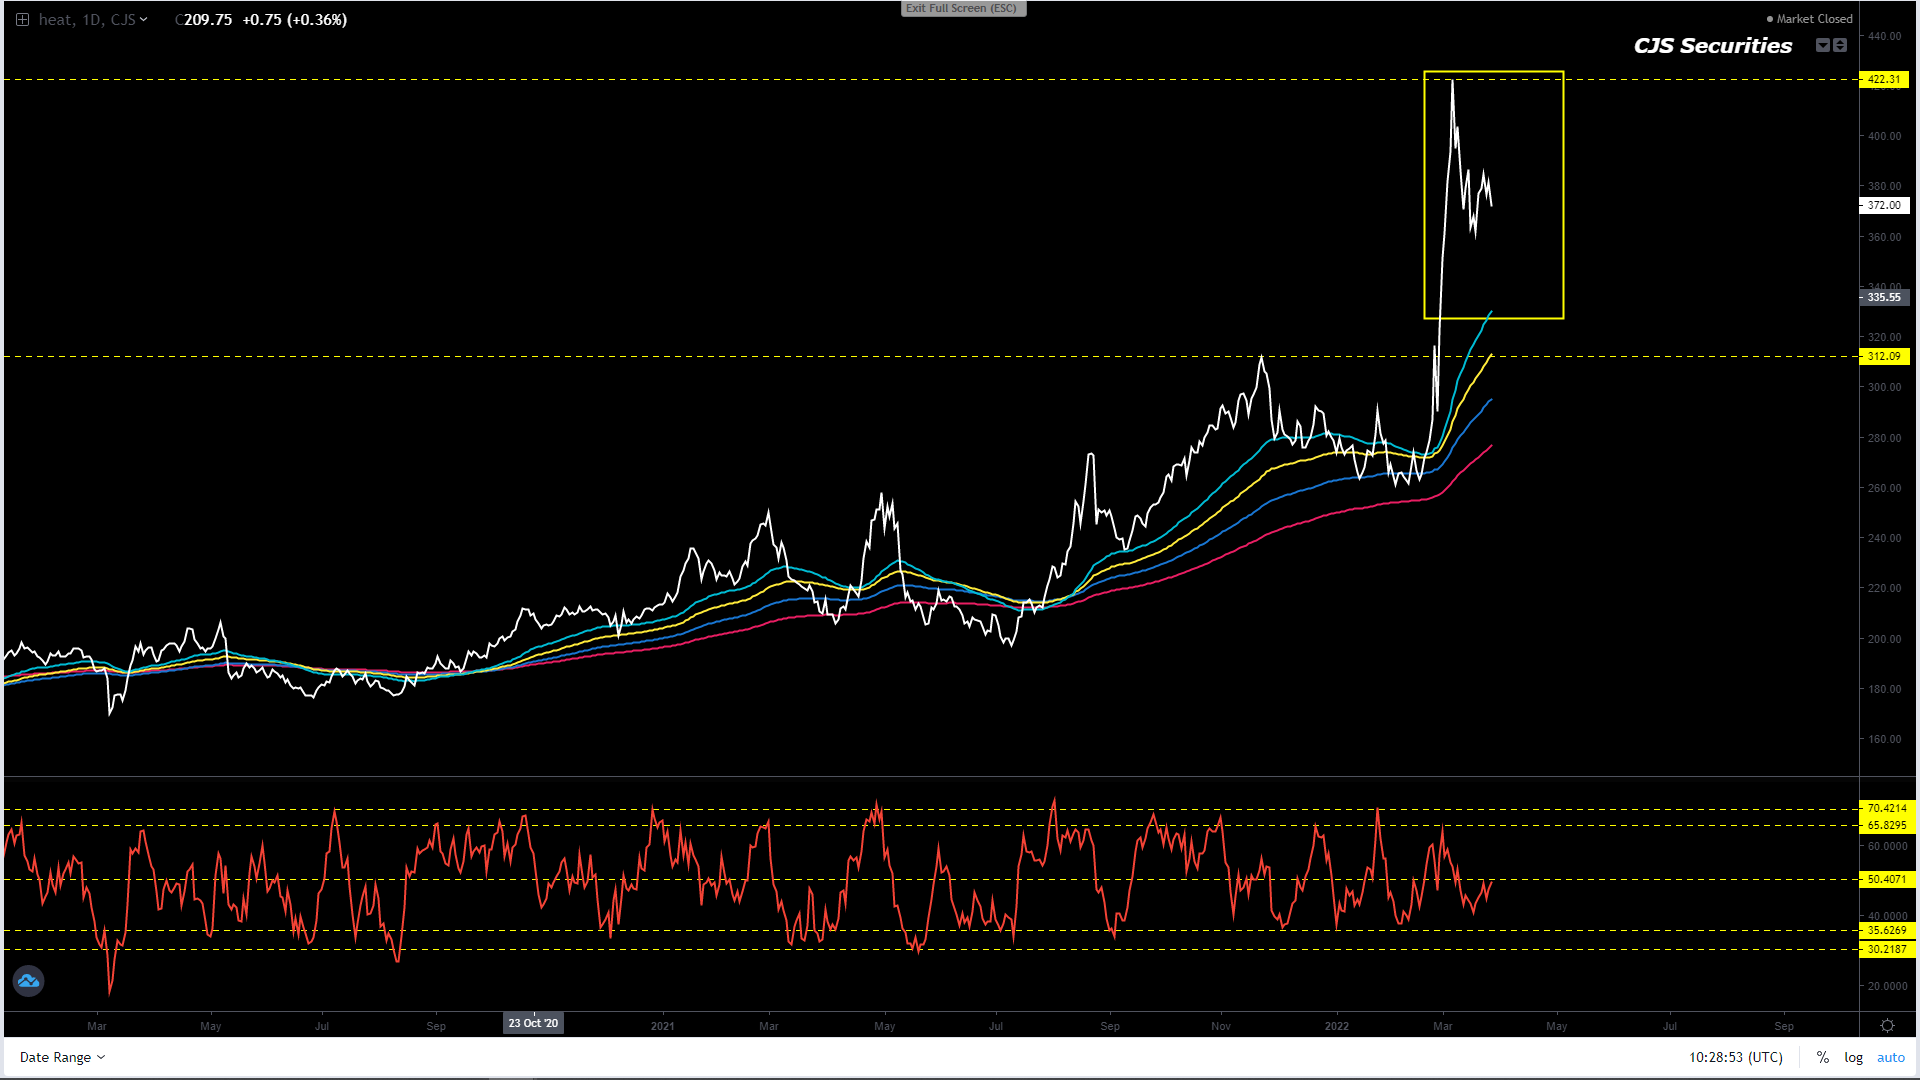
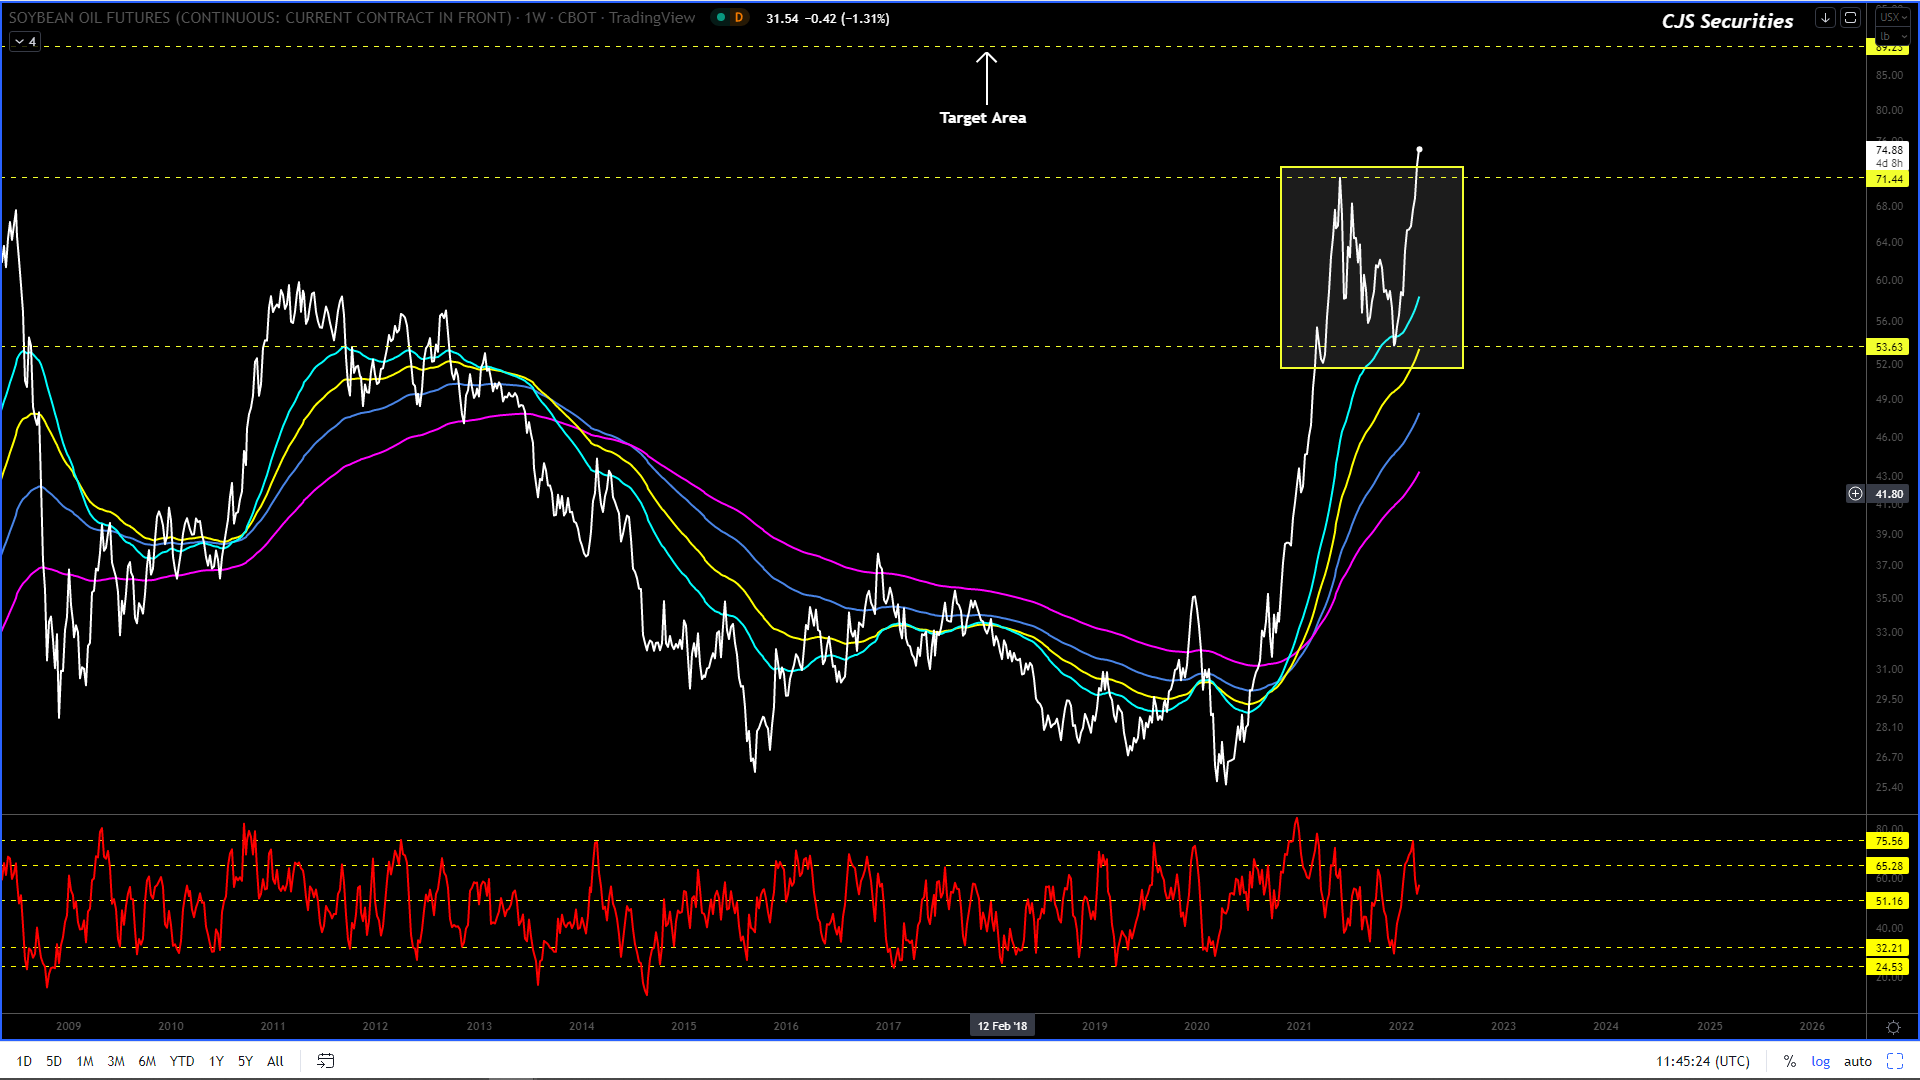
Weekly CBOT Soy Oil Continuous Close
I feel that the time has come to consolidate and wait for a pullback to get long again.
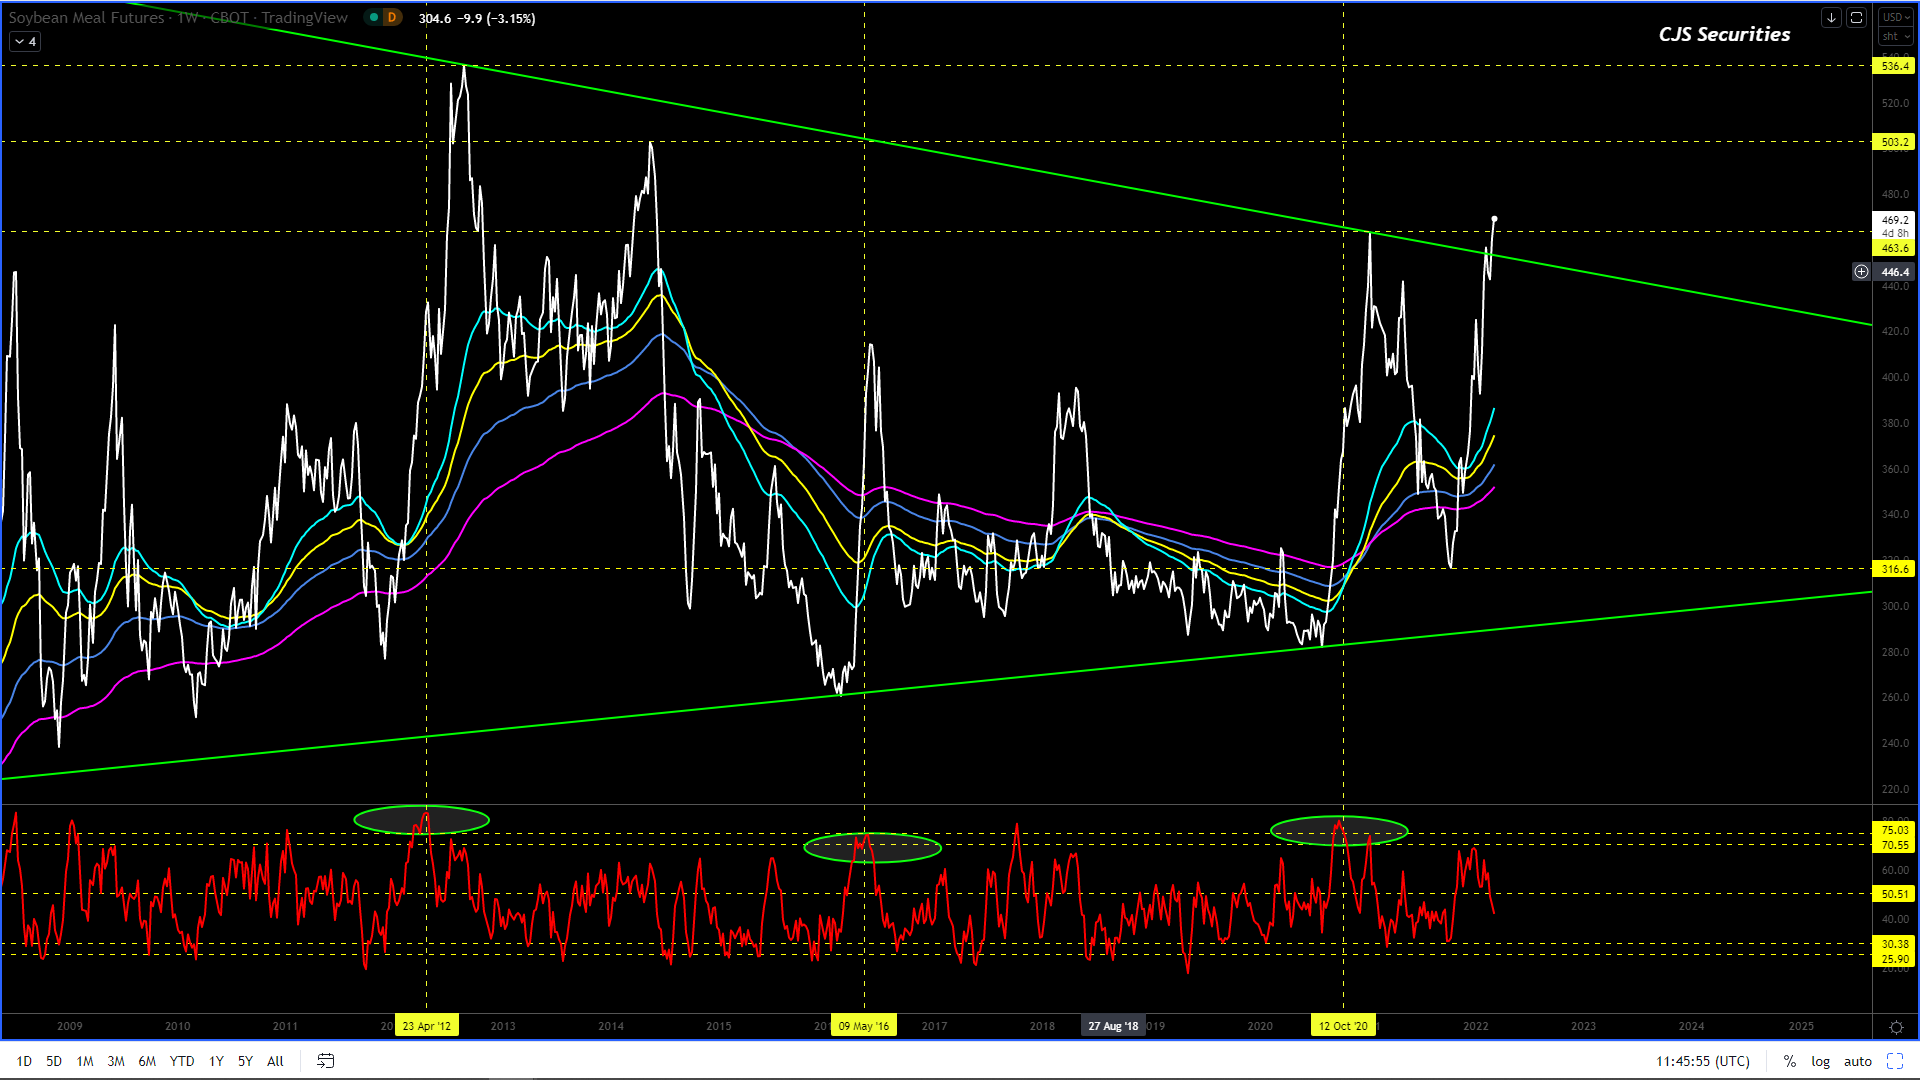
Weekly CBOT SBM Continuous Close
Nothing
has changed on the weekly chart, but we are happy to stay out until further
notice.
This
chart, however, could continue to rally from here!
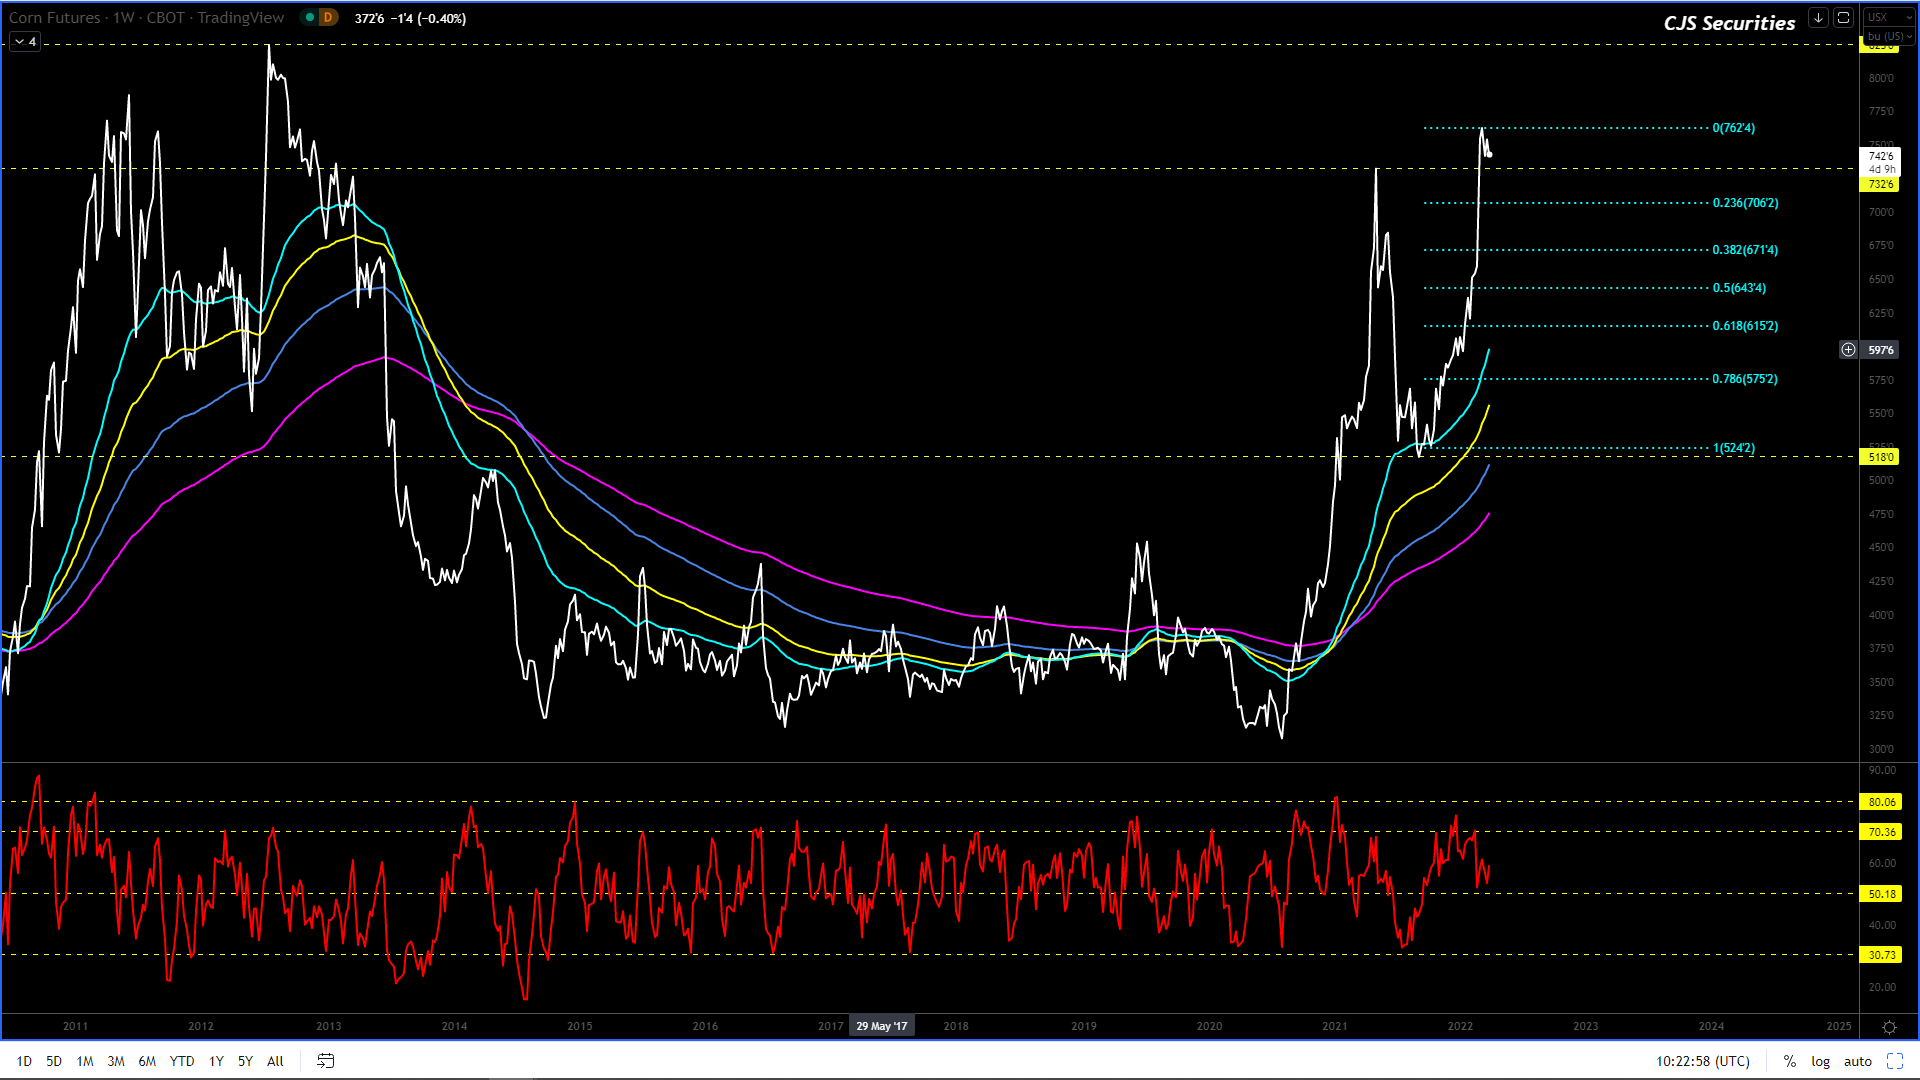
As a whole this chart needs a decent correction after a rally of epic proportion. – looks like so far we are correcting after failing to make new highs.
I am looking for this chart to pull back to around the $6.72 level in the coming weeks.
This is in no way a bear market, but rather a correction in a greater bull market.
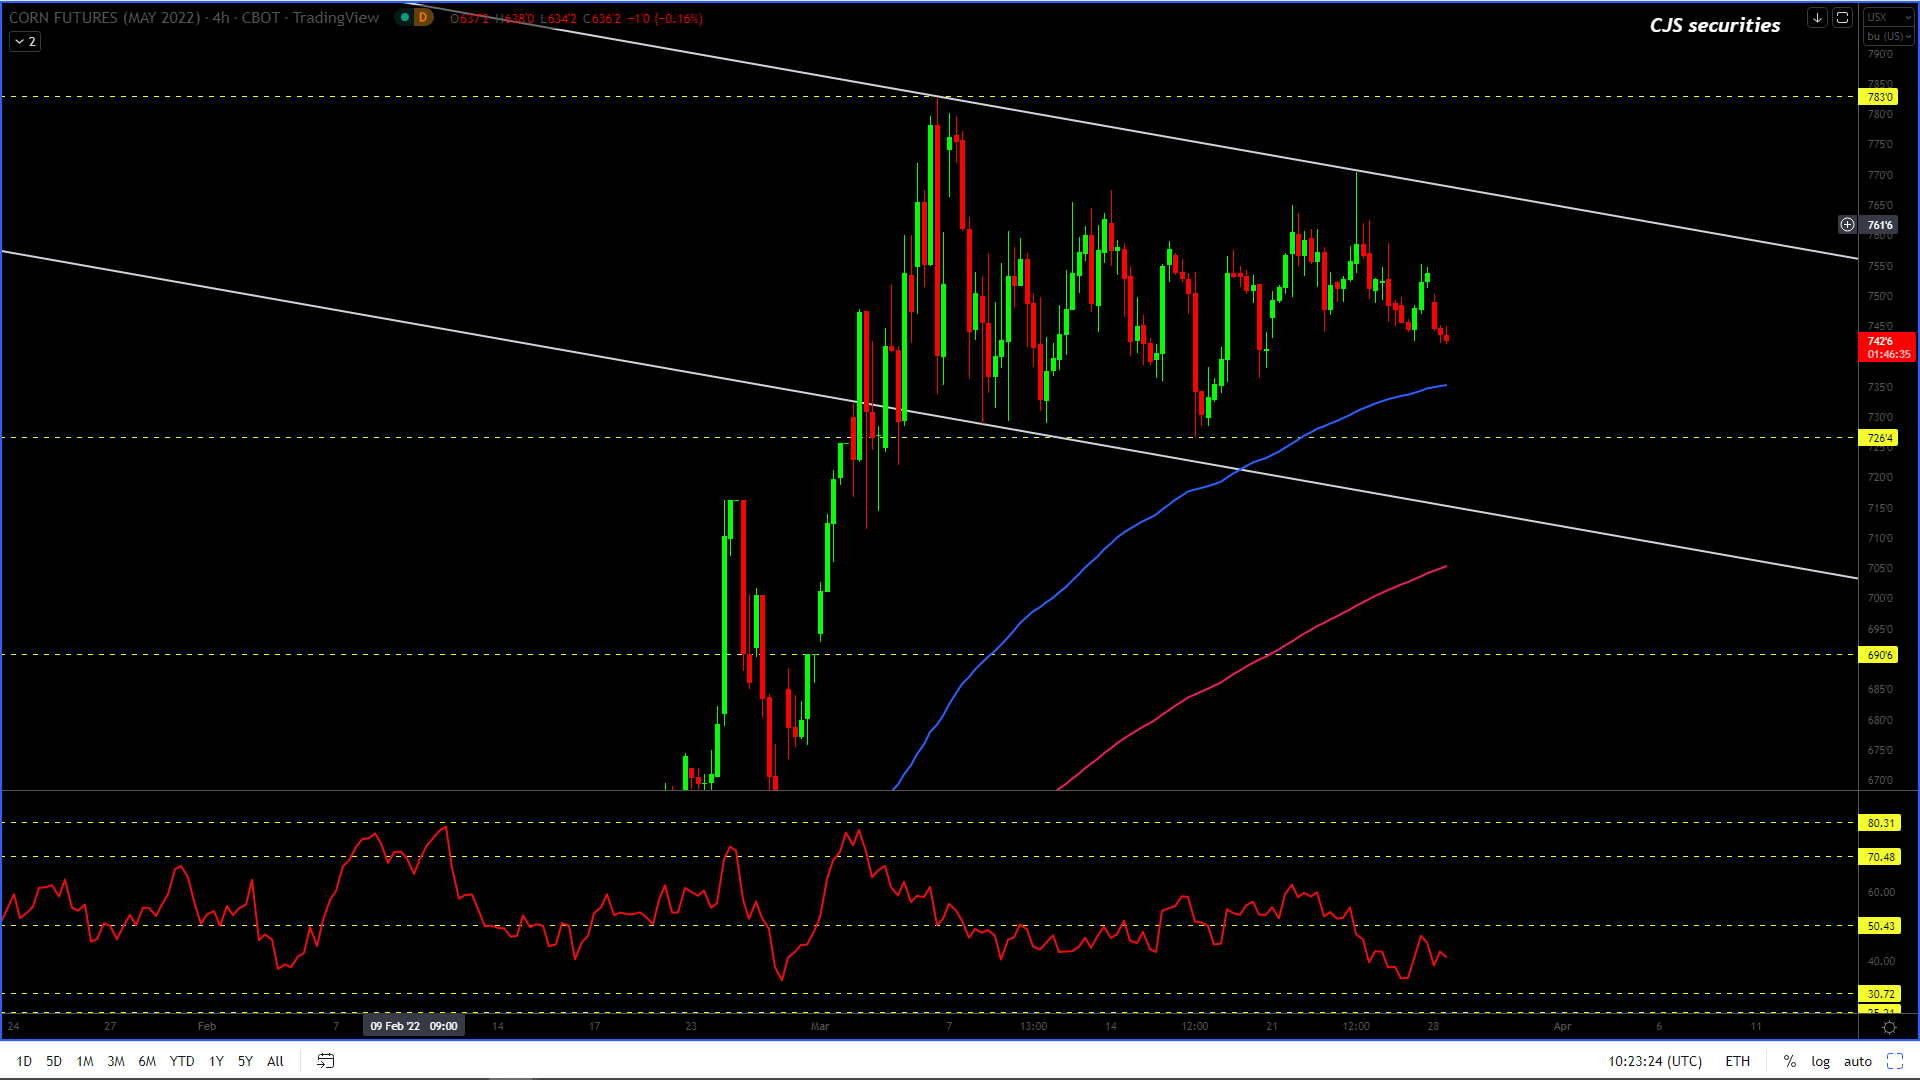
240 Min May22 Corn Candle Chart Close
The 240 min chart indicates a correction for now and I fancy downside targets of between $7.16 -$7.05.
I would be very wary of all these markets as a peace deal even if only a short term deal, will lead to a sentiment change. – They are meeting again on Wednesday!
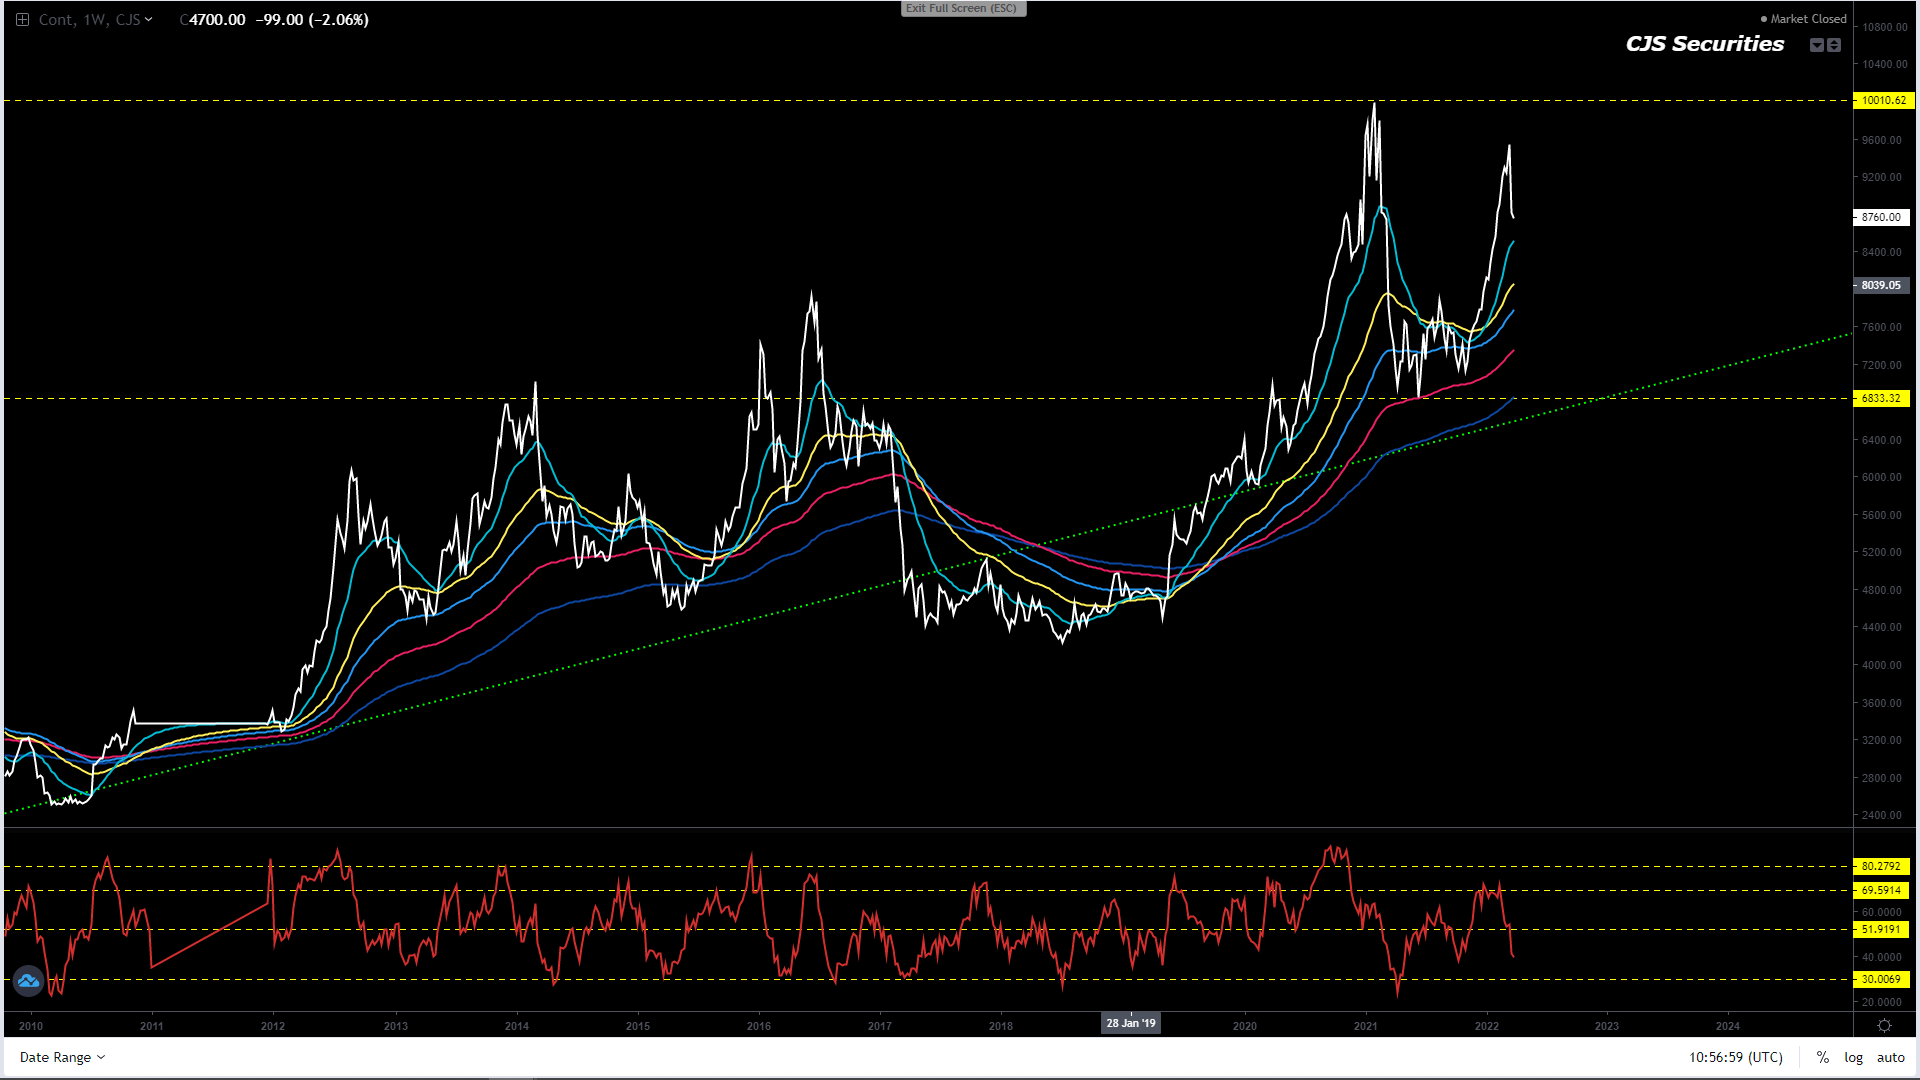
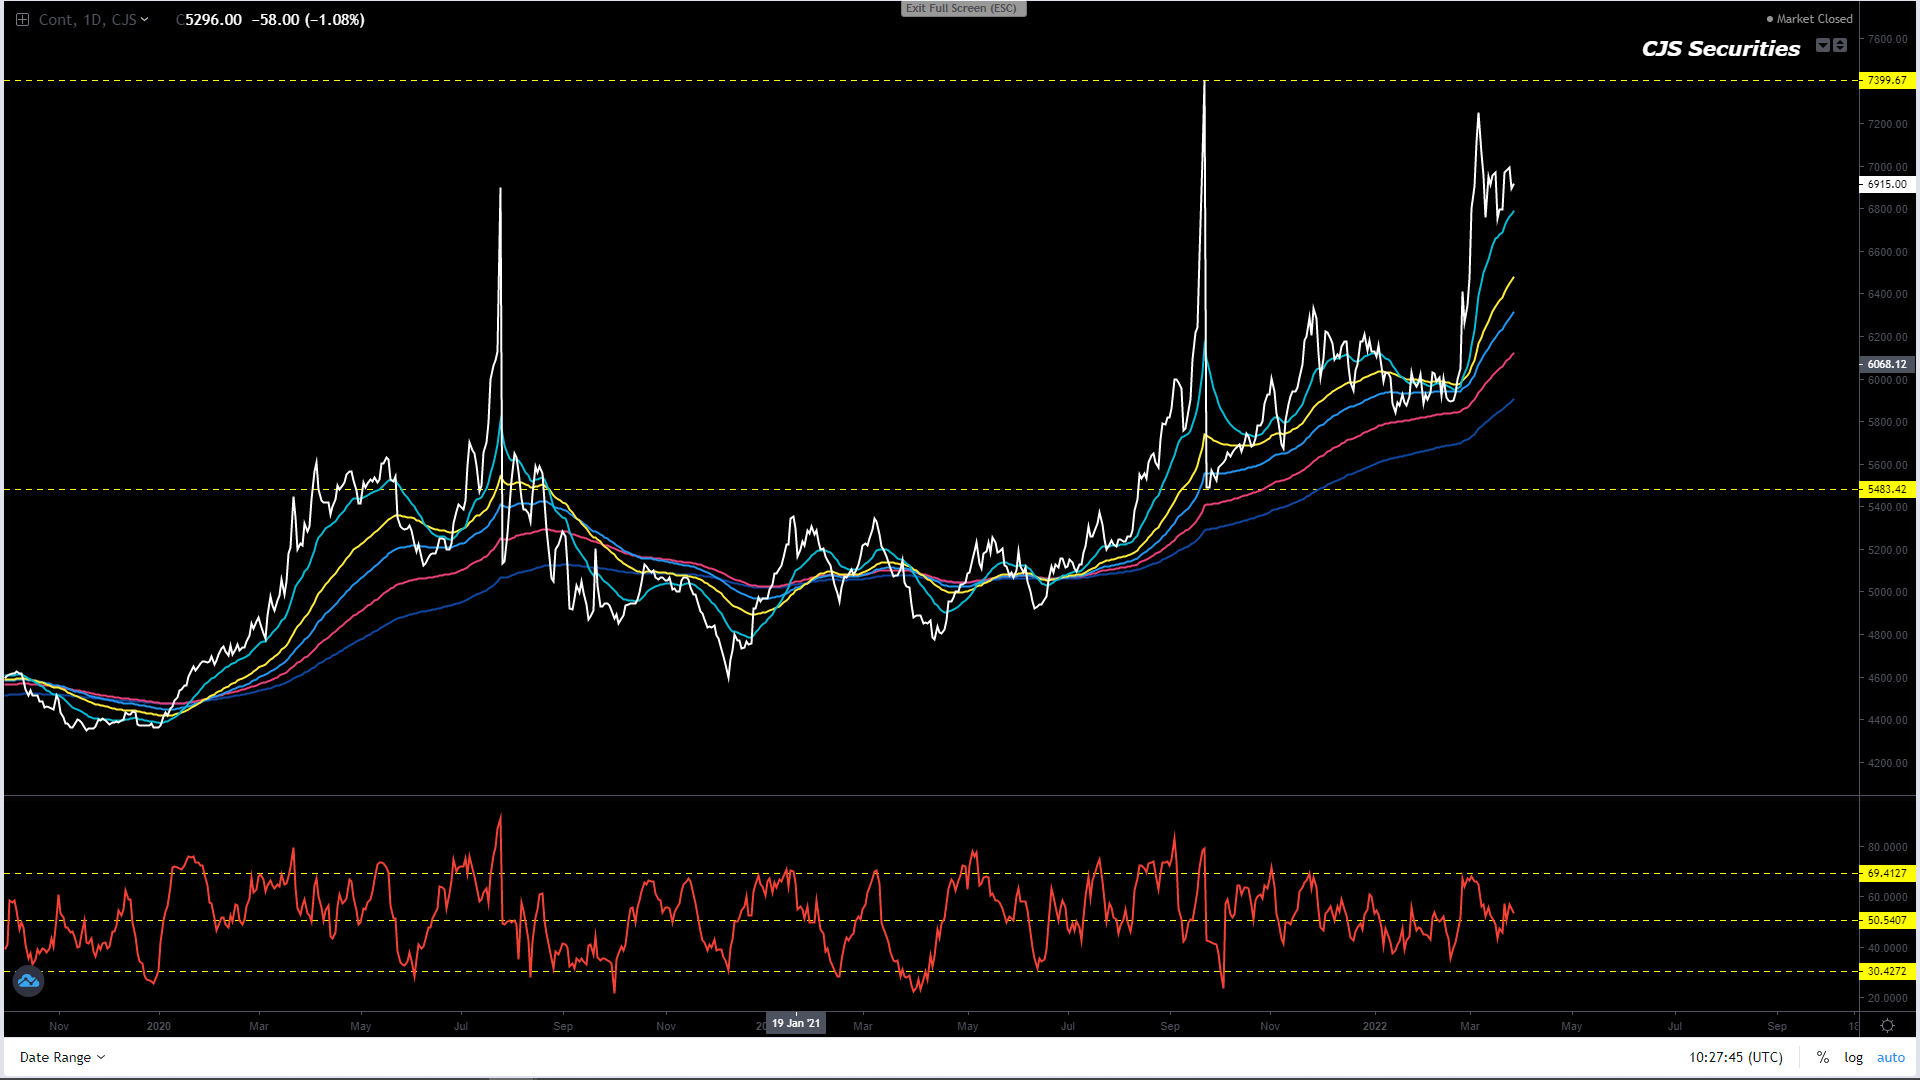
Weekly WM Continuous Close
On a global level our maize market is super strong.
I can’t find a reason to be short this chart with only the top of the channel providing some resistance.
I have no strong views other than to urge producers to price as anything can happen.
Weekly YM Continuous Close
On a global level our maize market is super strong.
Close to ATH’s I cannot find a reason to sell this chart at all or pick tops.
I have no strong views other than to urge producers to price as anything can happen.
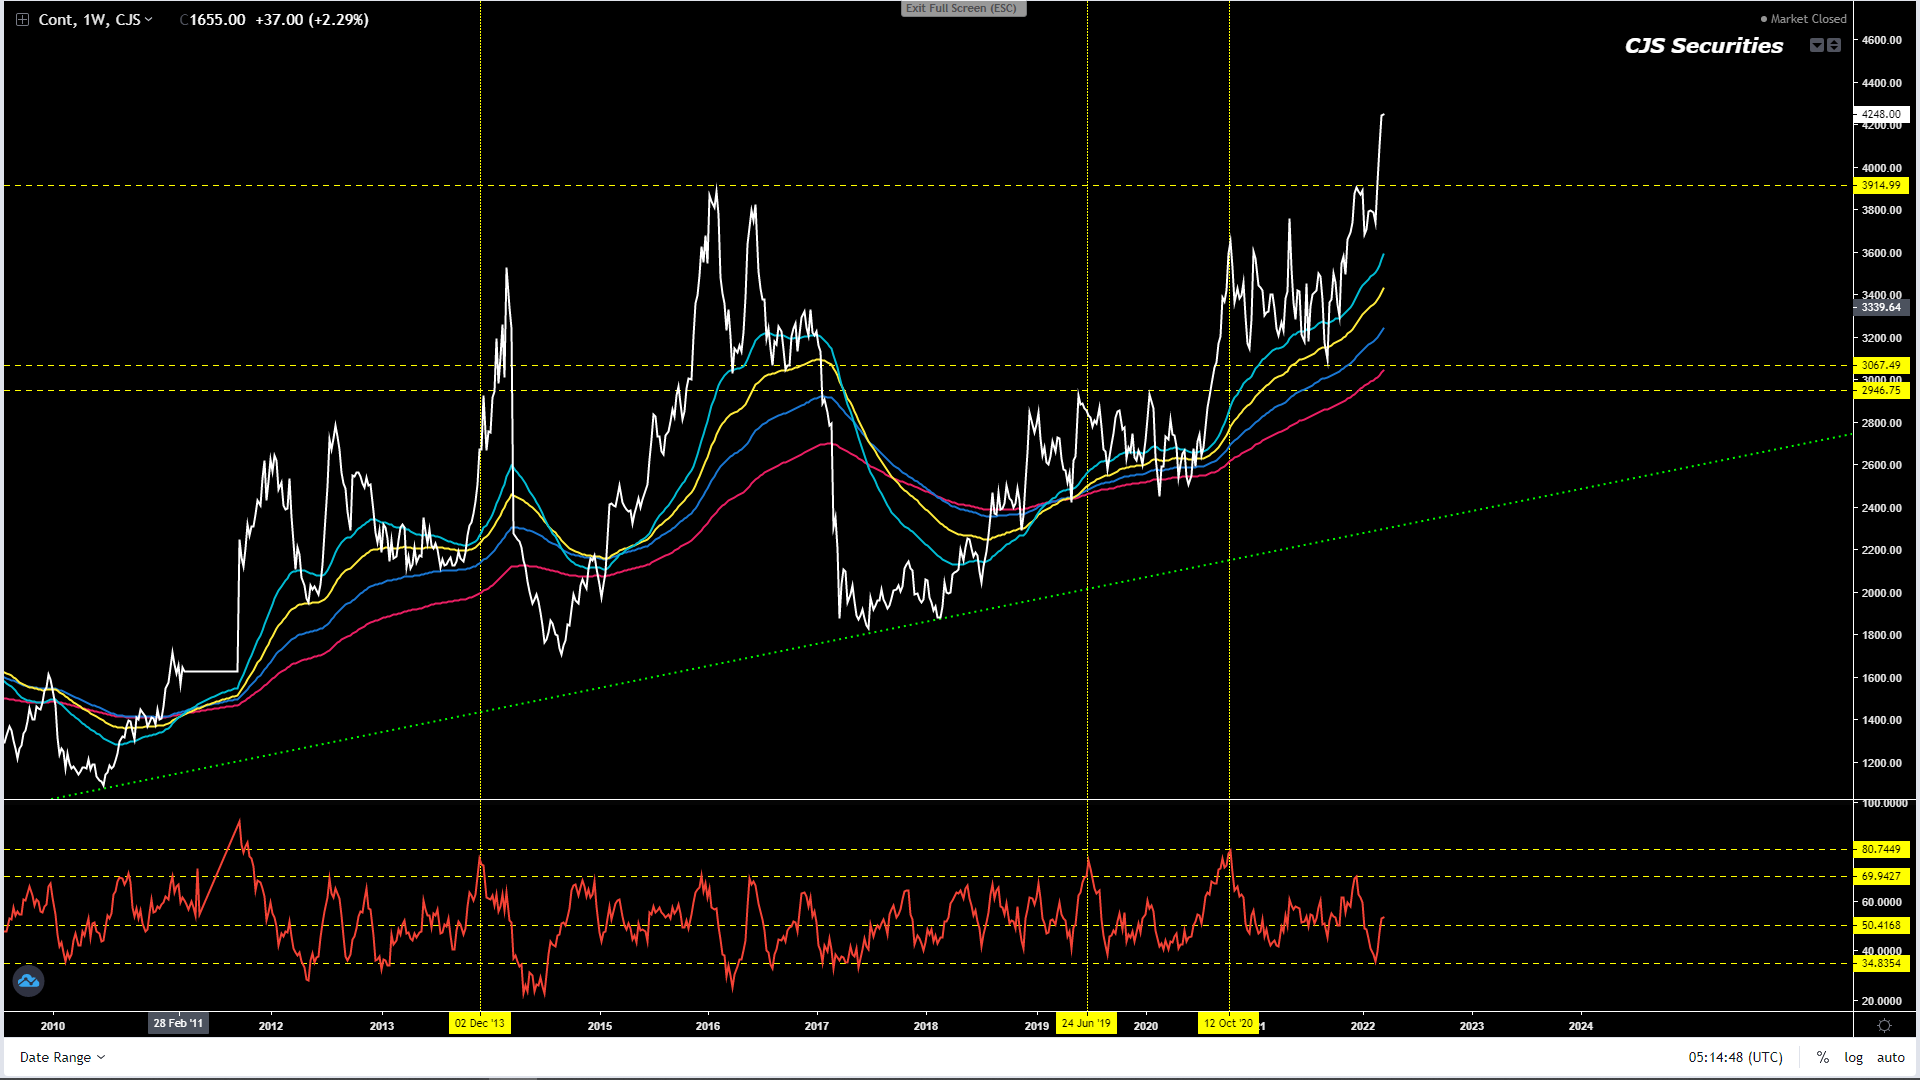
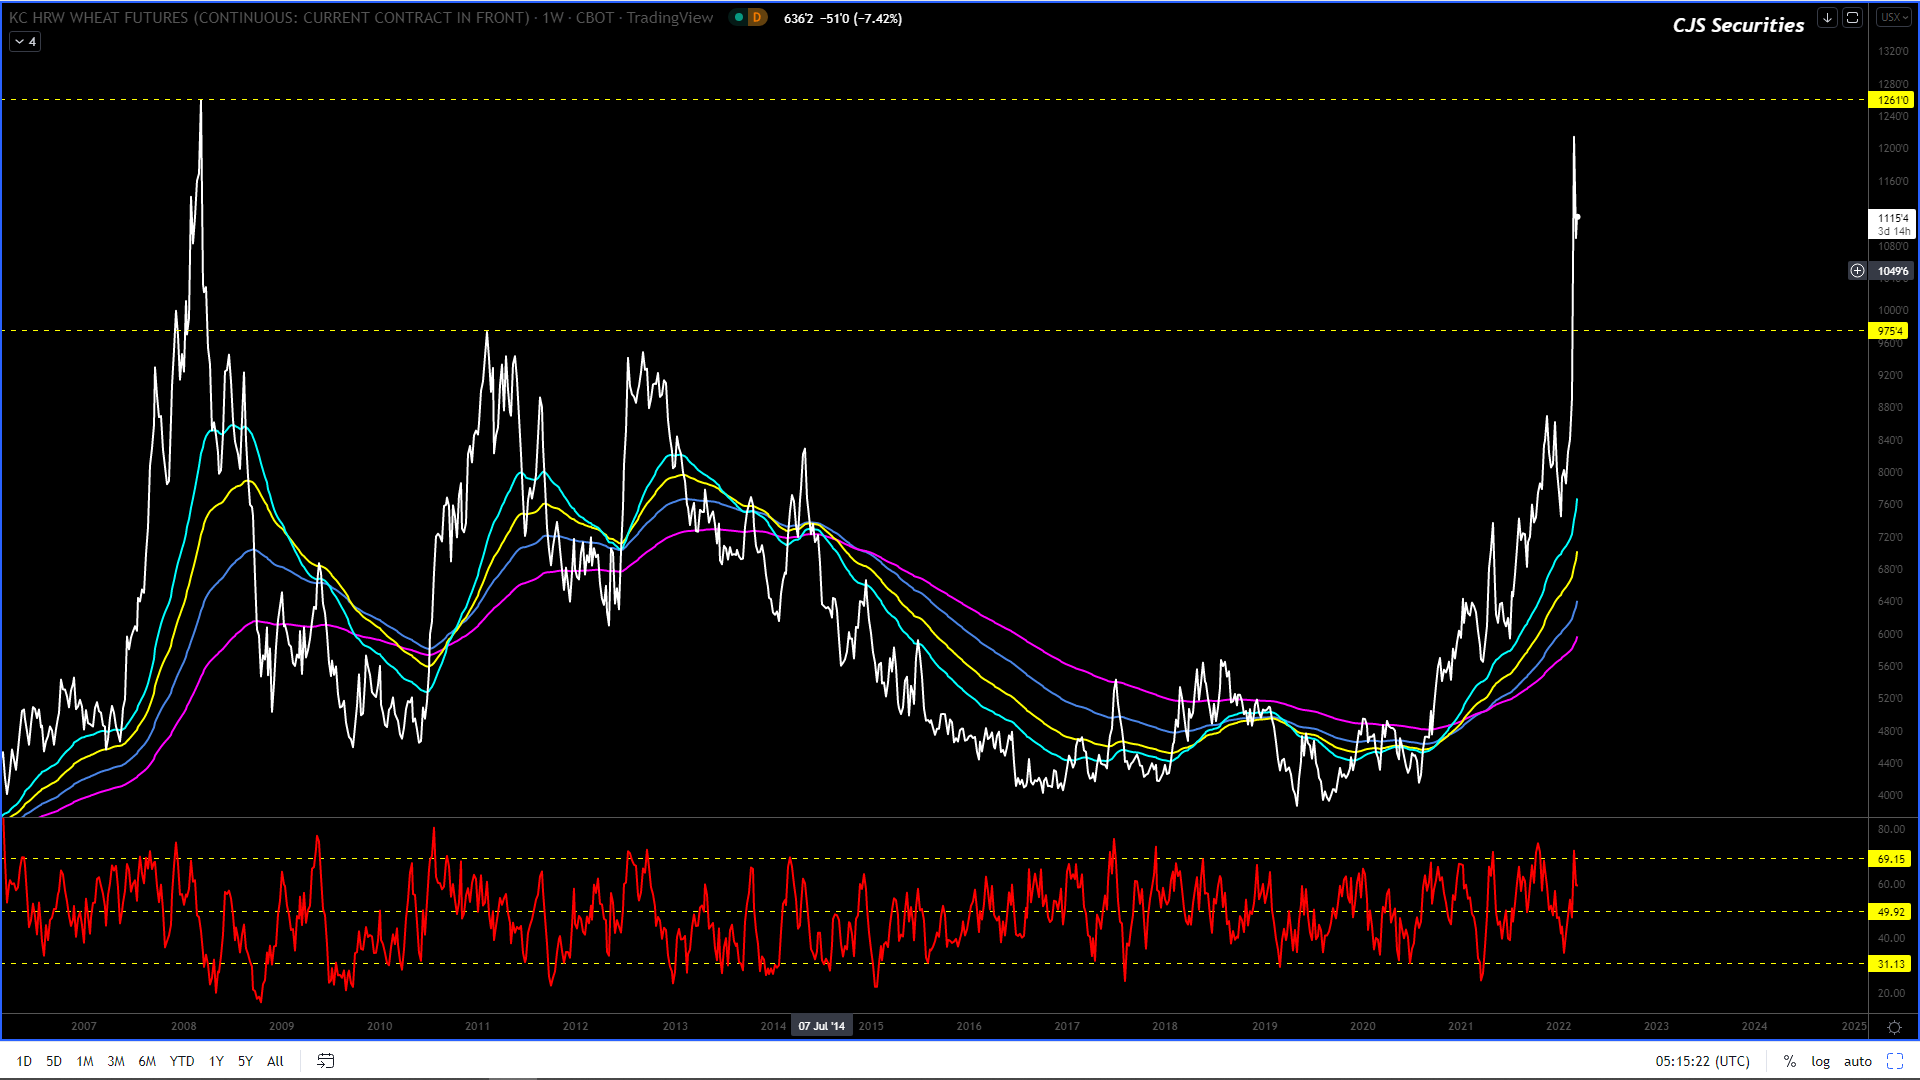
Weekly KC Wheat Continuous Close
#No Change in Commentary
Wheat has been the wildest of rides and the market now appears to be well into its corrective phase.
Stay out until further notice.
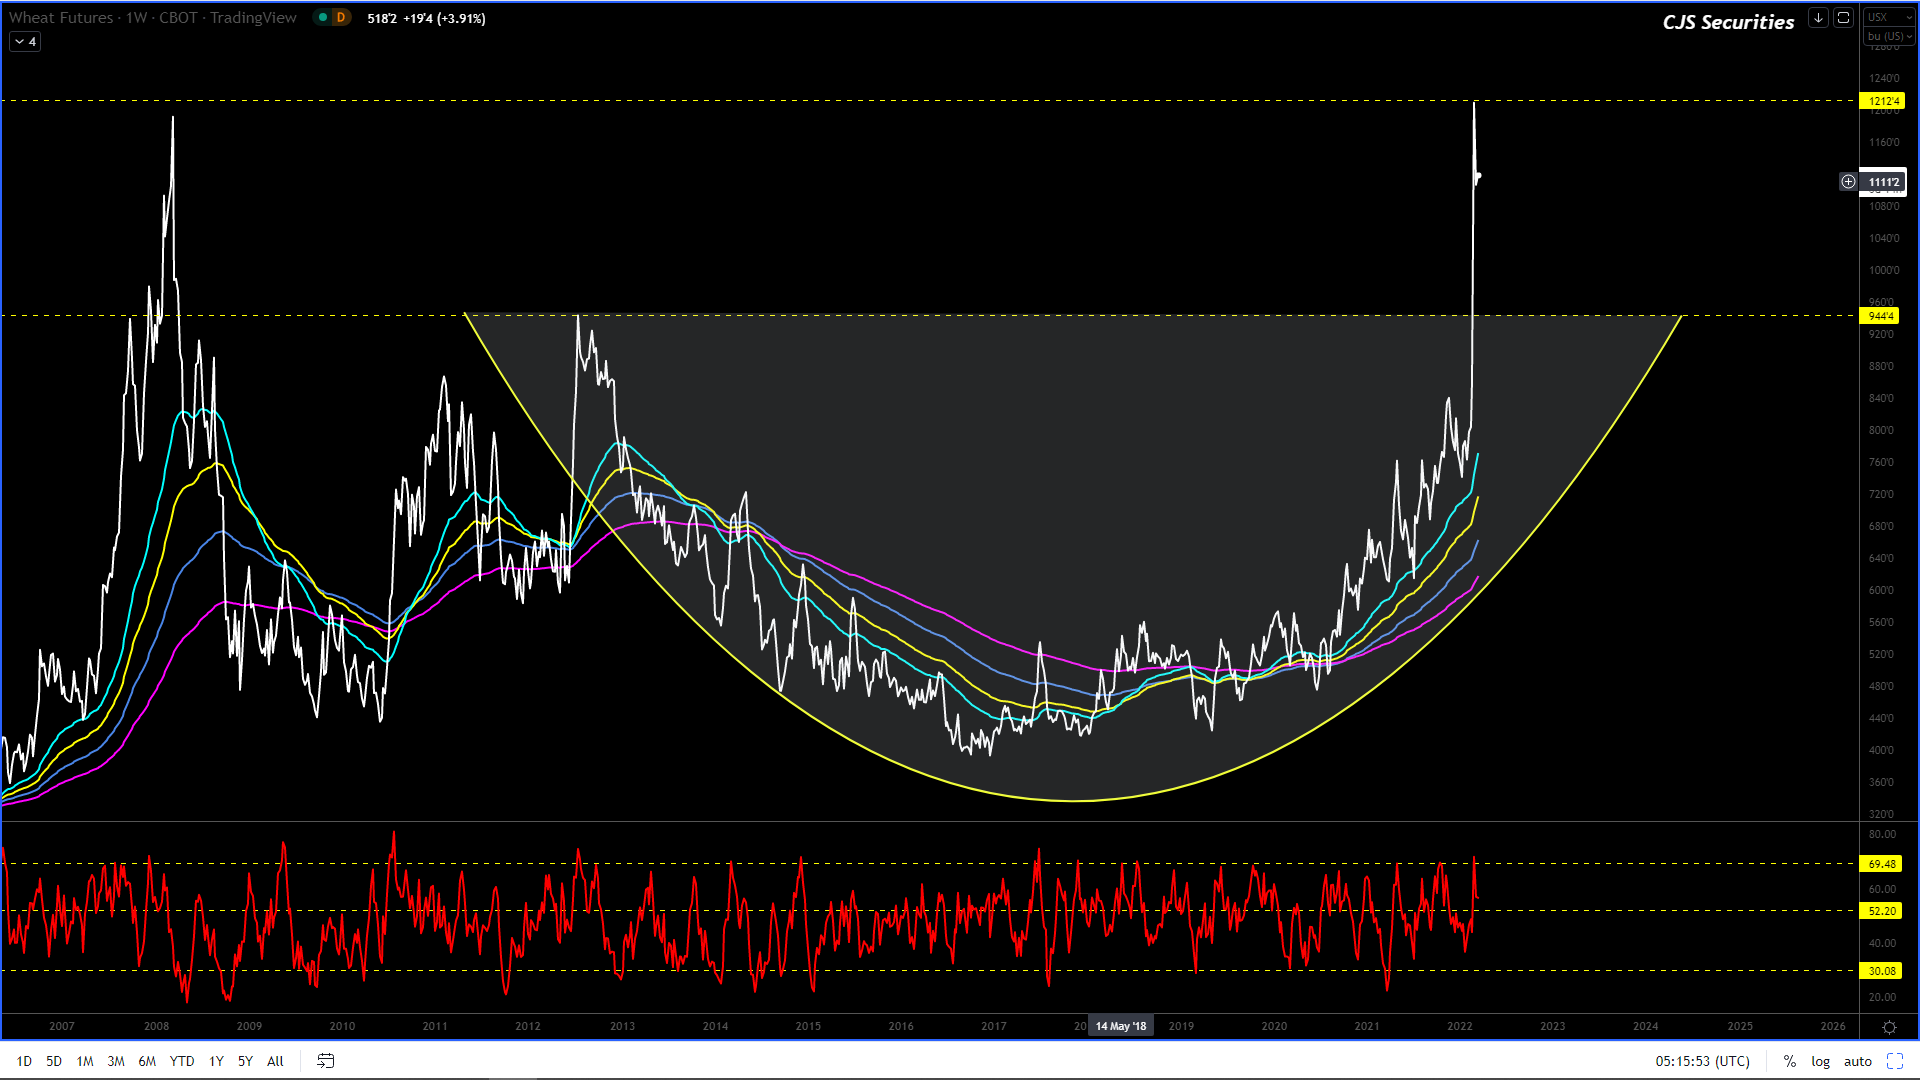
Weekly Chicago SRW Wheat Continuous
#No Change in Commentary
Wheat has been the wildest of rides and the market now appears to be well into its corrective phase.
Stay out until further notice.
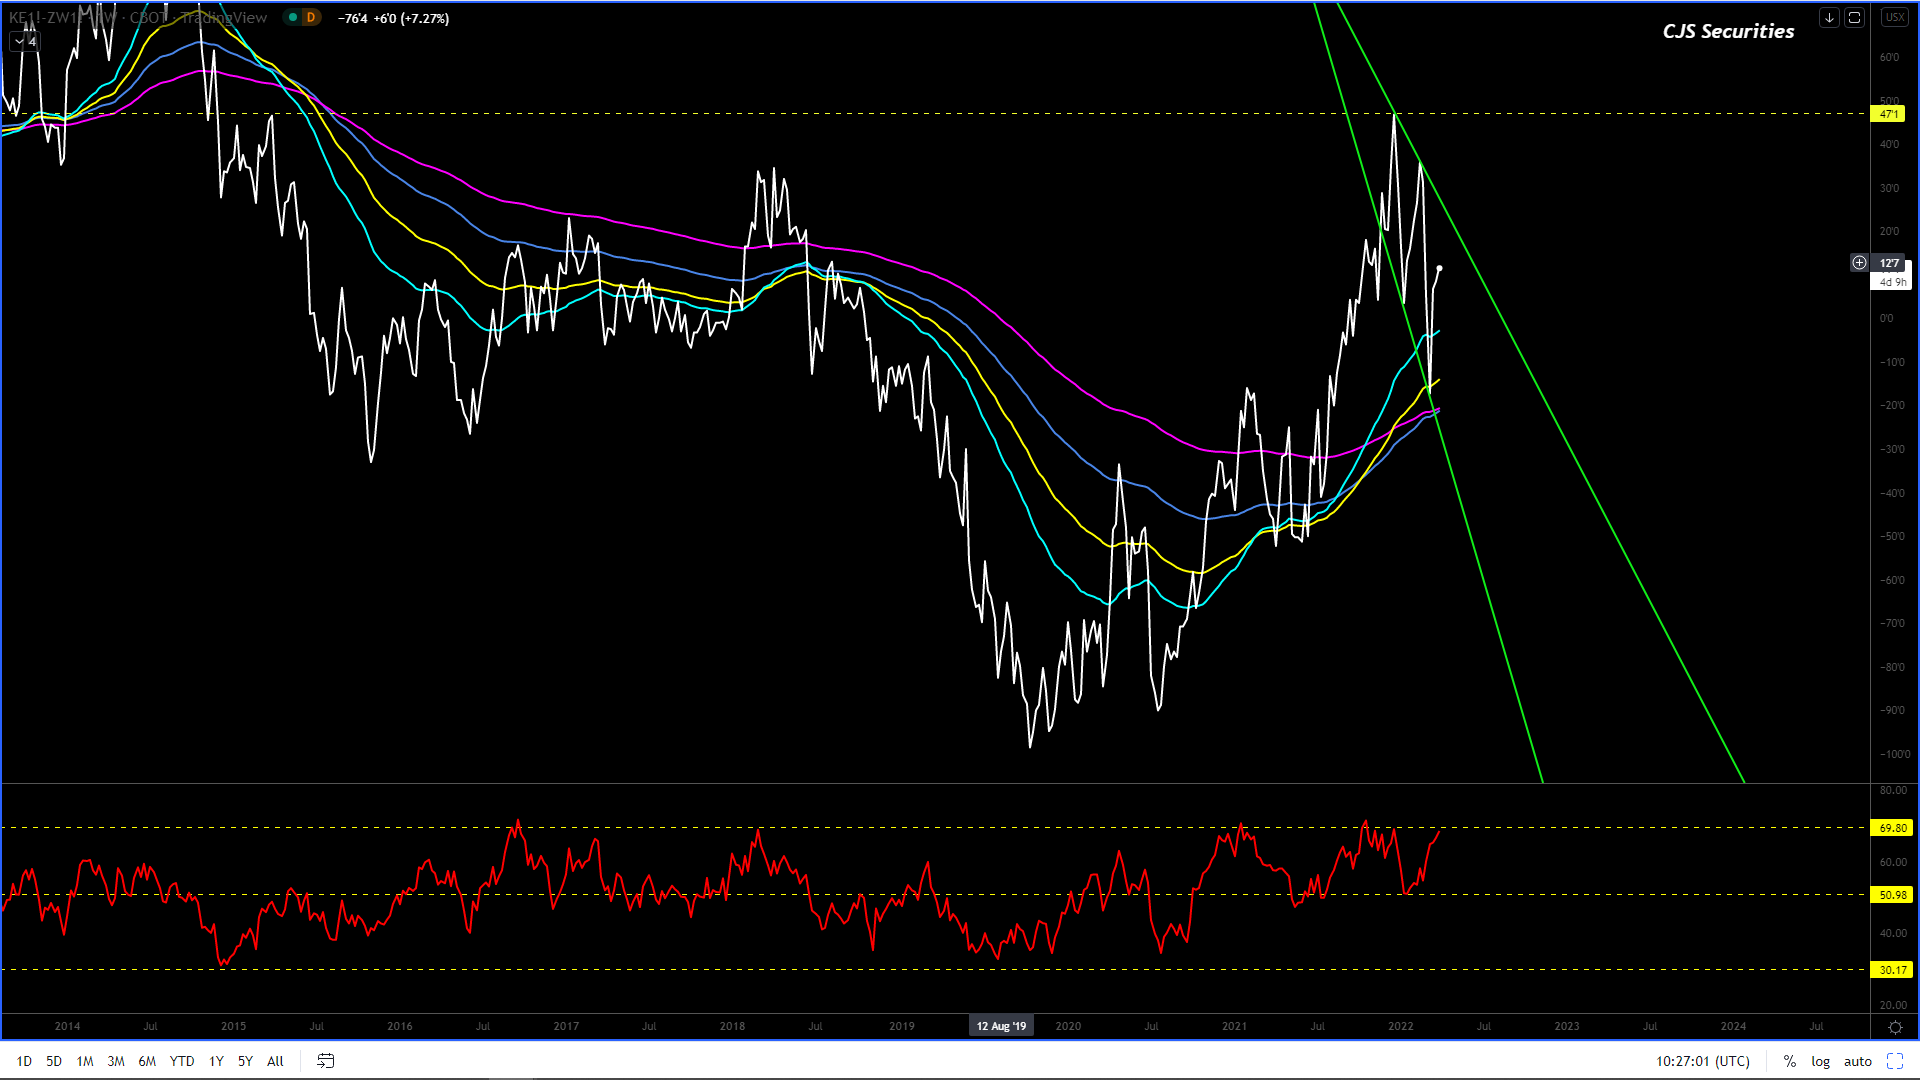
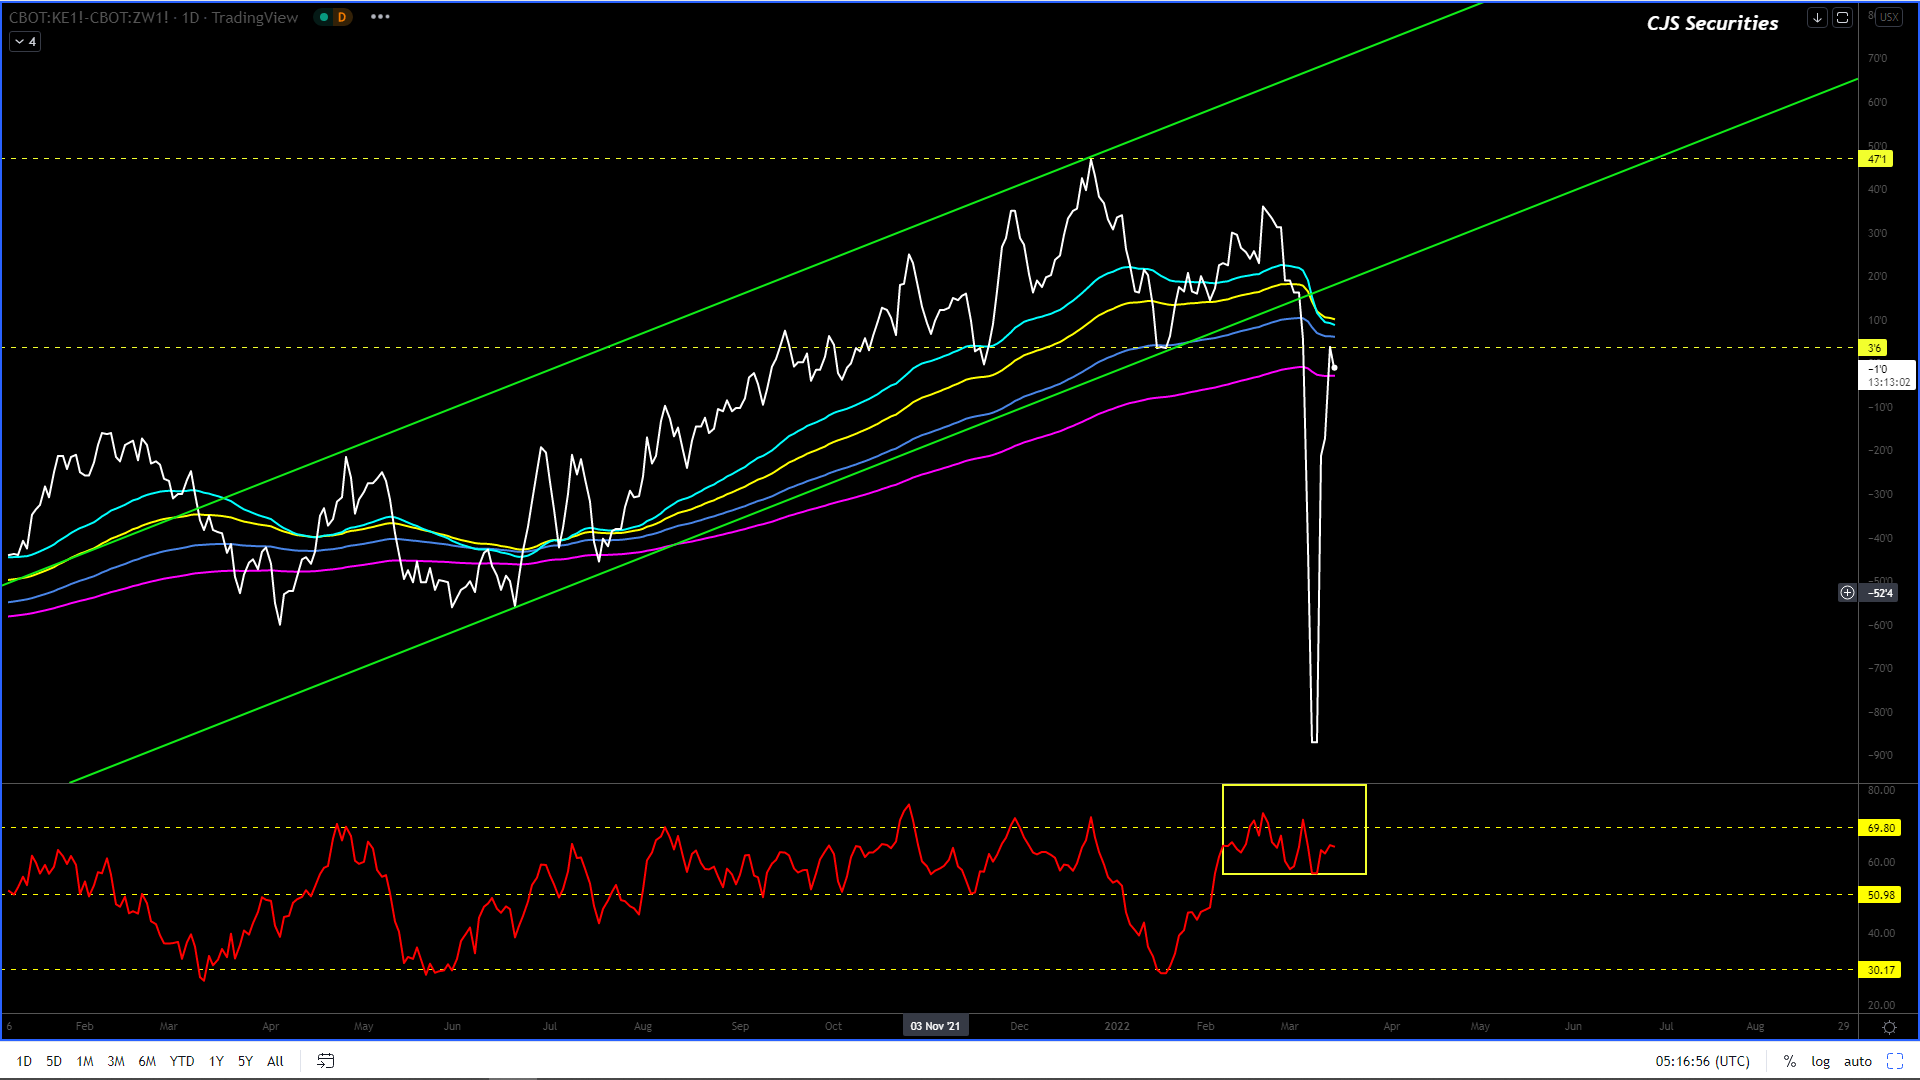
Weekly Close KC Wheat v Chicago SRW Continuous Close
I have changed the timeline to Weekly and as it stands this chart could still trade higher, but the pullback will be wild.
Weekly SAF Wheat Continuous Close
#No Change in Commentary
Much like its US counter part, SAF wheat is in a corrective phase. – The correction could be over, but I don’t have the constitution to buy it here!
I will be patiently watching to see how this plays out over the next few weeks before looking to get in.
Daily Matif Wheat Continuous Close
Based on the current
formation the chart seems to have another leg higher, but I do not have the
gumption to buy it here!
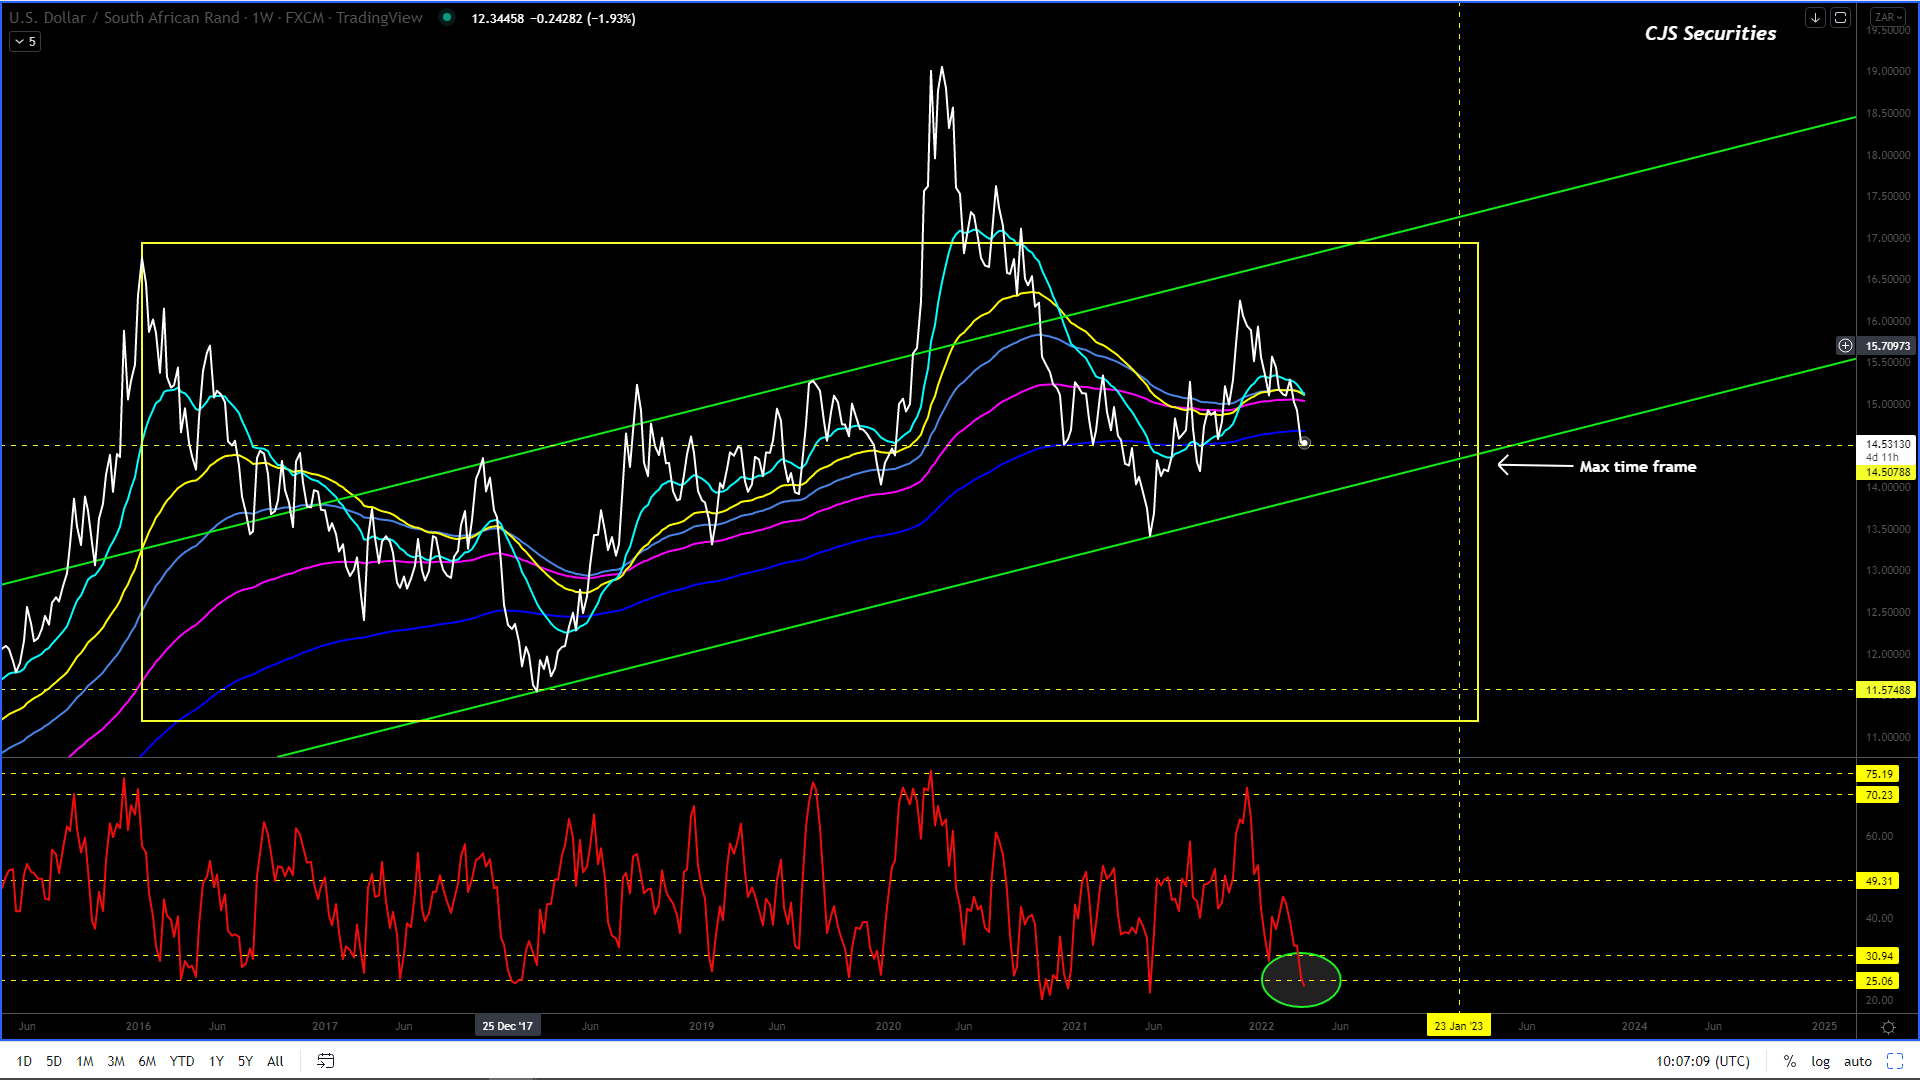
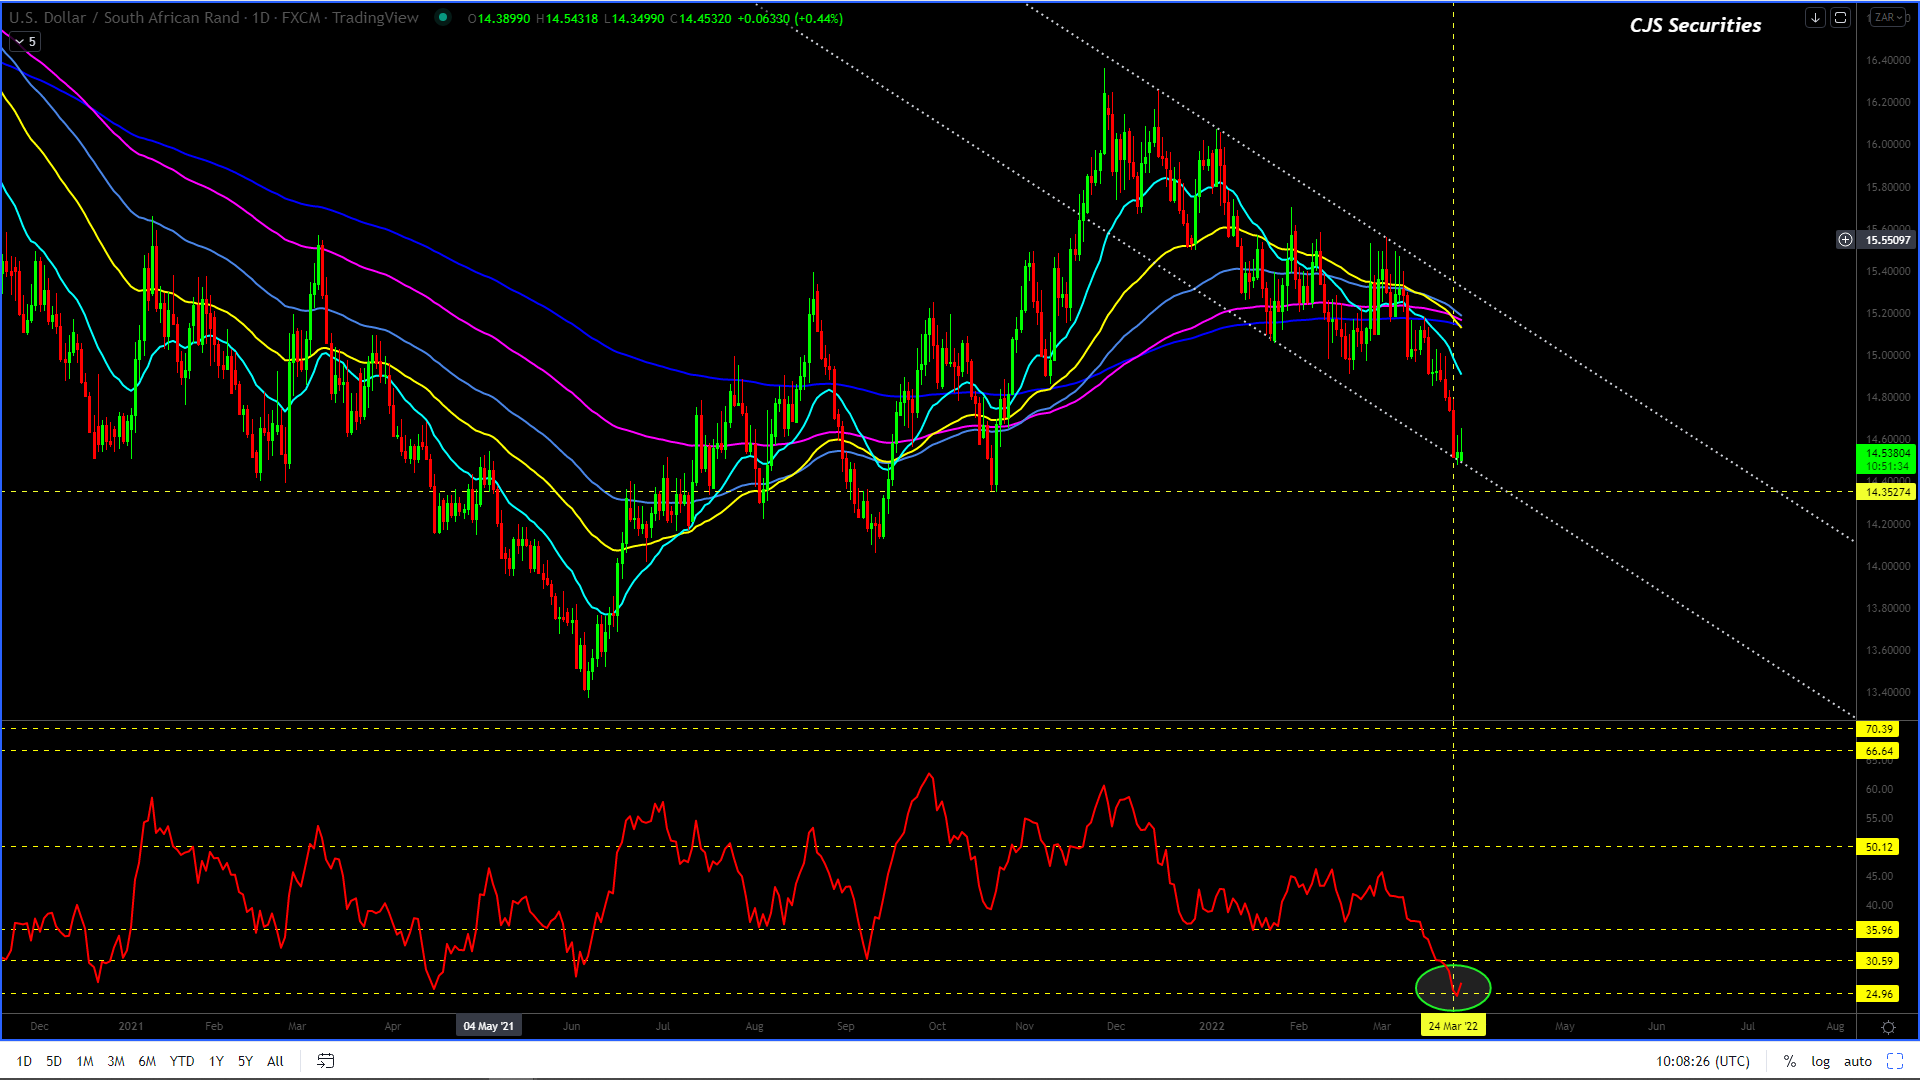
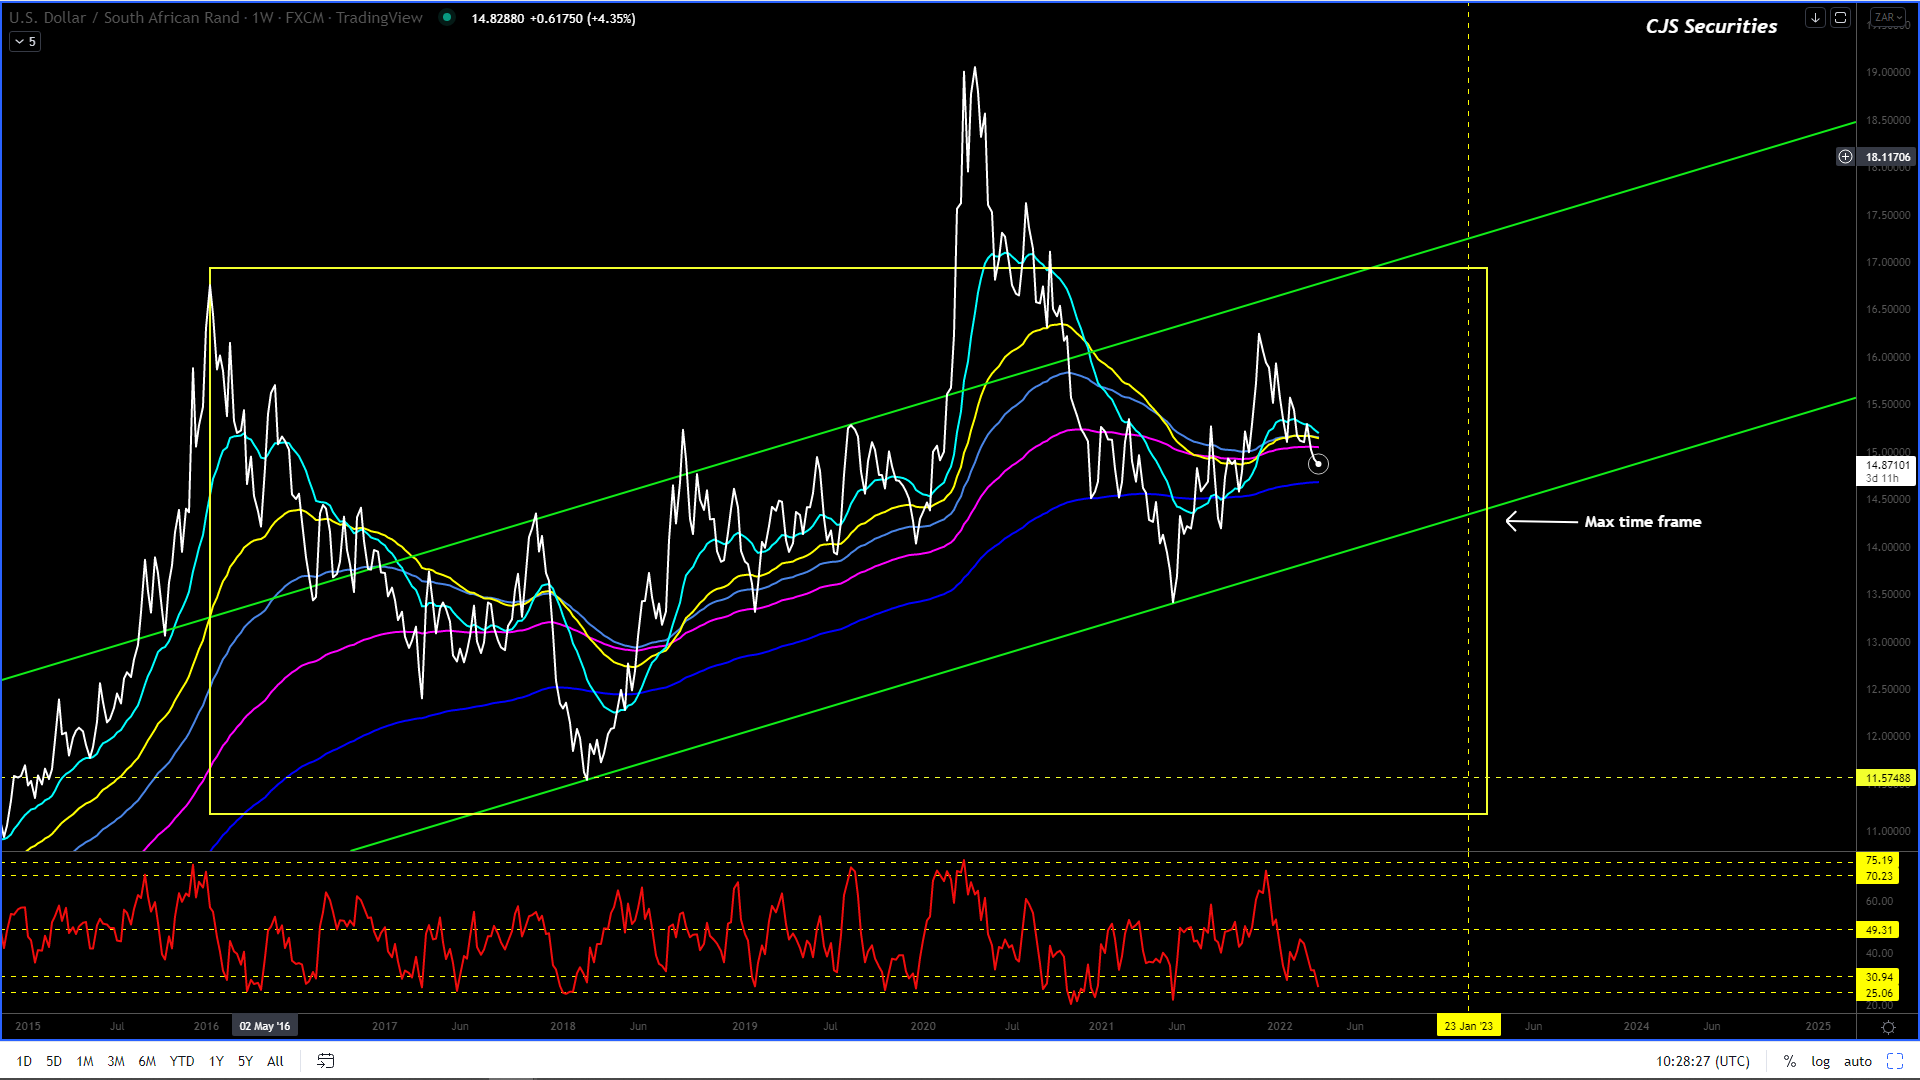
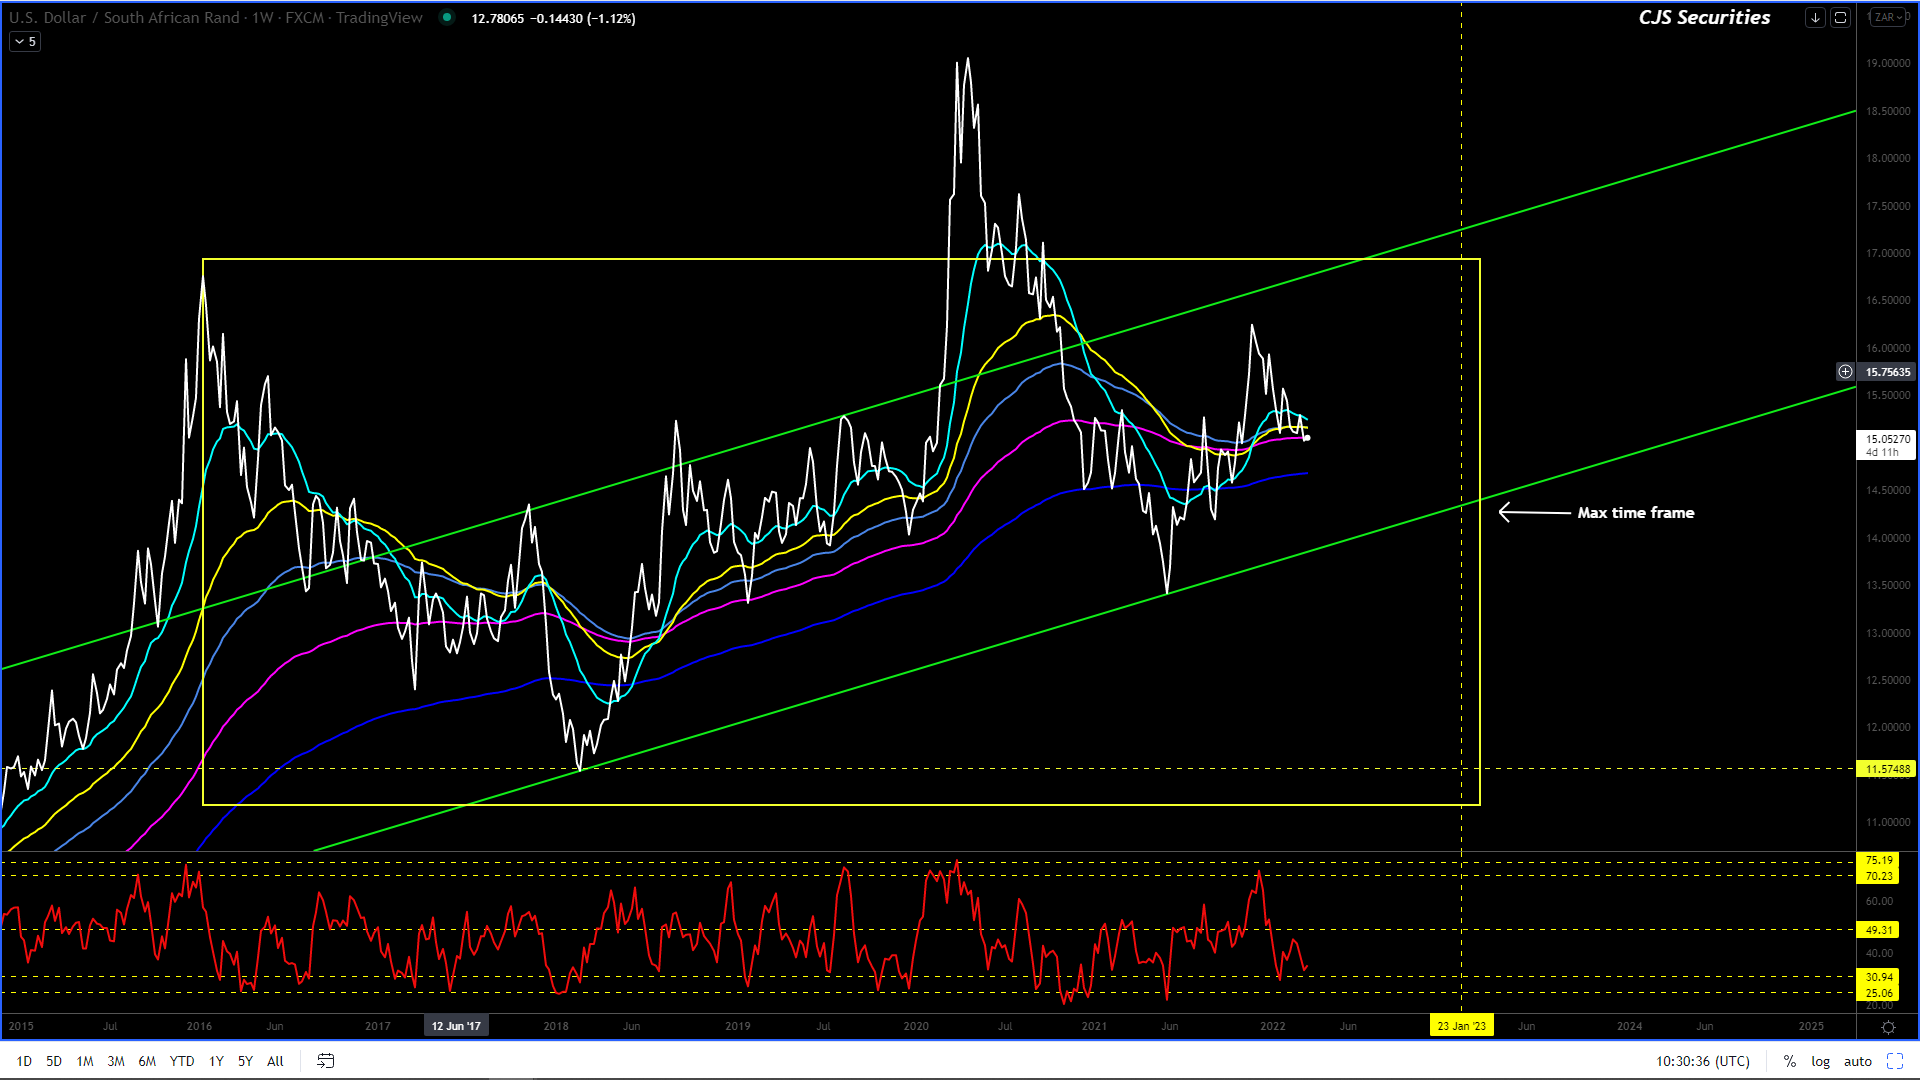
However, this is a Weekly chart and before my ultimate downside target is reached, we should be in for a decent kick that will provide us with the last chance to sell the Dollar aka buy the ZAR.
Short term outlook = the chart is now super oversold on a weekly close and I would start building a long position sub R14.51 the kick should be worth at least R0.50 if not more.
I still see the below taking place over time.
What I see is R11.50 over the next 17 months.
I am convinced that the ZAR is in a multi-year corrective phase vs. the USD and that from today on, all upward spikes on this chart are well worth a short!
This chart could easily have a leg higher and trade toward the R16.77 level in the coming weeks. – I would use this as a USD selling opportunity.
Until then, the range is likely to be R14.33 – R15.50 and I would seriously consider owning the bottom of the range!
I am happy to be long the Dollar down to the R14.40’s.
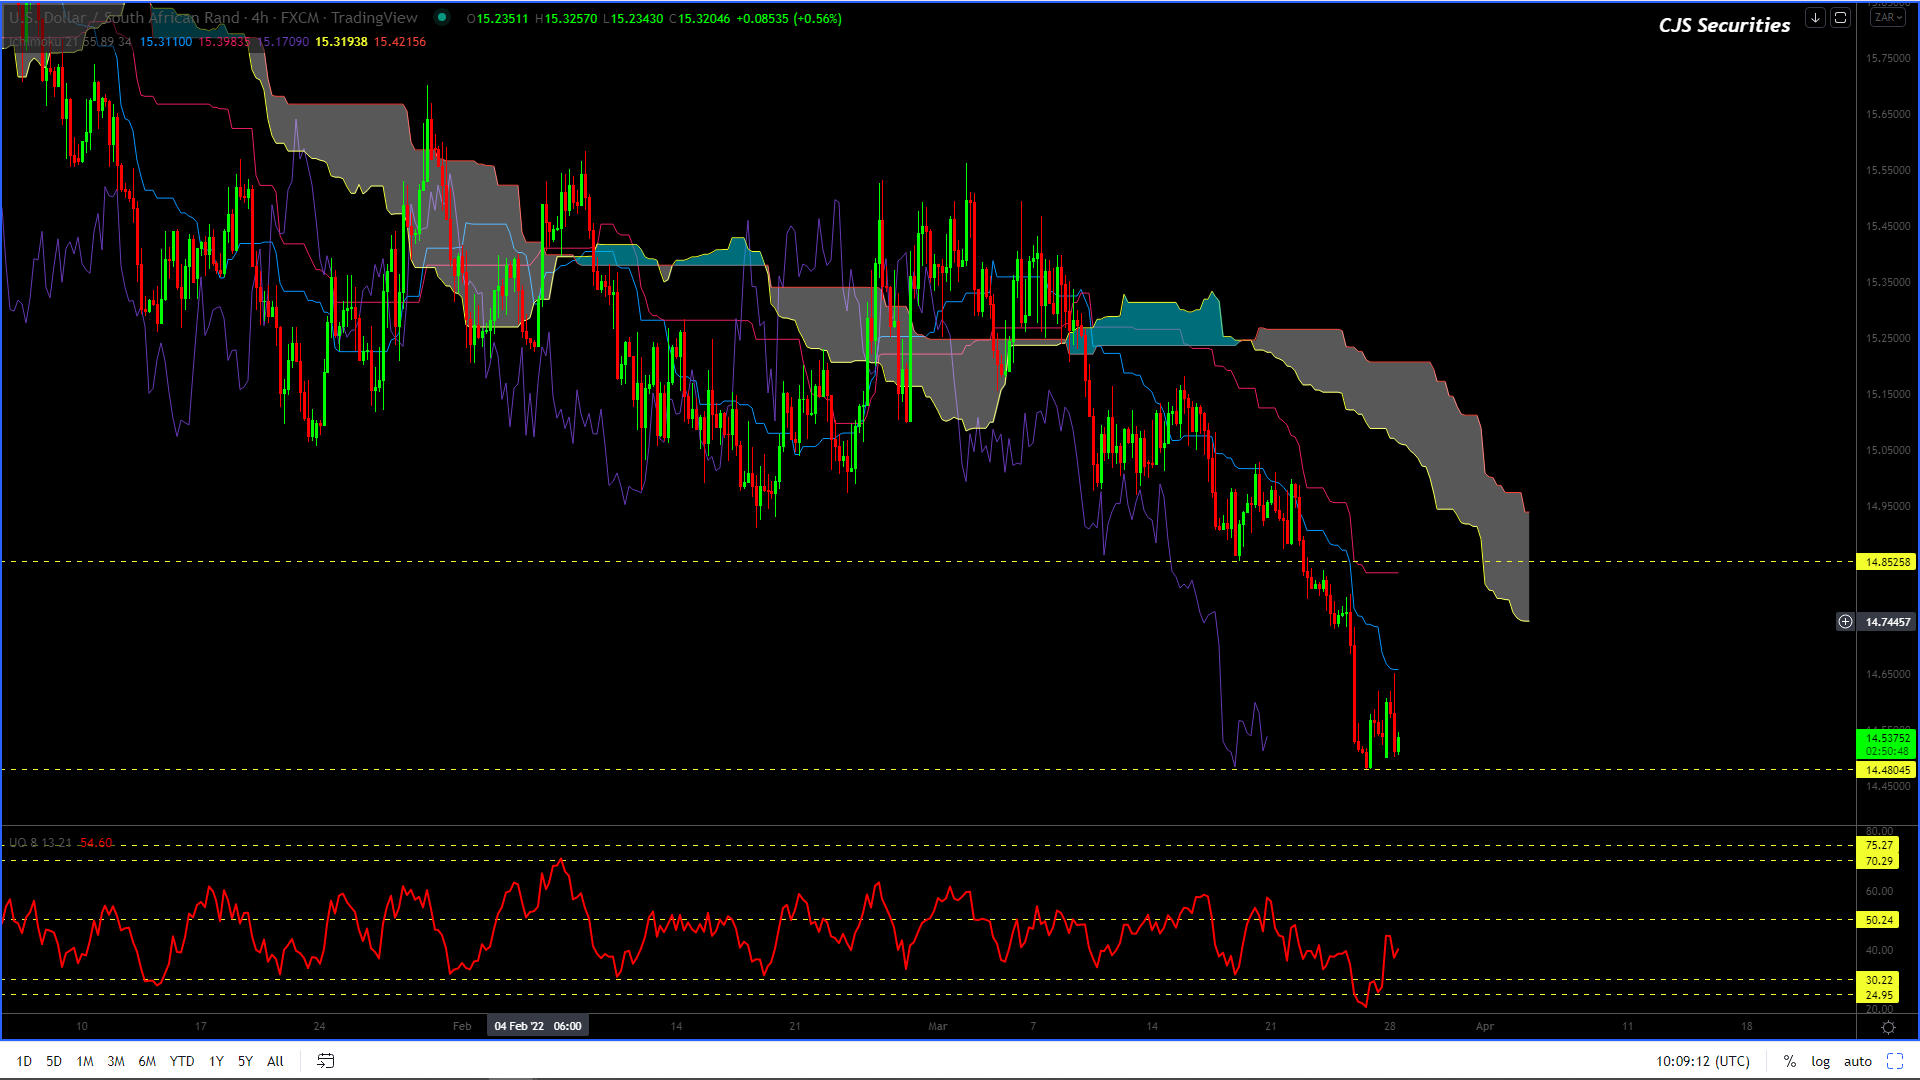
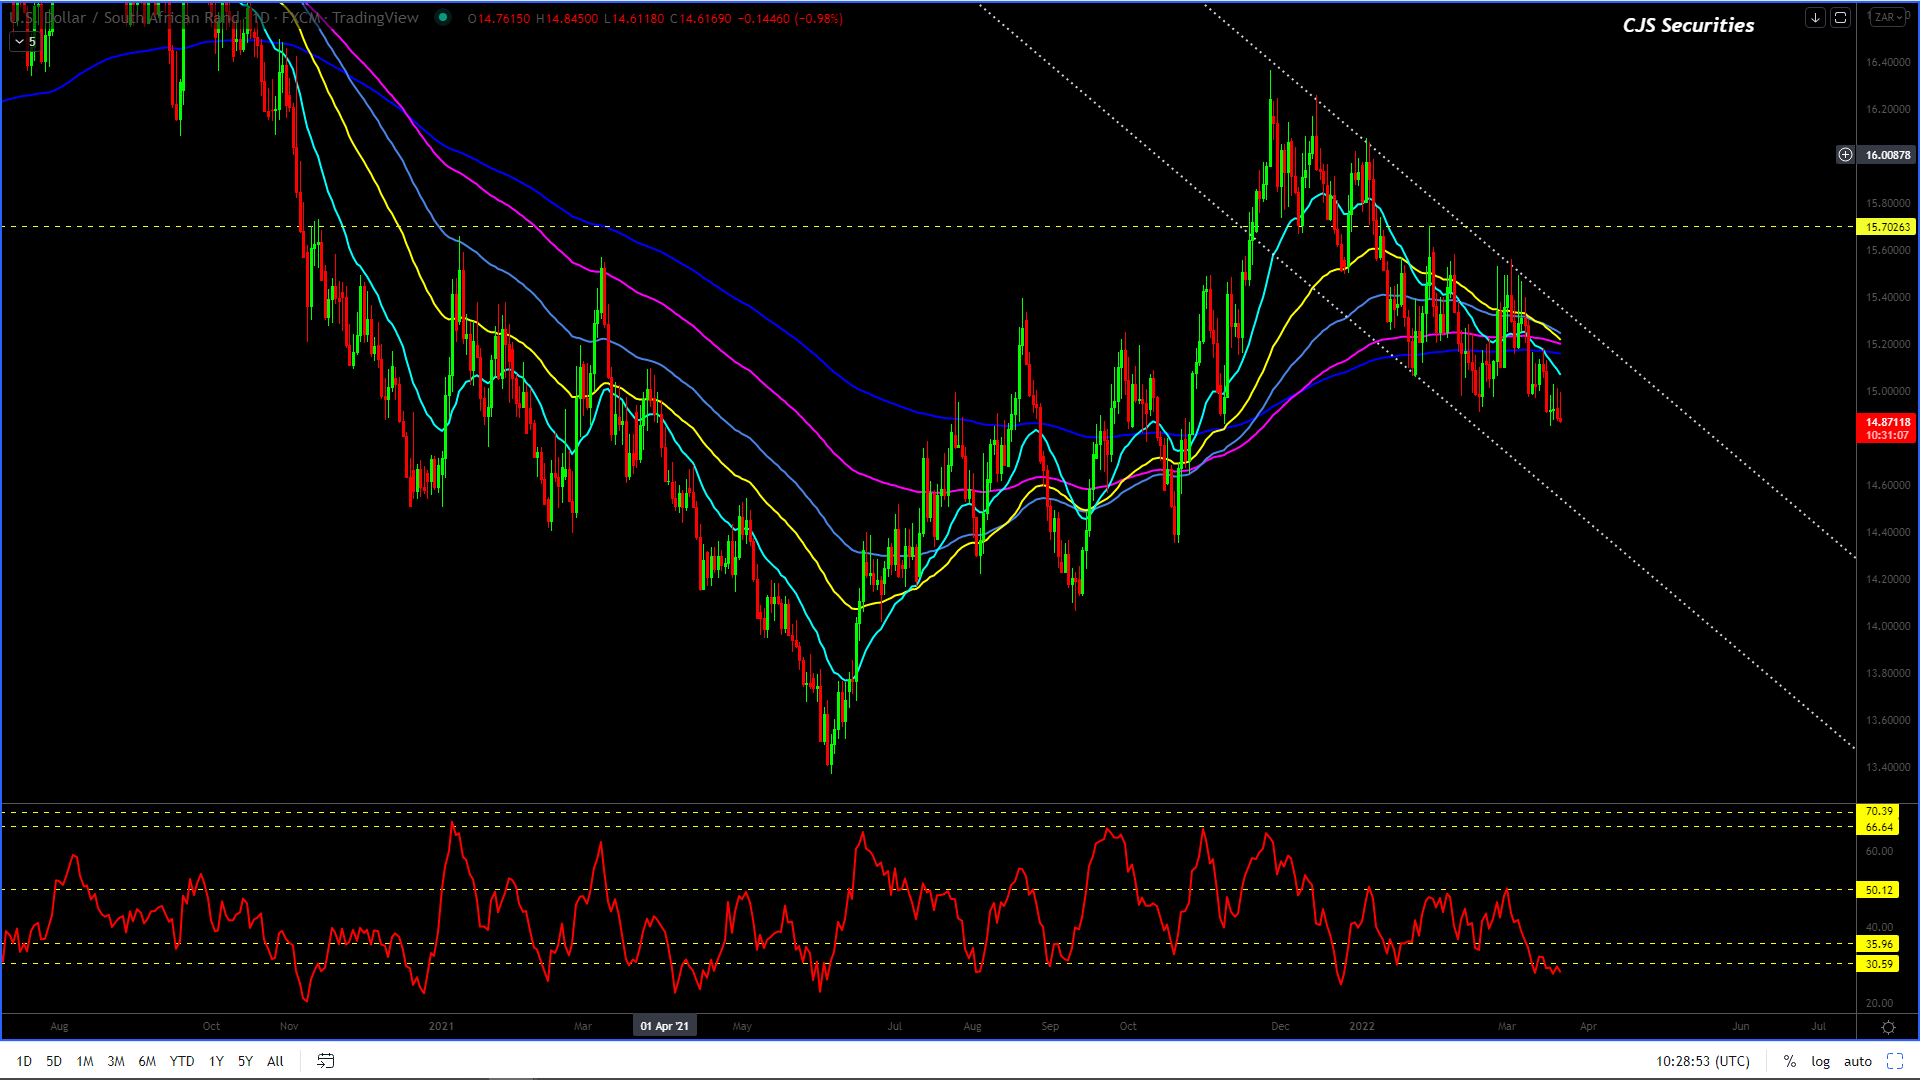
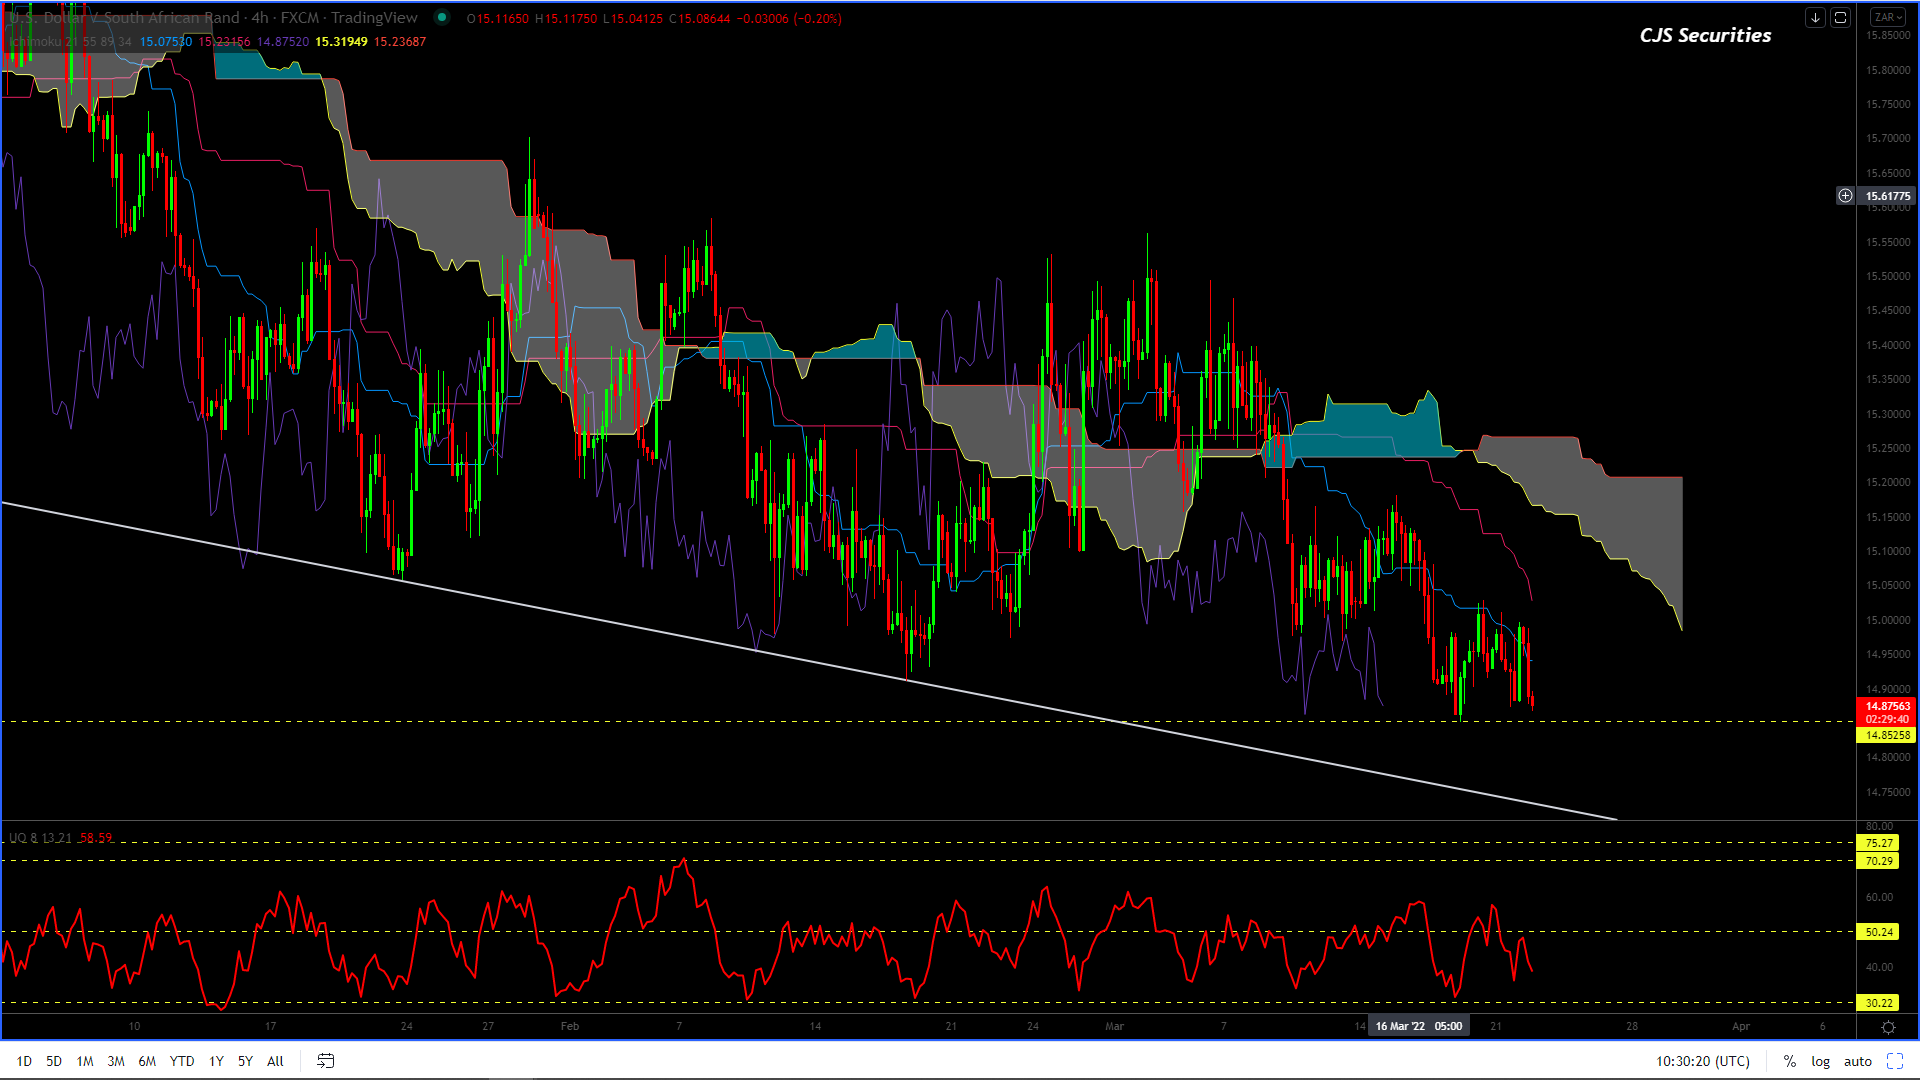
Dollar/Rand Daily Candle
This chart is still headed lower, with potentially a print at R14.52. – looking good so far, with R14.33 being my ST ultimate downside.
The chart is now grossly oversold but can easily go a little further until the weekly oscillator meets the daily. – this is pretty close to happening!
I would like a last leg higher into the high R16’s to complete the chart, but because of this leg being very deep, the kick could fail in the high R15’s. – we will watch as we go!
I cannot stress enough how important patience is and keeping your mind clear as emotions are sure to get the better of many this year. – this was a pre WAR quote.
Dollar/Rand 240 min Candle
The chart trade down past R14.70, but as it stands I cannot find any formation I would like to buy.
I am patiently waiting to see how low this chart can go, as the next trade I put on will be from the long side.
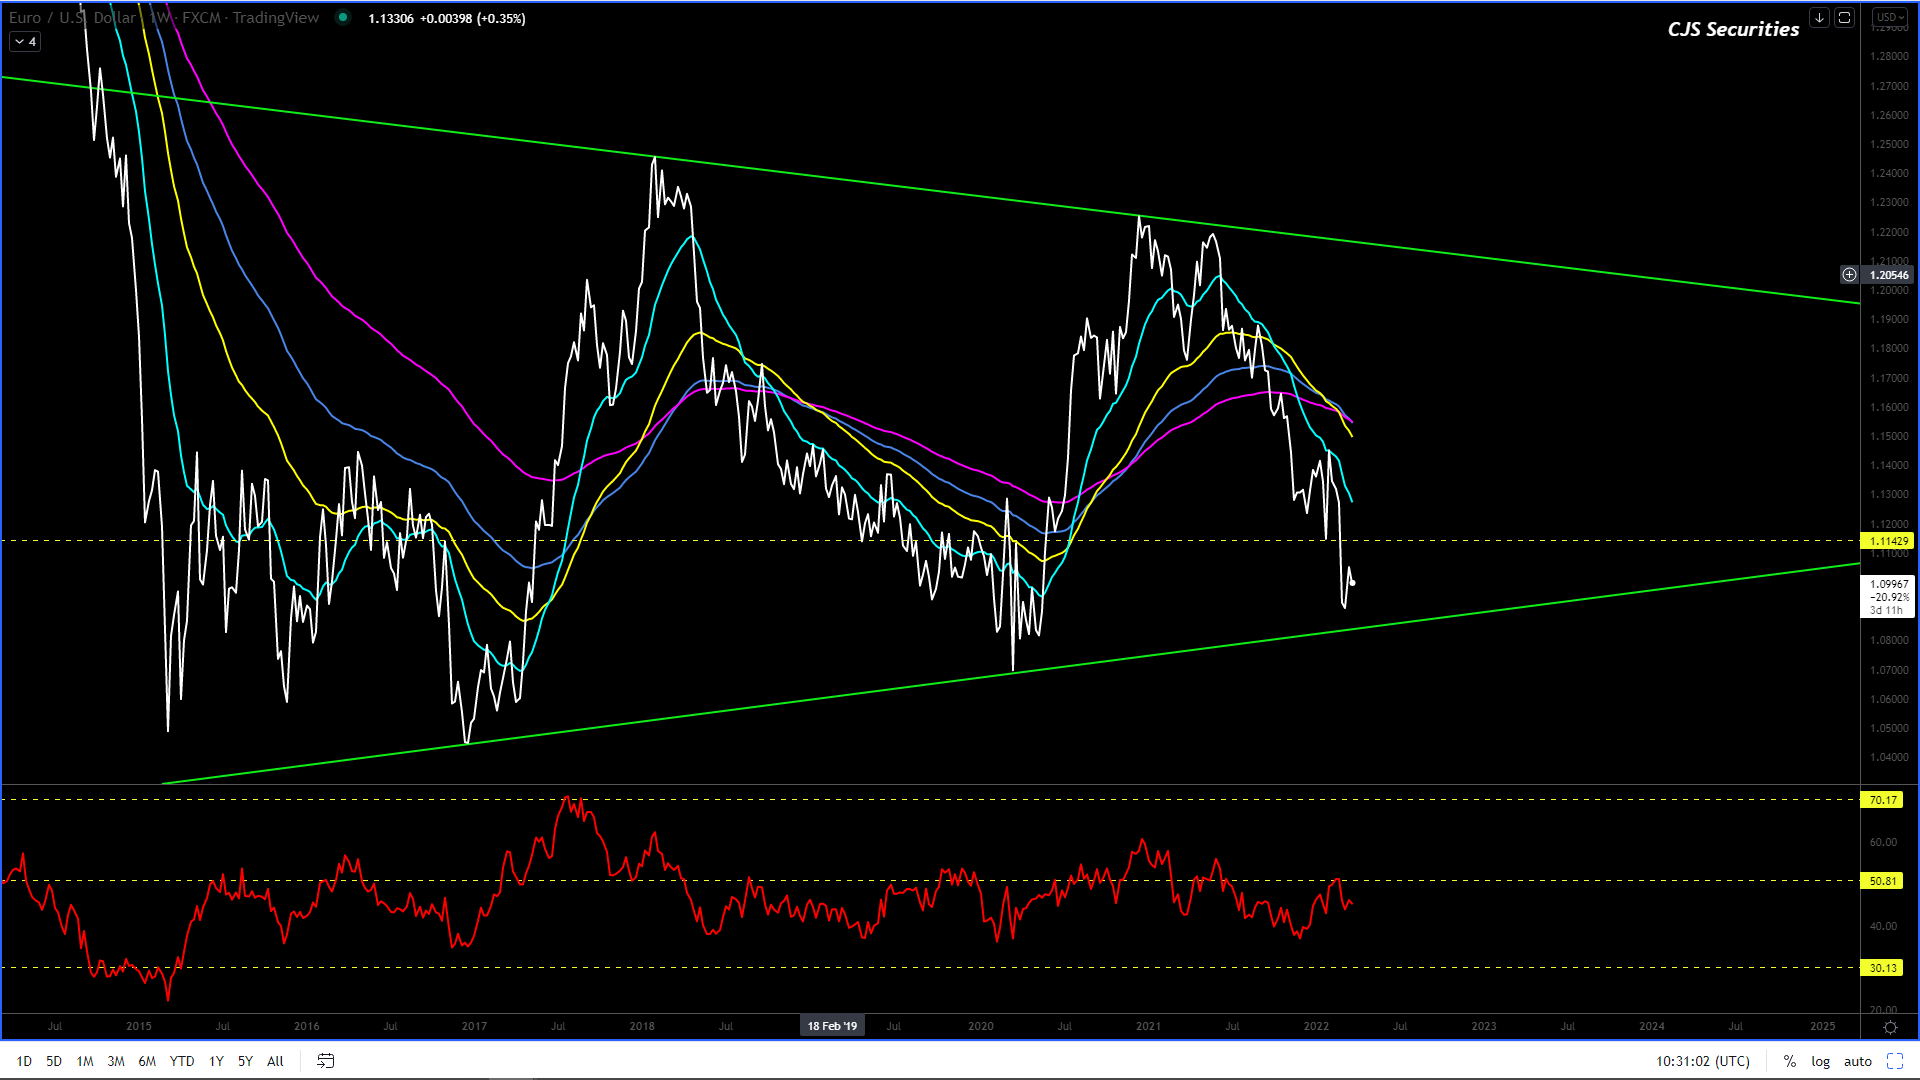
Euro/USD Weekly Close
#No Change in Commentary
I am very confused and in the big picture this chart could be consolidating for a serious move lower, but right now I would like to stay out!
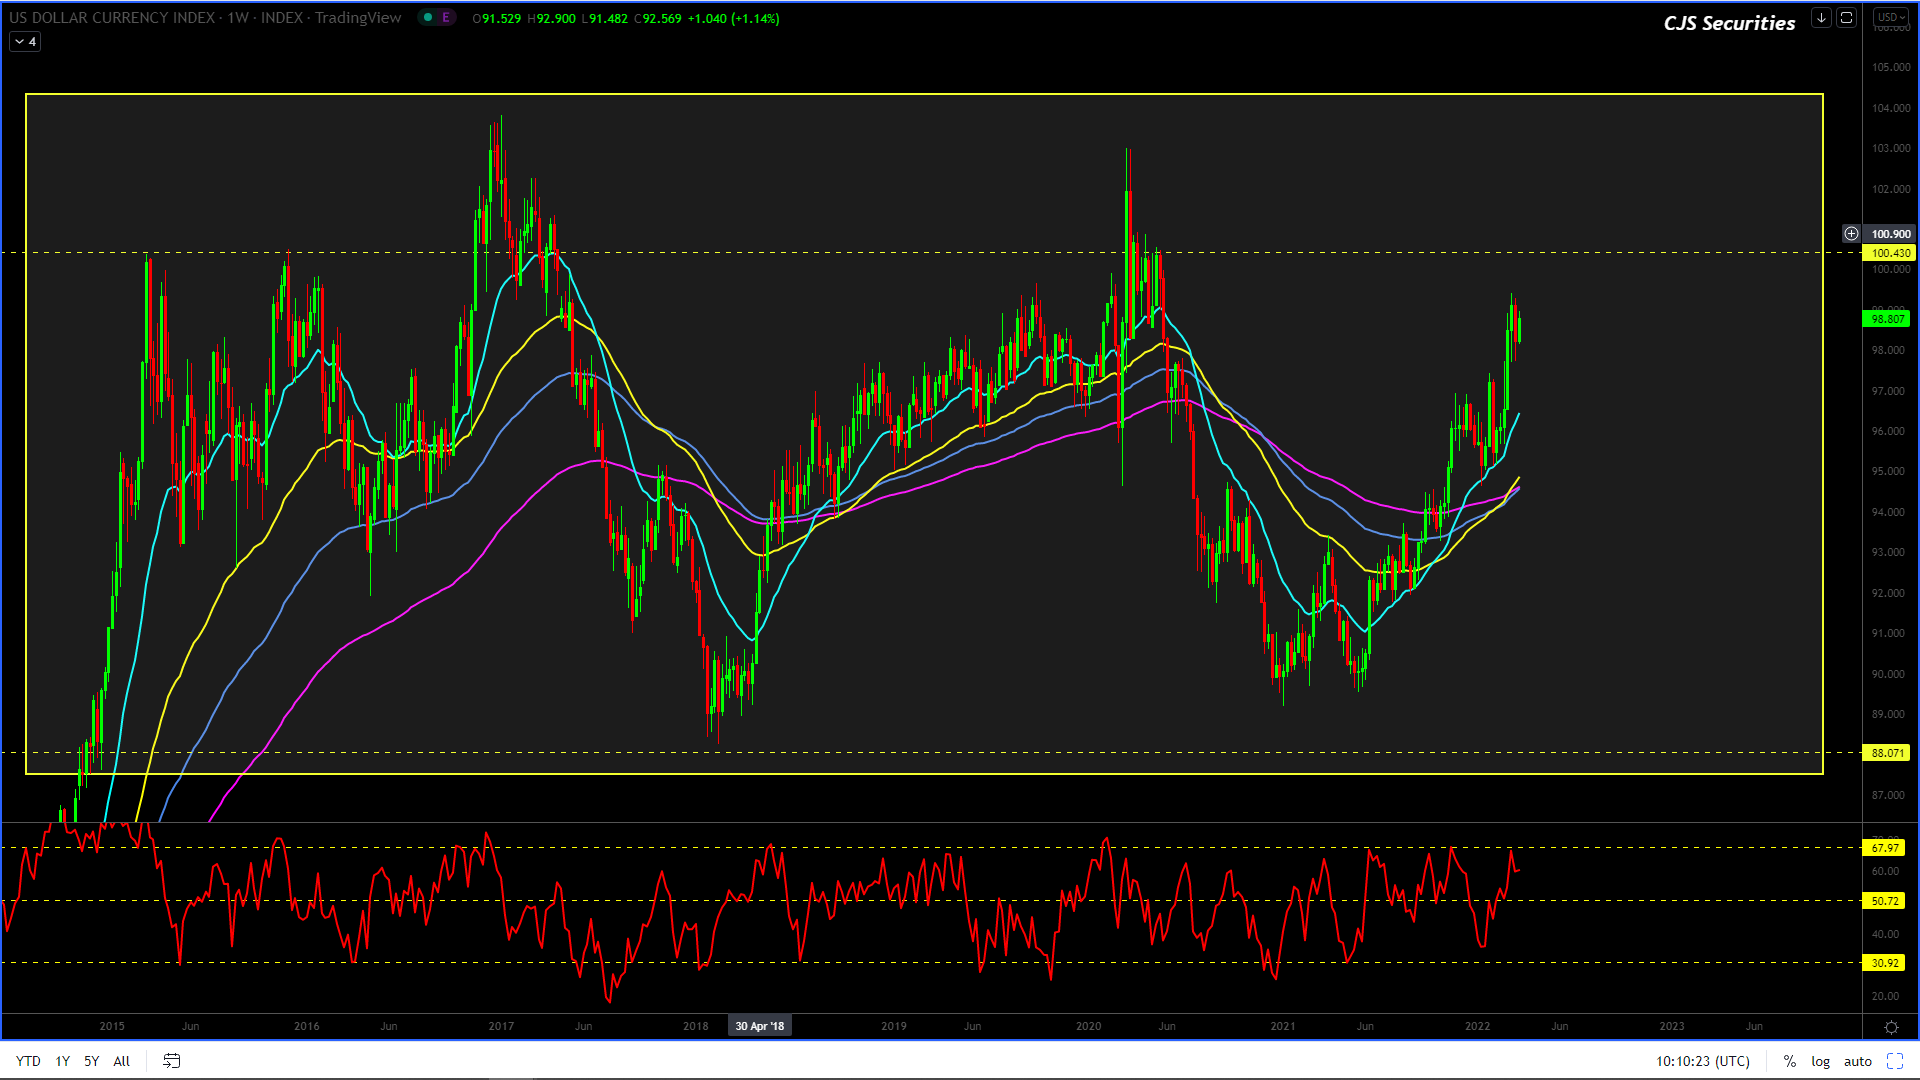
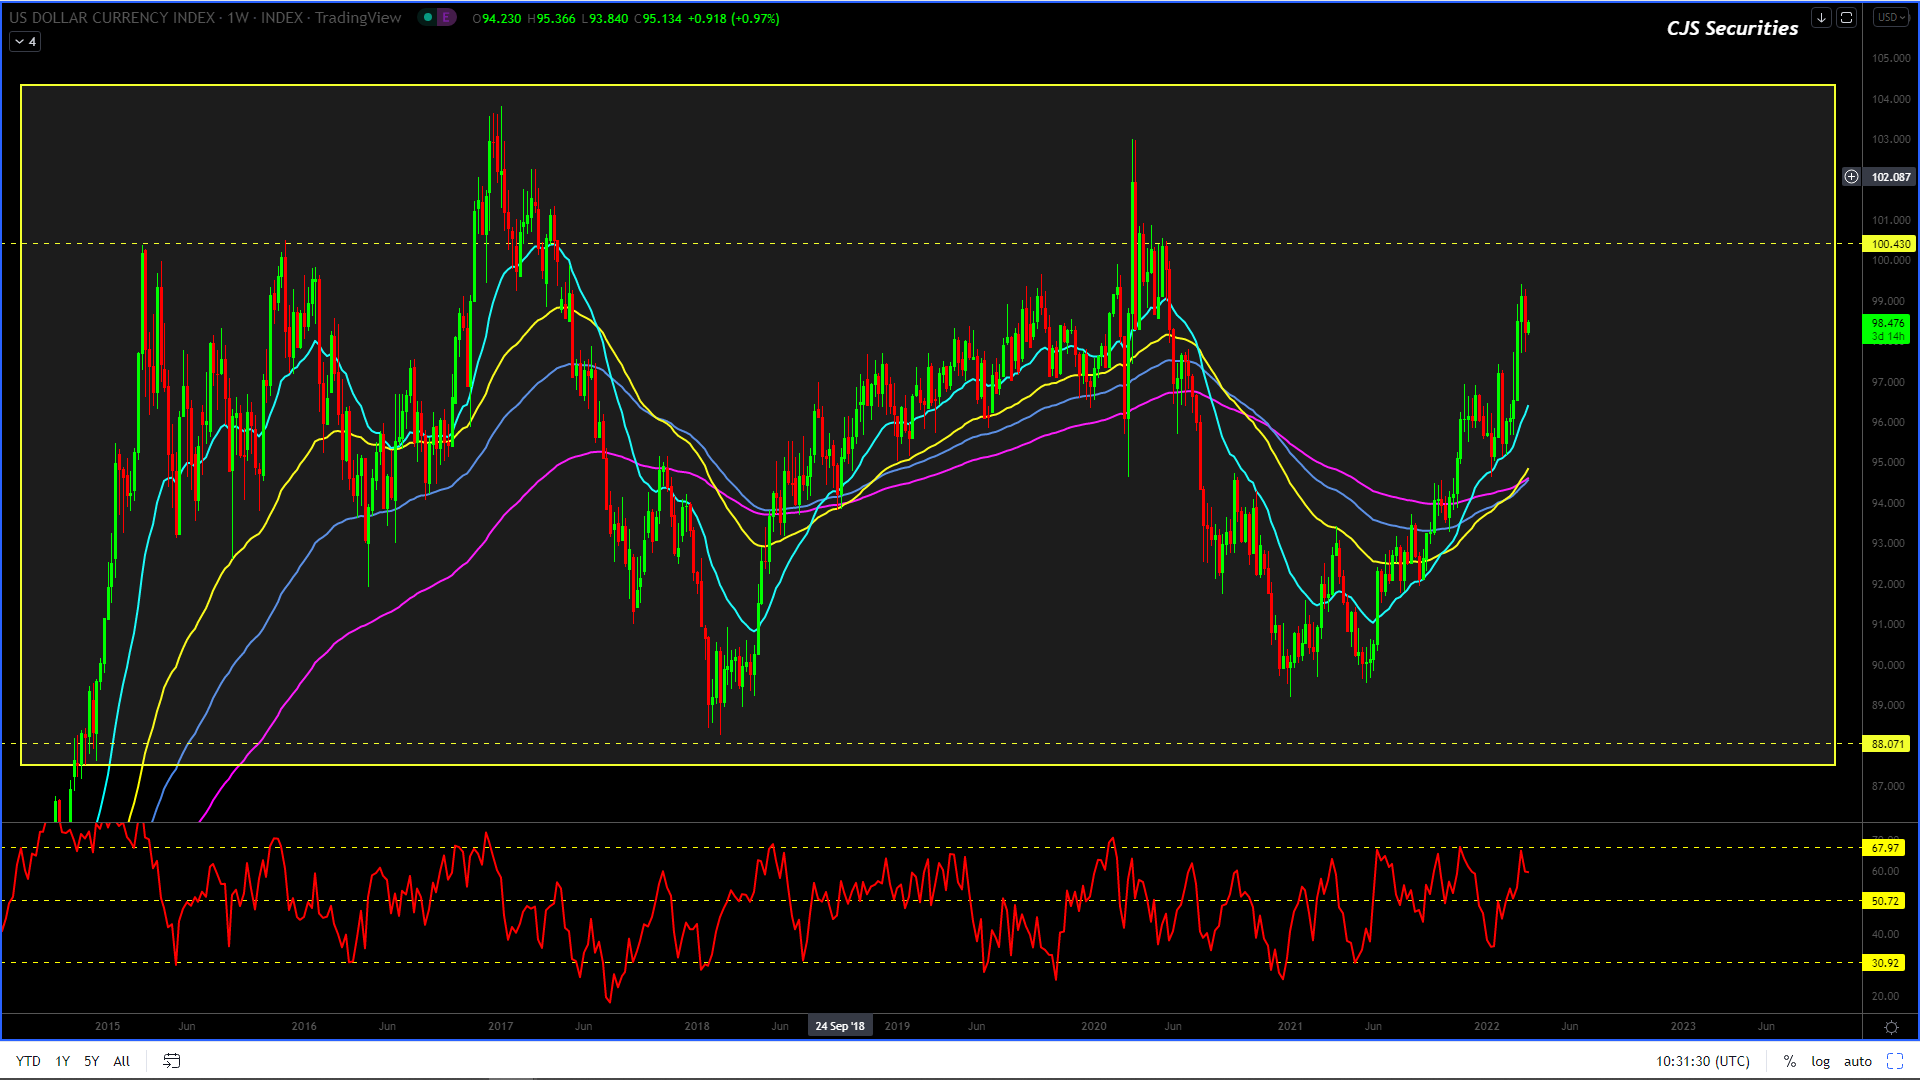
US Dollar Index Weekly Candle
#No Change in Commentary
I remain unsure of where to from here, and hence I would advise staying out, although I would say that higher looks like the ST view.
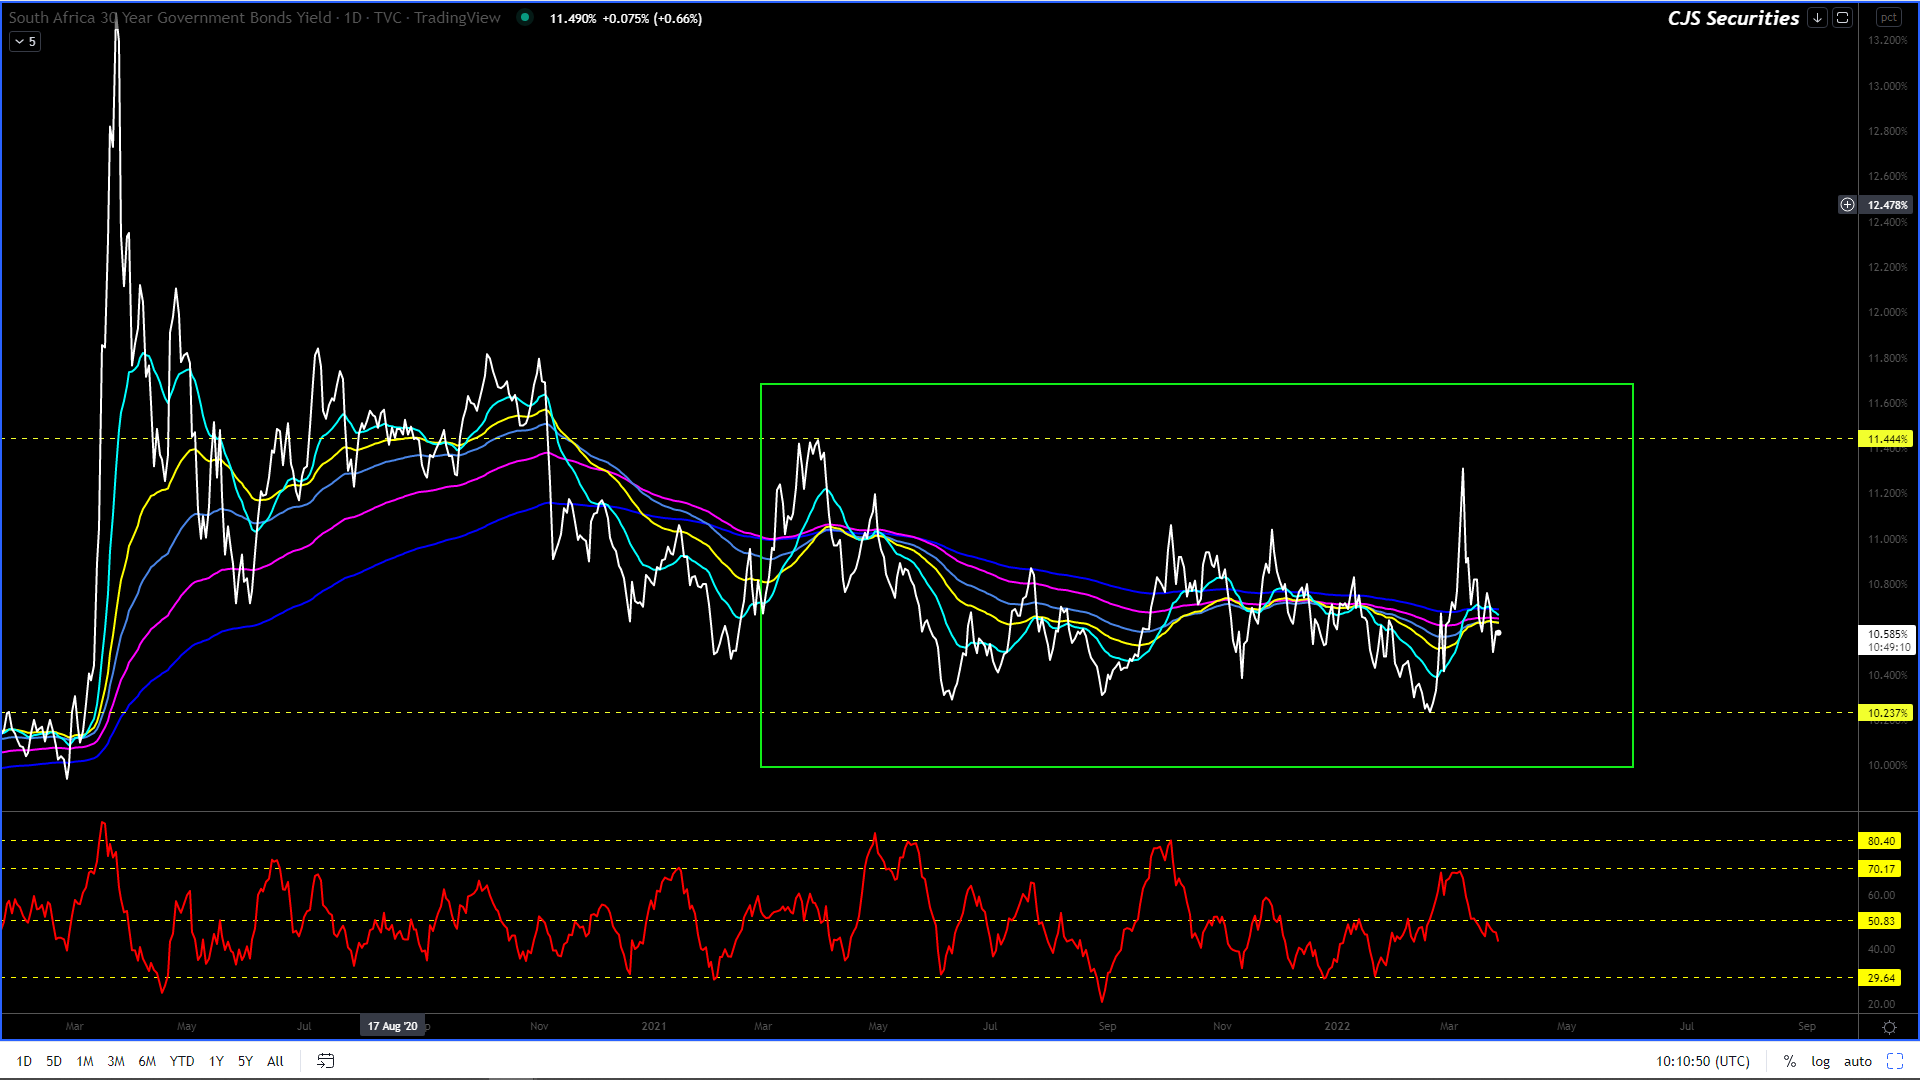
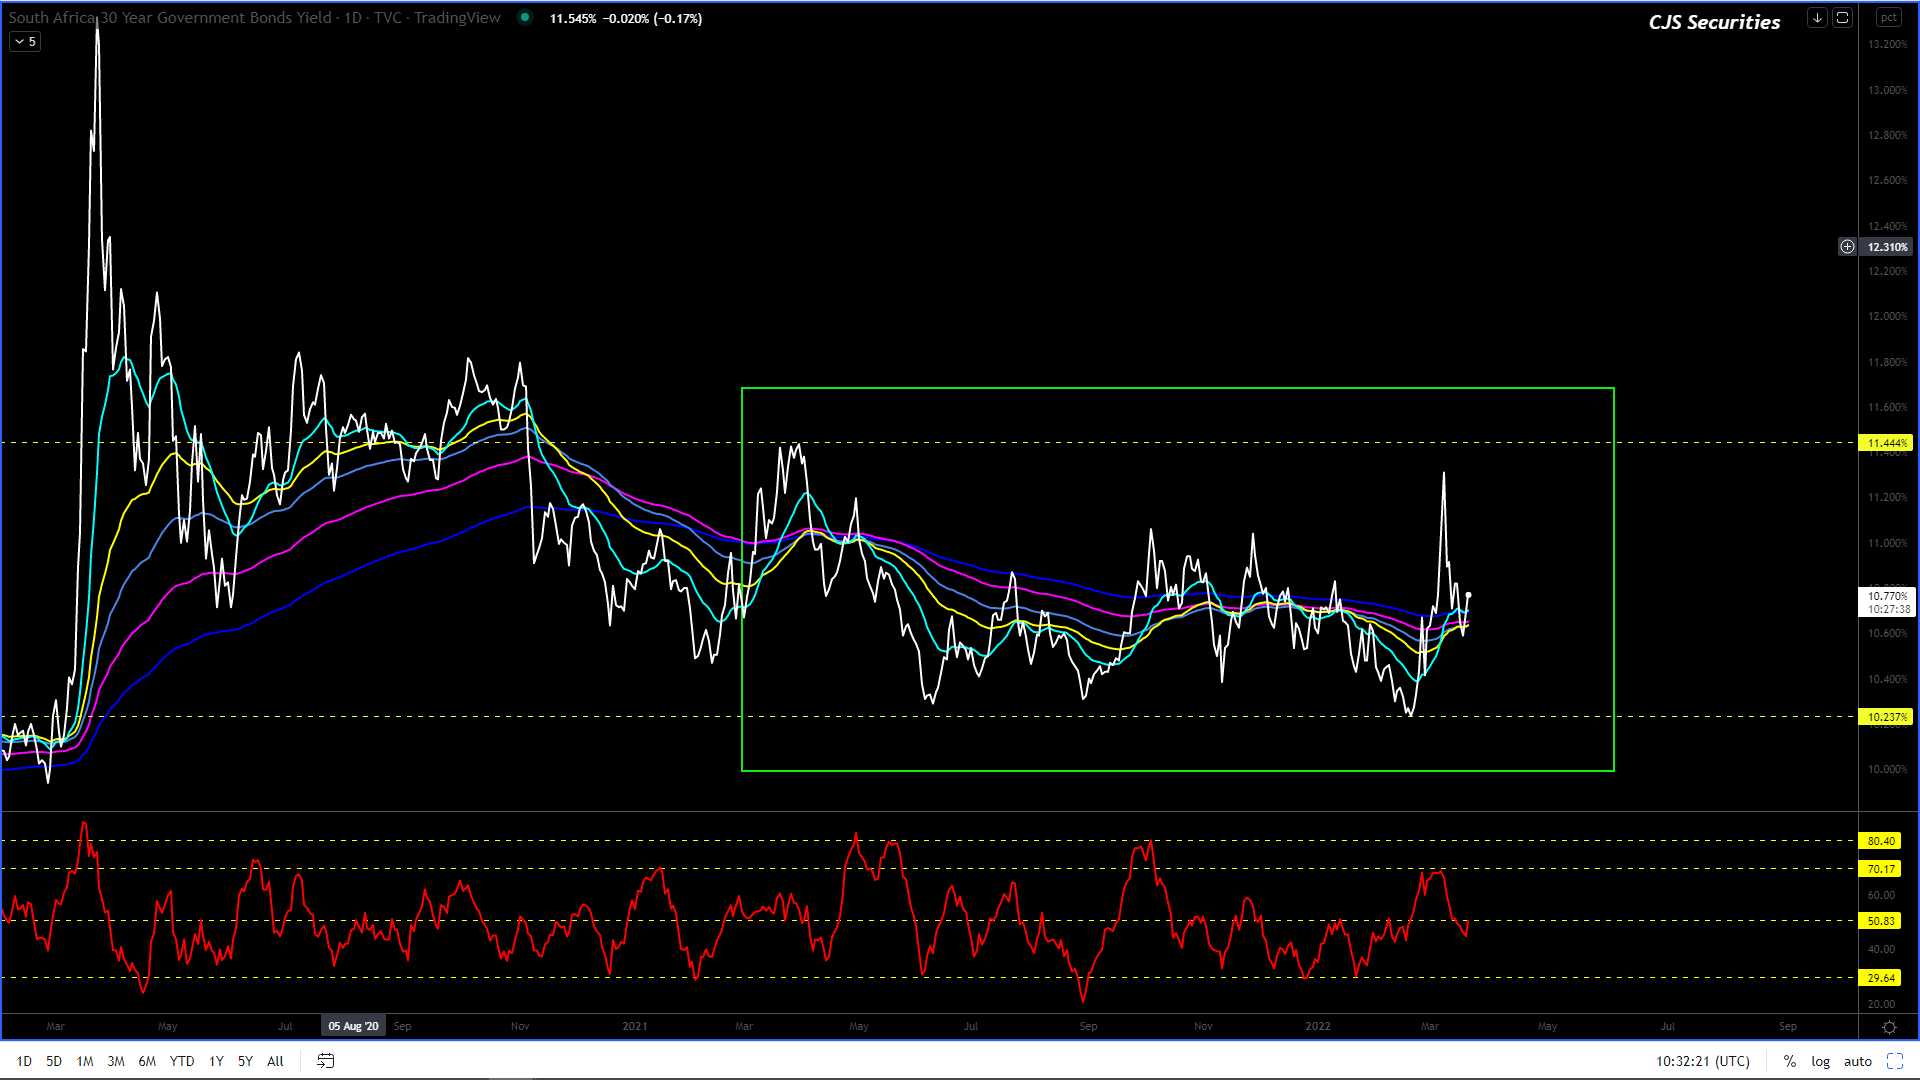
SA Government Bond 30 Year Yield Daily Close
#No Change in Commentary.
The below target level was missed with 0.08% and it could all be over bar the shouting.
The chart remains range-bound but we feel the move higher toward the top of the range at 11.40% is on the cards before looking to start a severe leg lower to sub 9.00%.
I do not want to speak too soon, but this chart may be topping out in the ST. – spoke to soon it seems.
If we are busy correcting in a greater bull market then we could be headed down toward the $15.25 as a target.
Although we are in the throws of a raging bull market I will be patiently waiting to get long as sometimes these pullbacks go deeper than most anticipate.
240 Min CBOT May 22 Soybean Candle Chart
#No Change in Commentary
The 240 min chart is clearly busy making a correction.
This correction could trade as low as $15.40 in the coming weeks.
Board Crush Continuous Daily Close
There is nothing much to do here unless you are a professional “Top or Bottom picker” and according to my knowledge they are all dead.
Oil Share Continuous Daily Close
We are now happy to sit out and see how the market plays out overtime.
Weekly SAF Soy Continuous Close
#No Change in Commentary
There is no reason to sell this chart!
Now is the time to sit back and wait for the next opportunity.
Weekly SAF Suns Continuous Close
Technically there is nothing to do based on the charts current formation, other than wait patiently for a pullback to get long!
Weekly CBOT Soy Oil Continuous Close
I feel that the time has come to consolidate and wait for a pullback to get long again.
Weekly CBOT SBM Continuous Close
Nothing
has changed on the weekly chart, but we are happy to stay out until further
notice.
This
chart, however, could continue to rally from here!
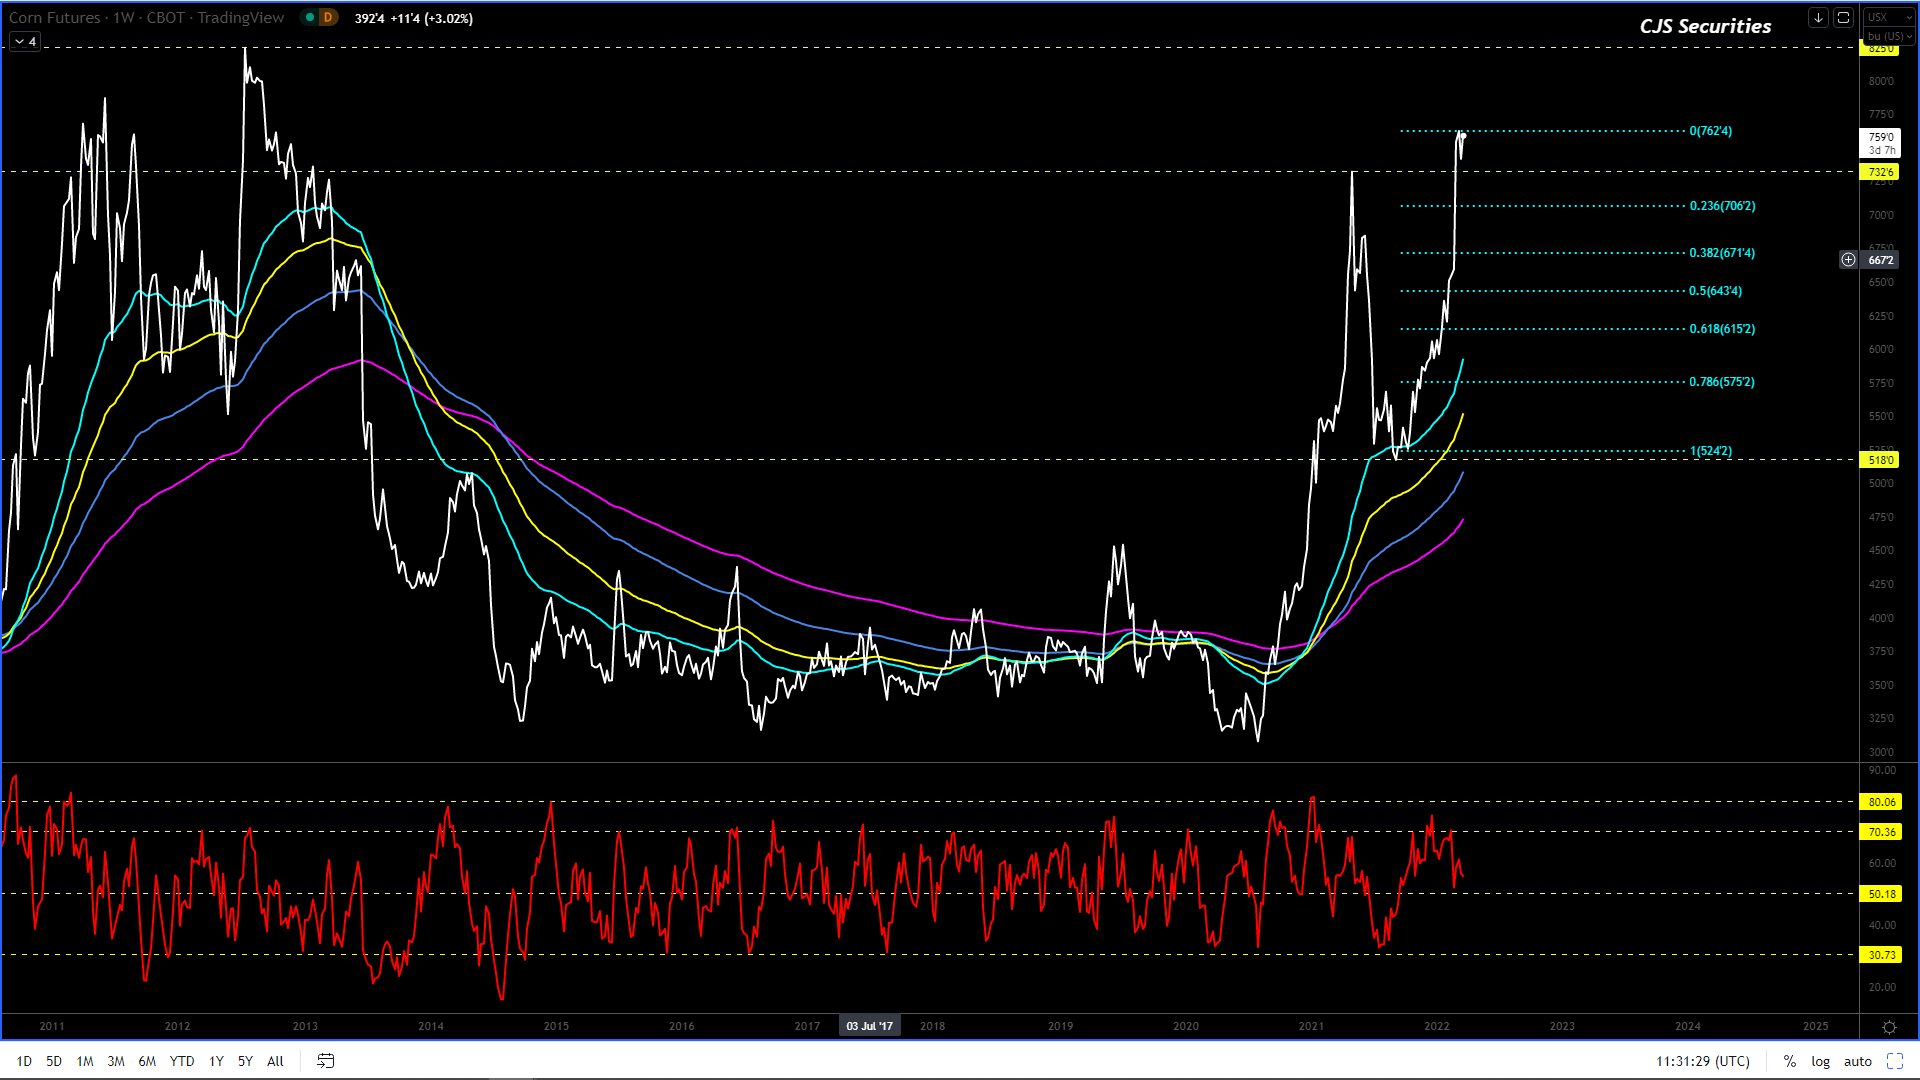
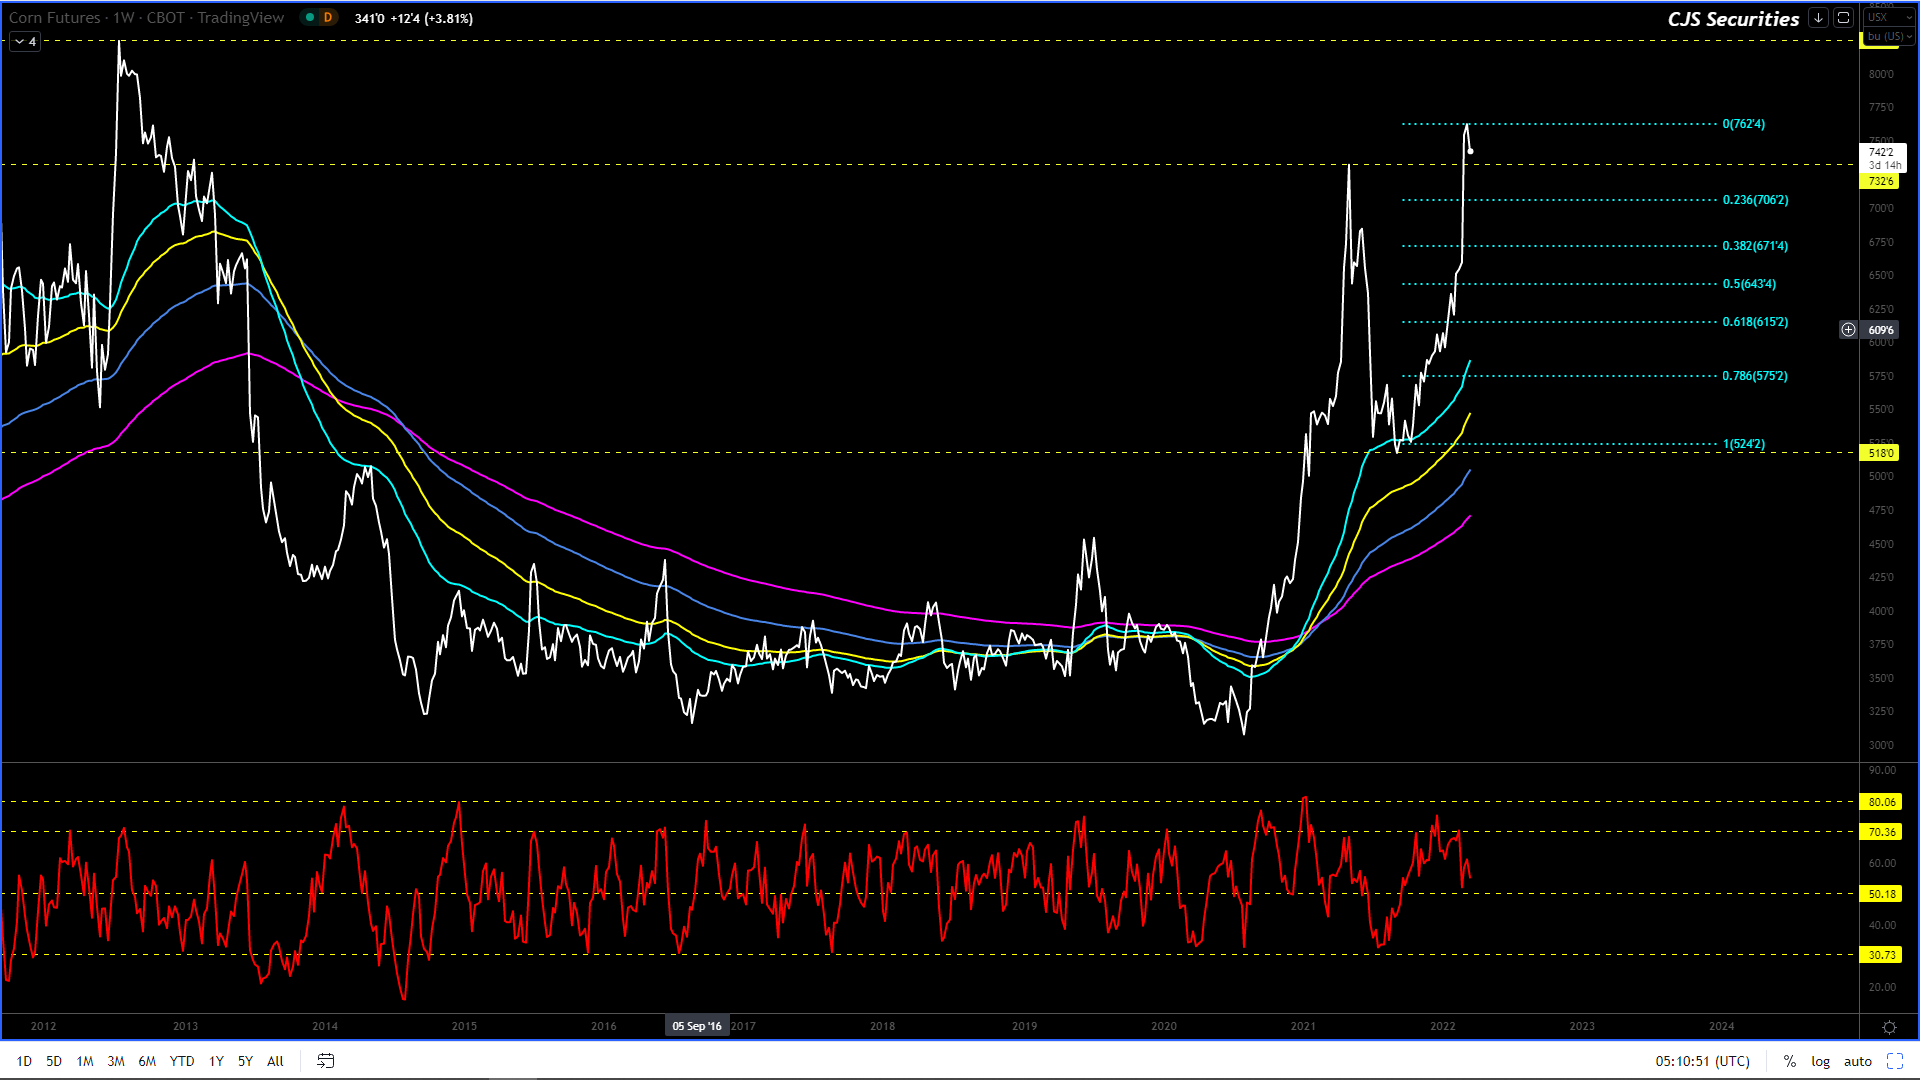
As a whole this chart
needs a decent correction after a rally of epic proportion.
I am looking for this
chart to pullback to around the $6.72level in the coming weeks.
This is in no way
a bear market, but rather a
correction in a greater bull market.
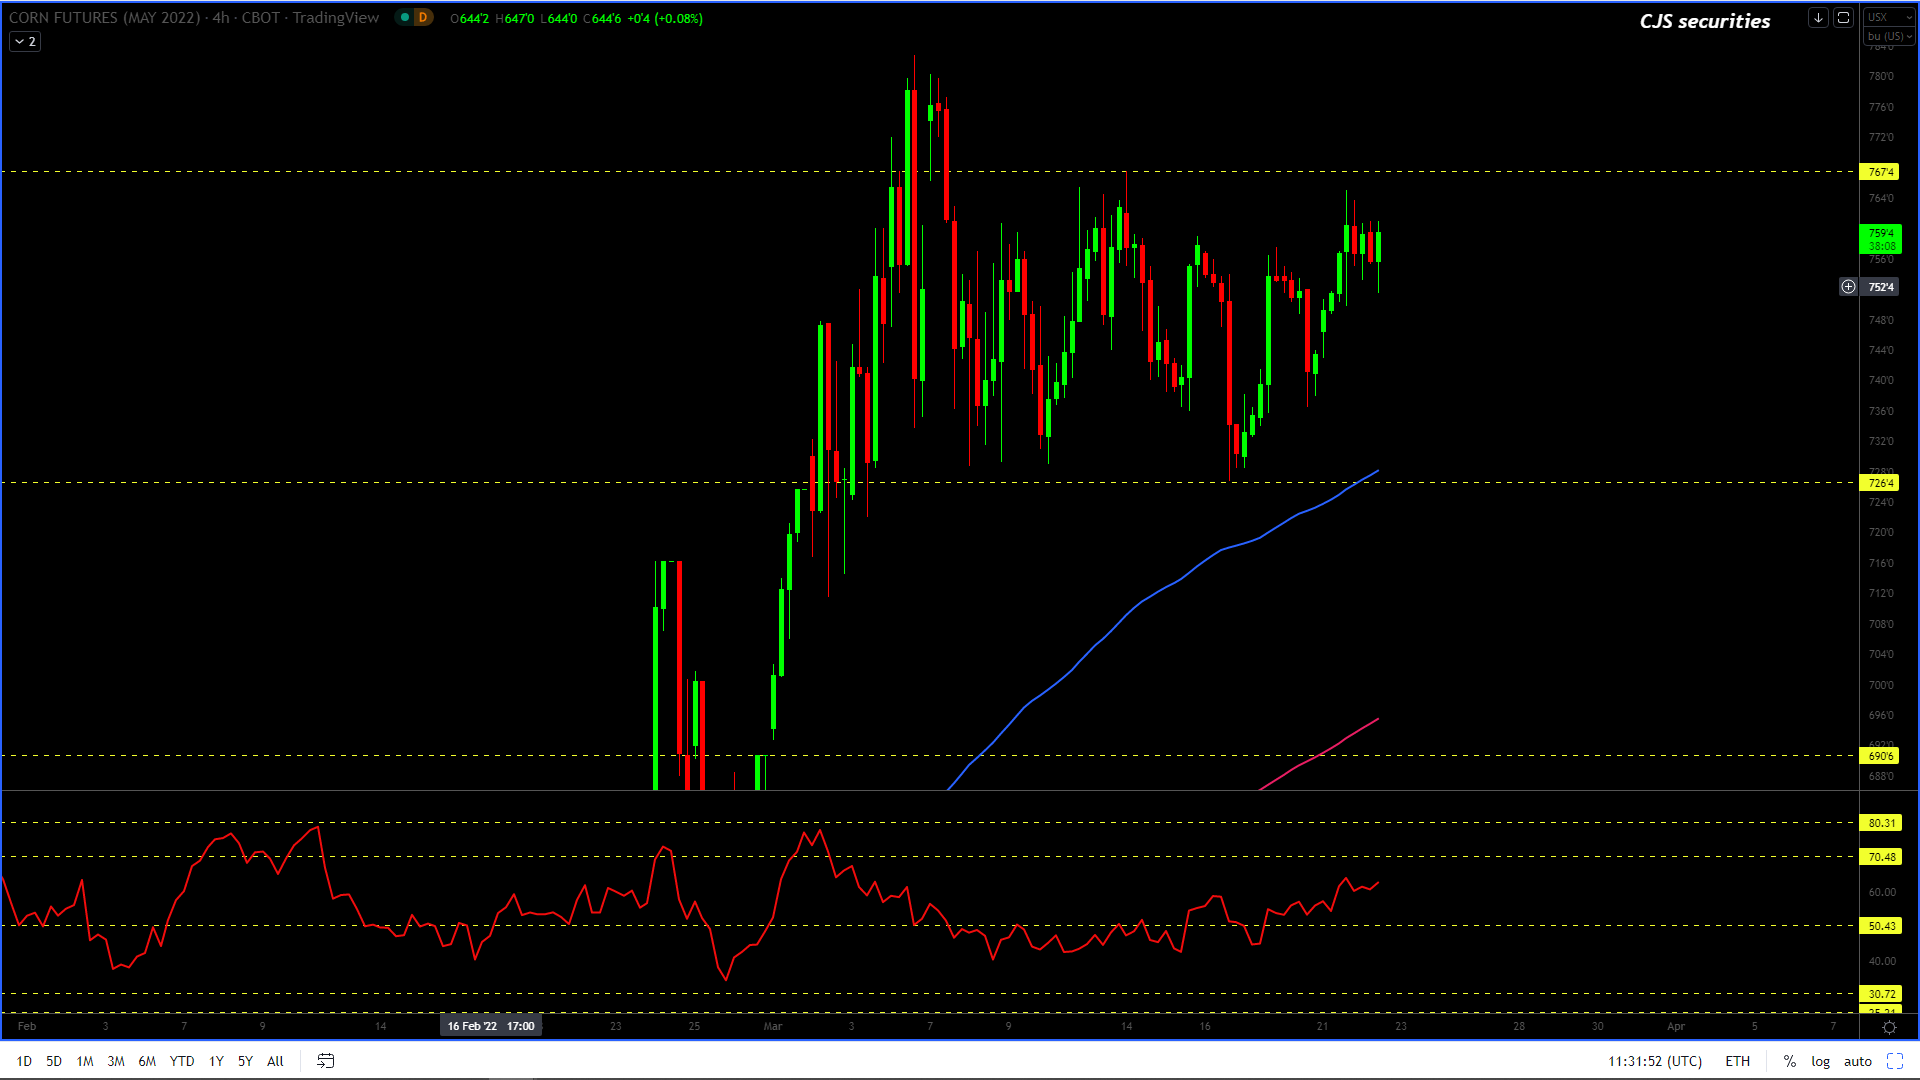
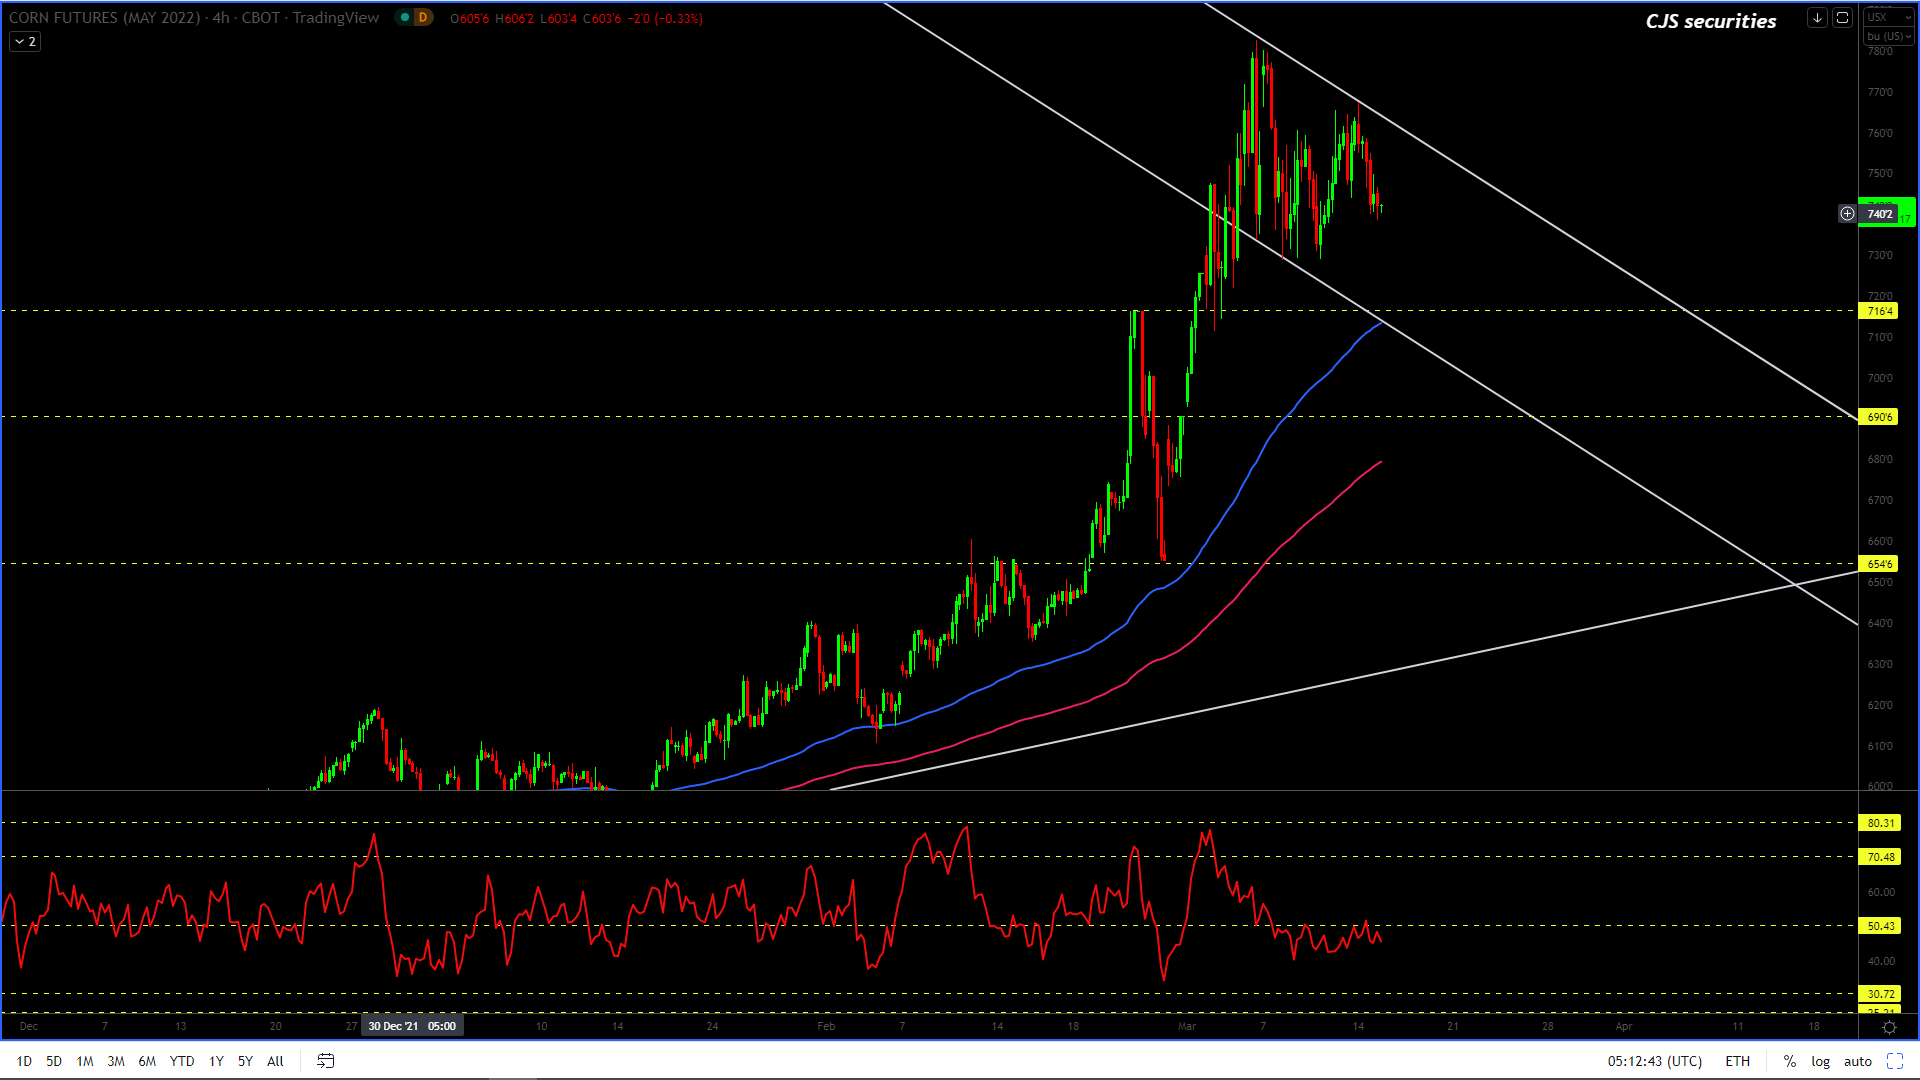
240 Min May22 Corn Candle Chart Close
The 240 min chart is now ugly (this indicates correction) and even though it could make new highs I feel they will be short lived and I still fancy downside targets of between $7.16 -$7.05.
I would be very wary of all these markets as a peace deal even if only a short term deal, will lead to a sentiment change.
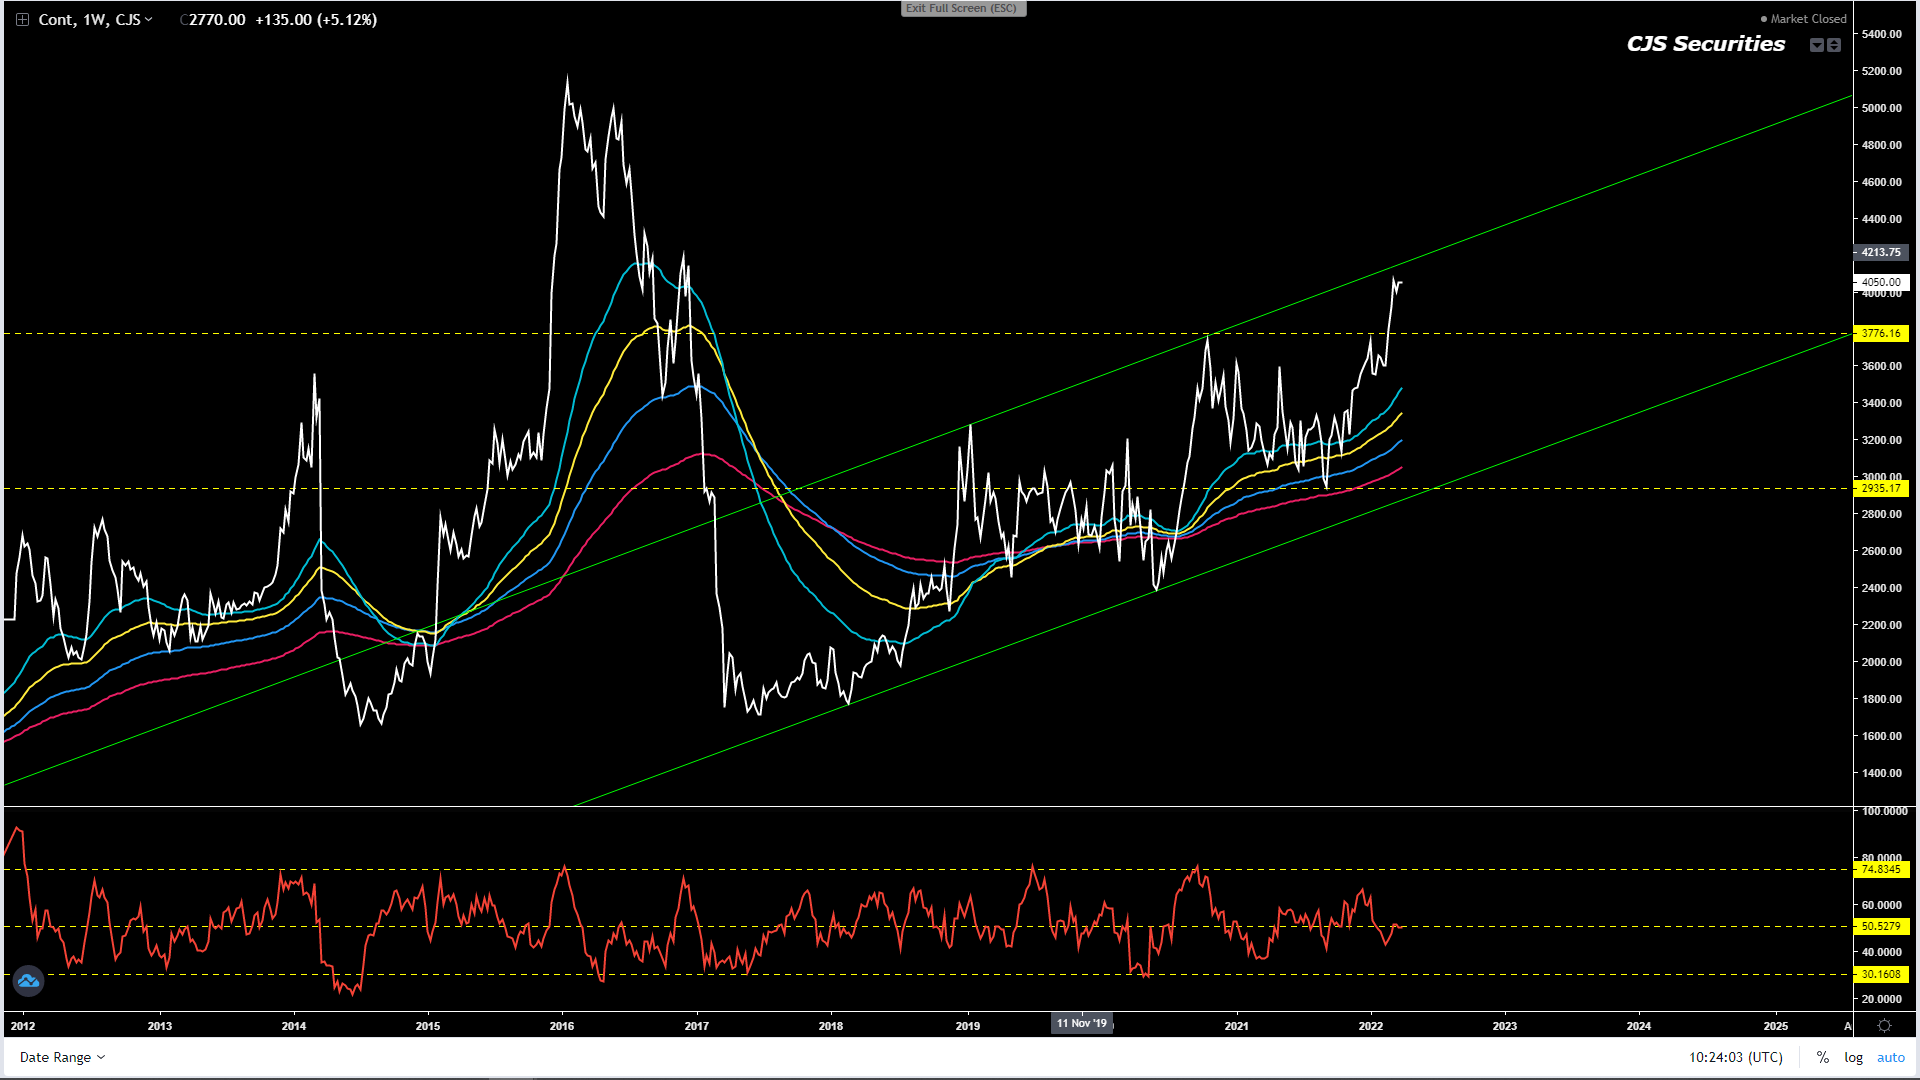
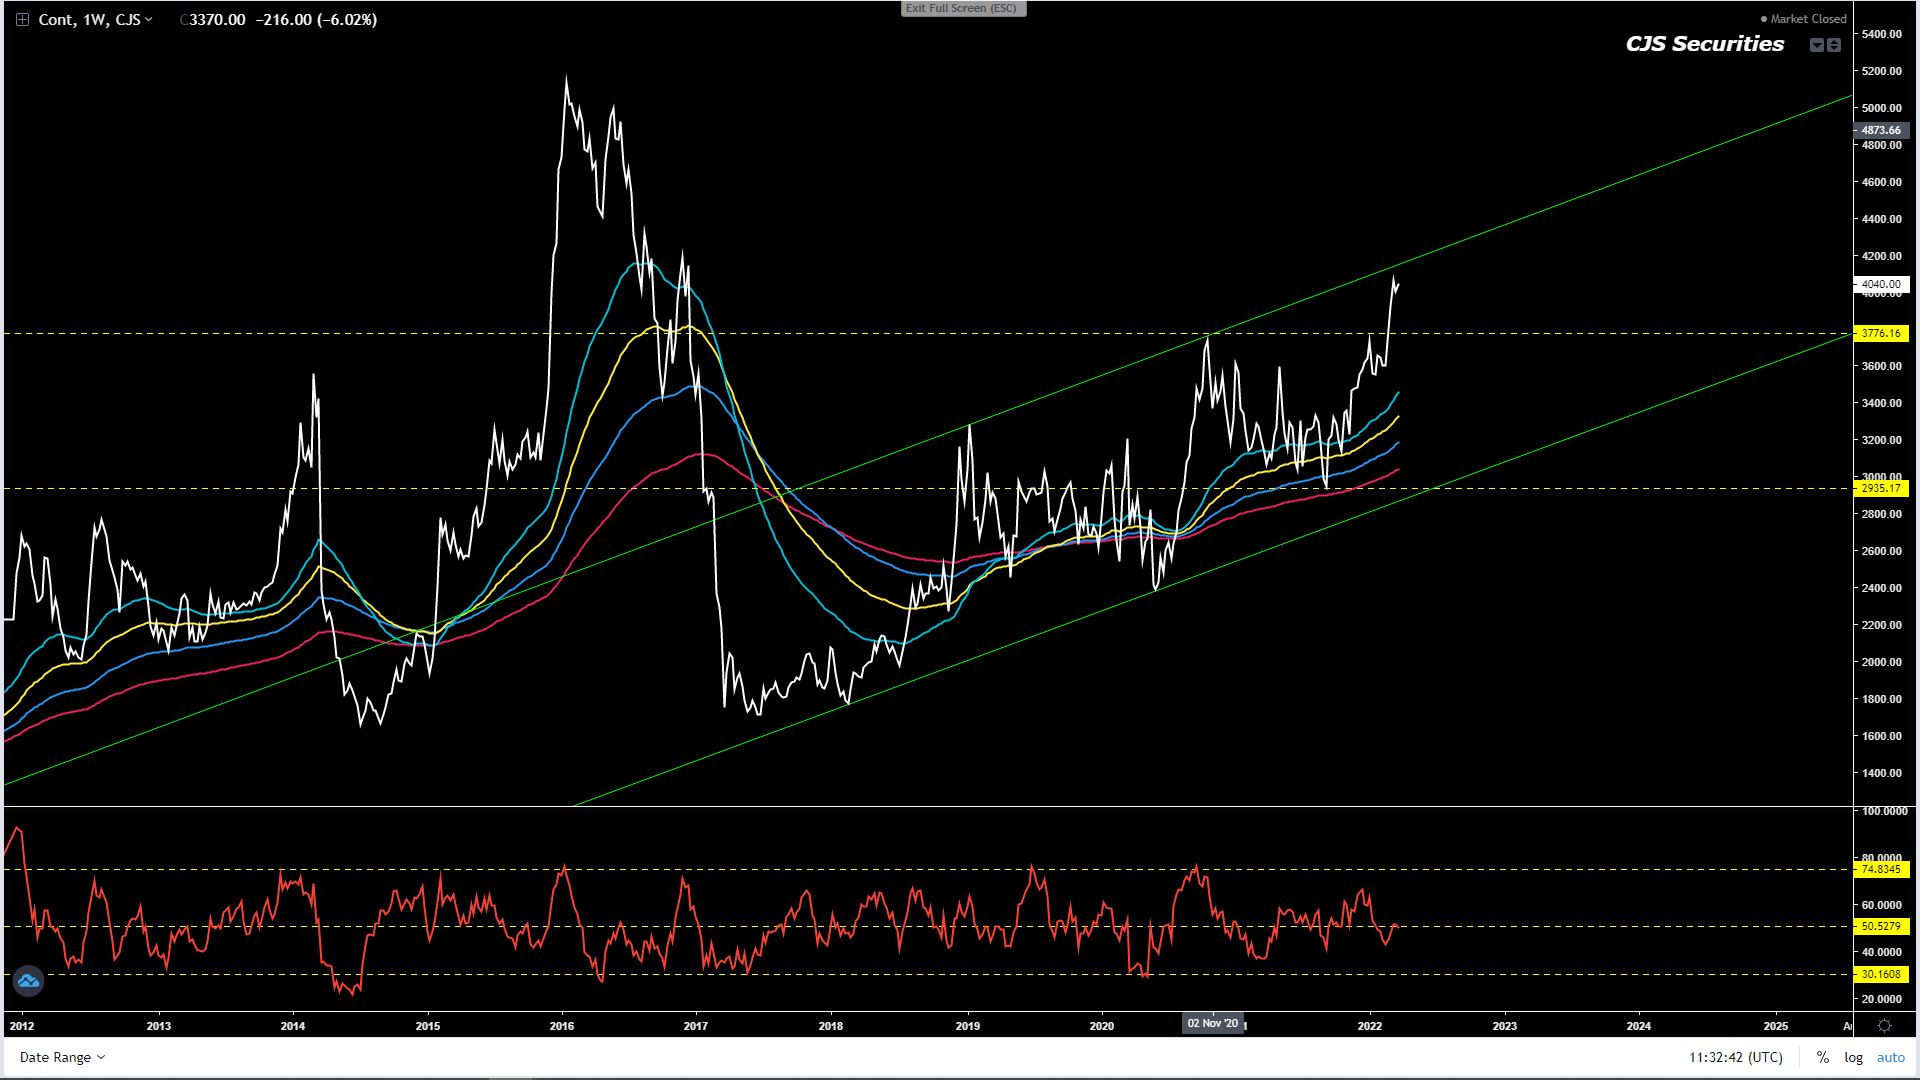
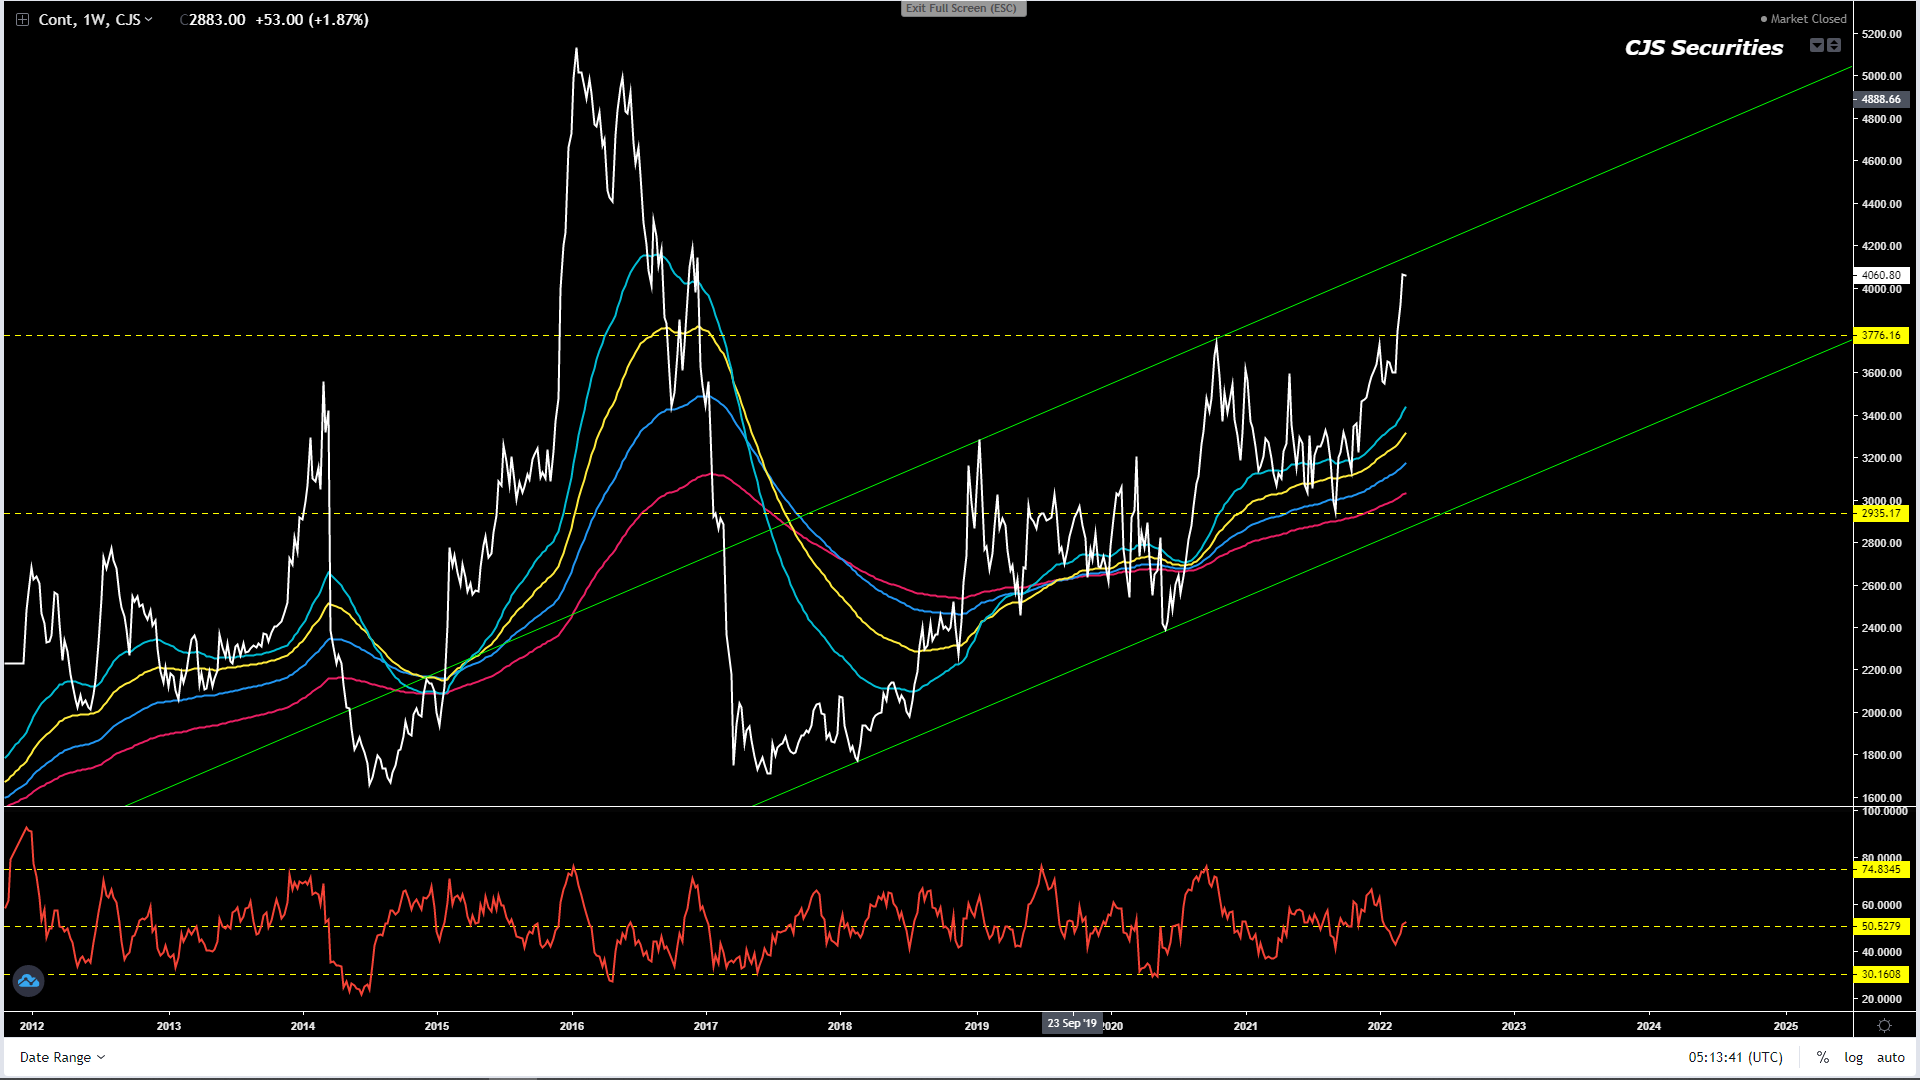
Weekly WM Continuous Close
#No Change in Commentary
I can’t find a reason to be short this chart with only the top of the channel providing some resistance.
I have no strong views other than to urge producers to price as anything can happen.
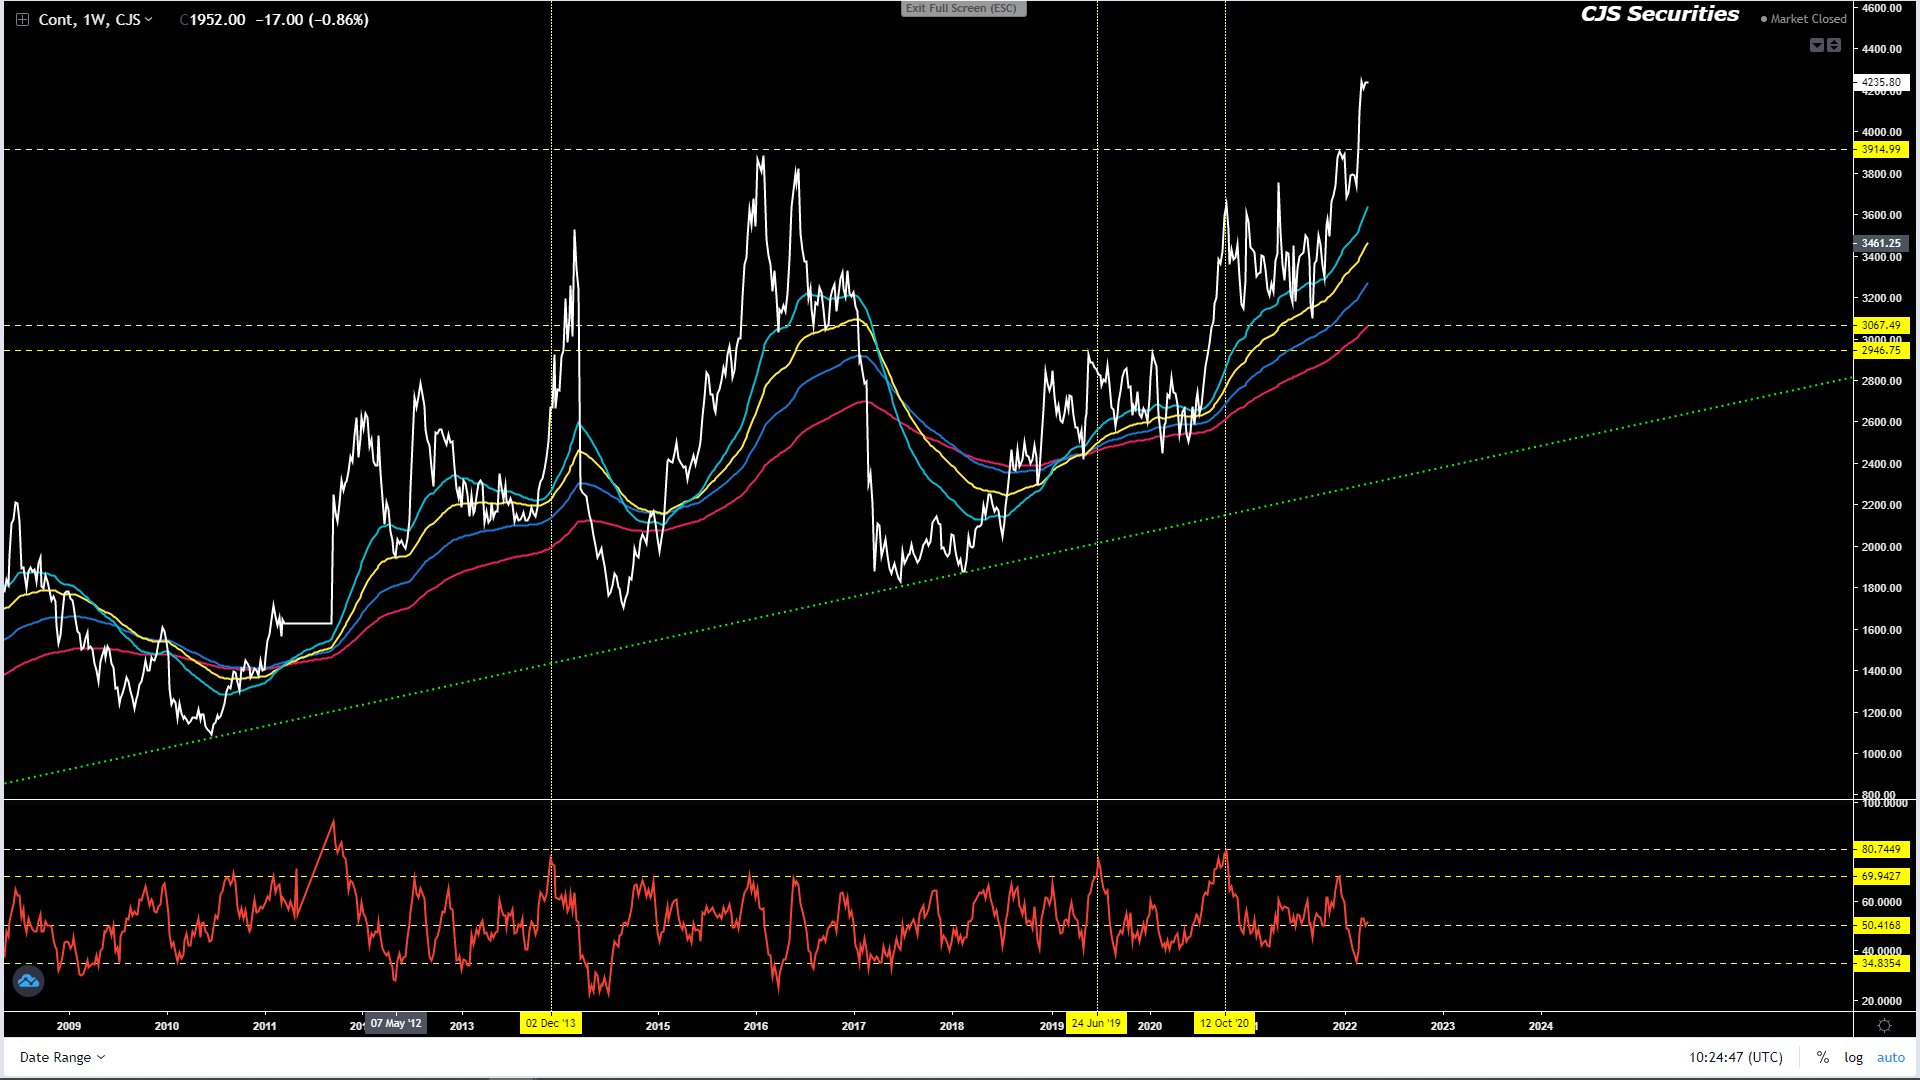
Weekly YM Continuous Close
#No Change in Commentary
At ATH’s I cannot find a reason to sell this chart at all or pick tops.
I have no strong views other than to urge producers to price as anything can happen.
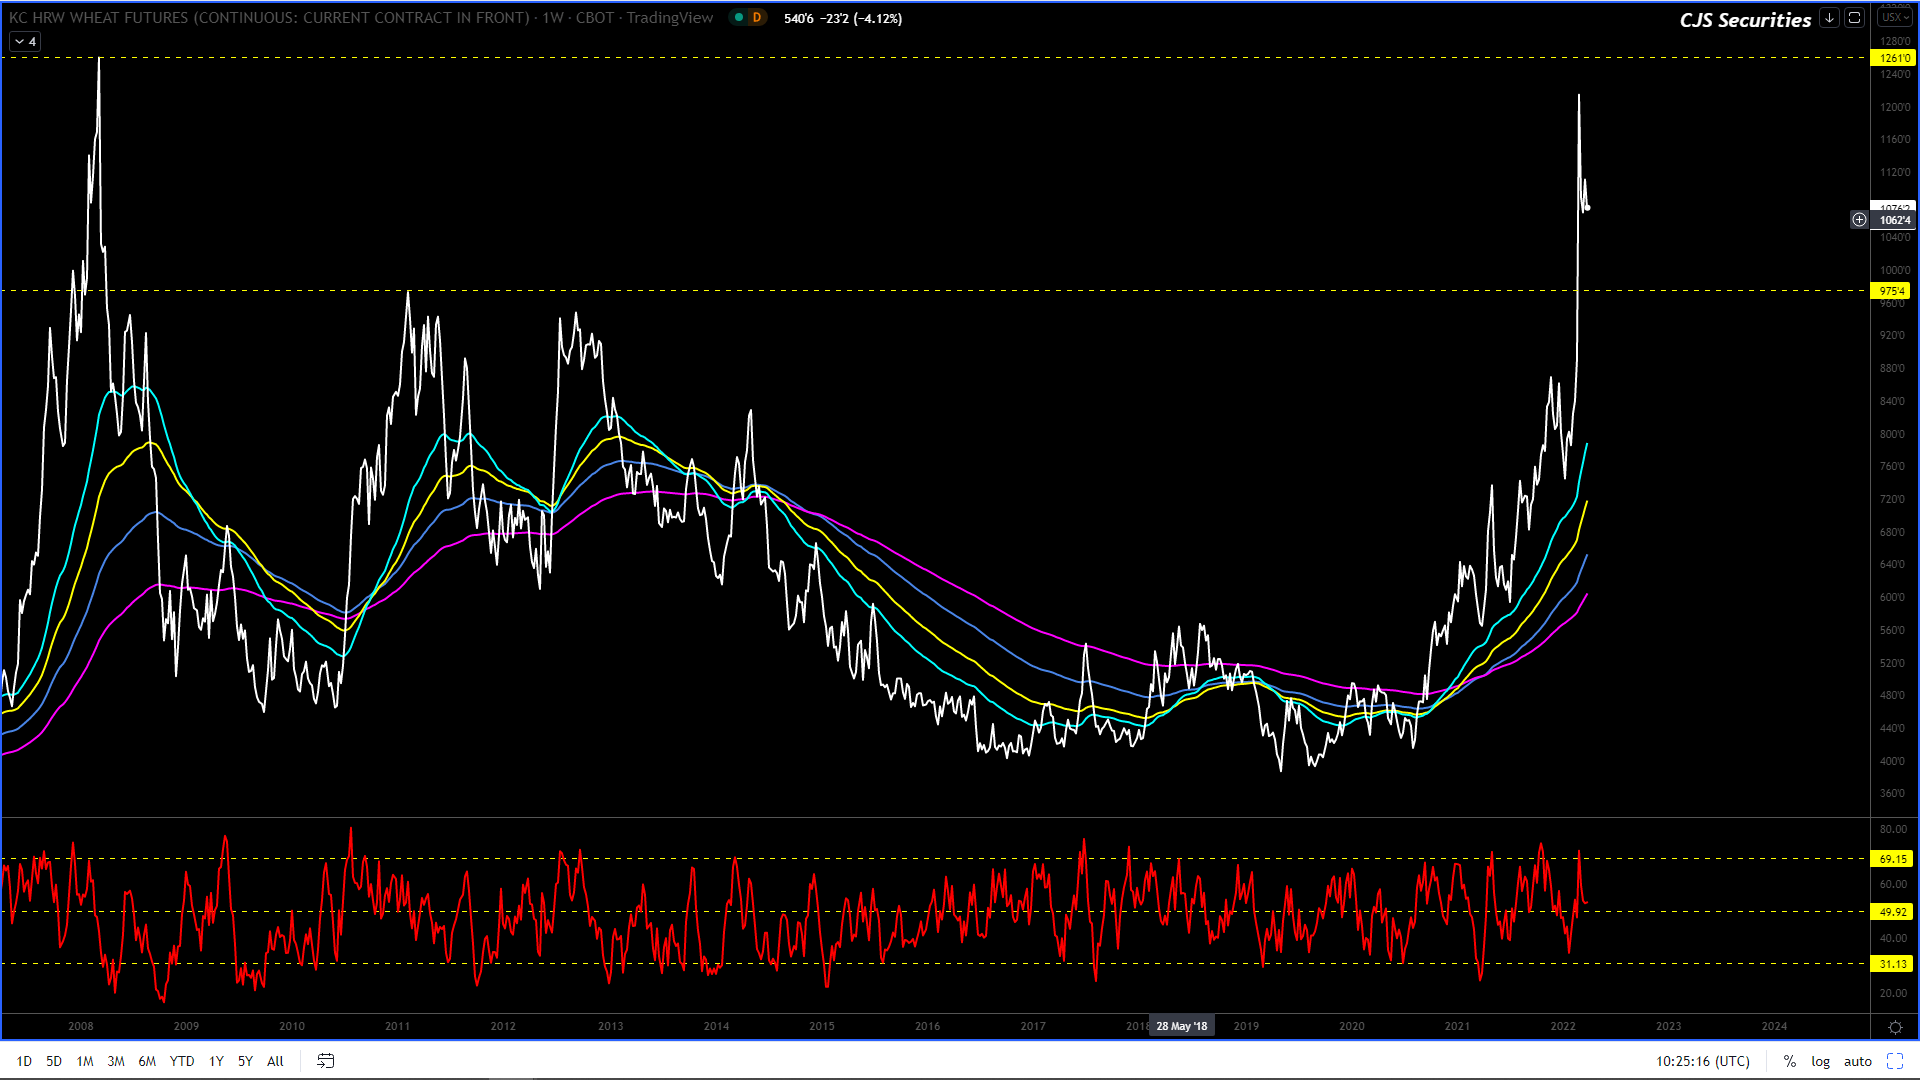
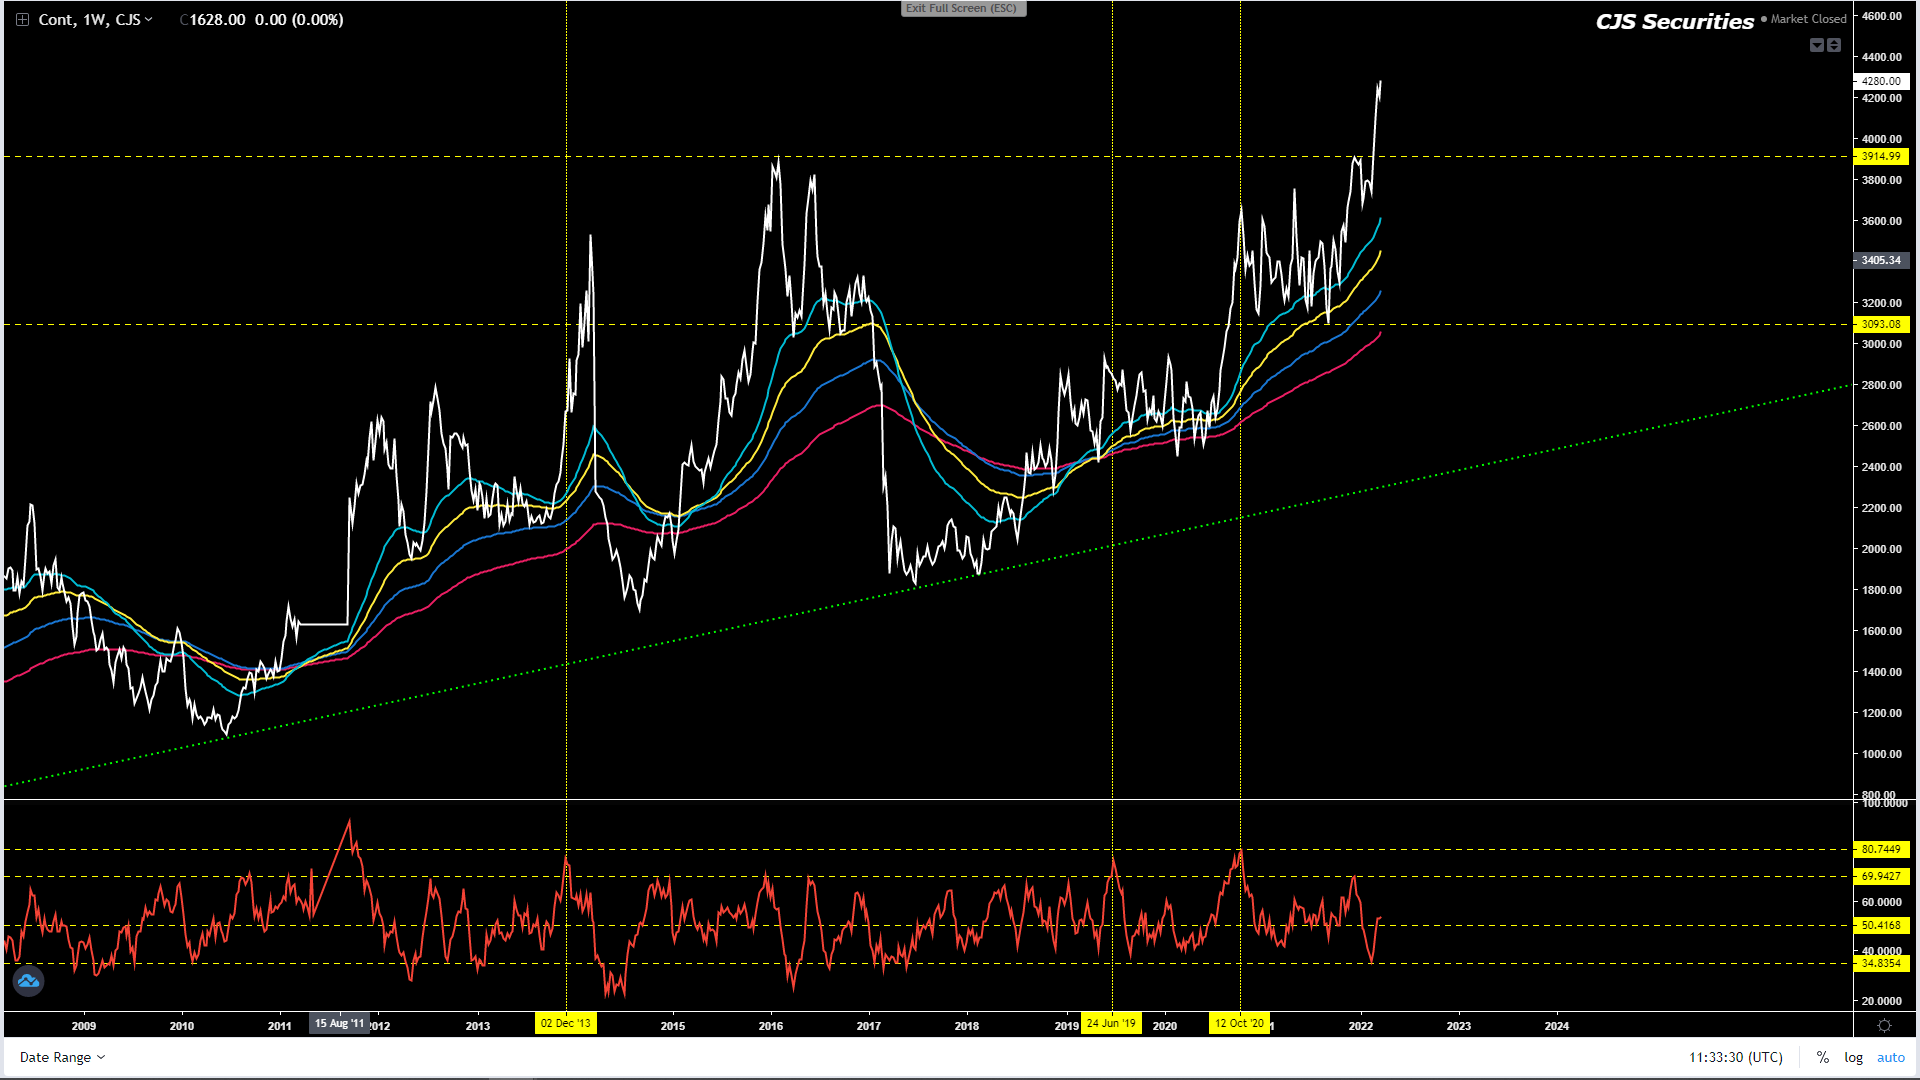
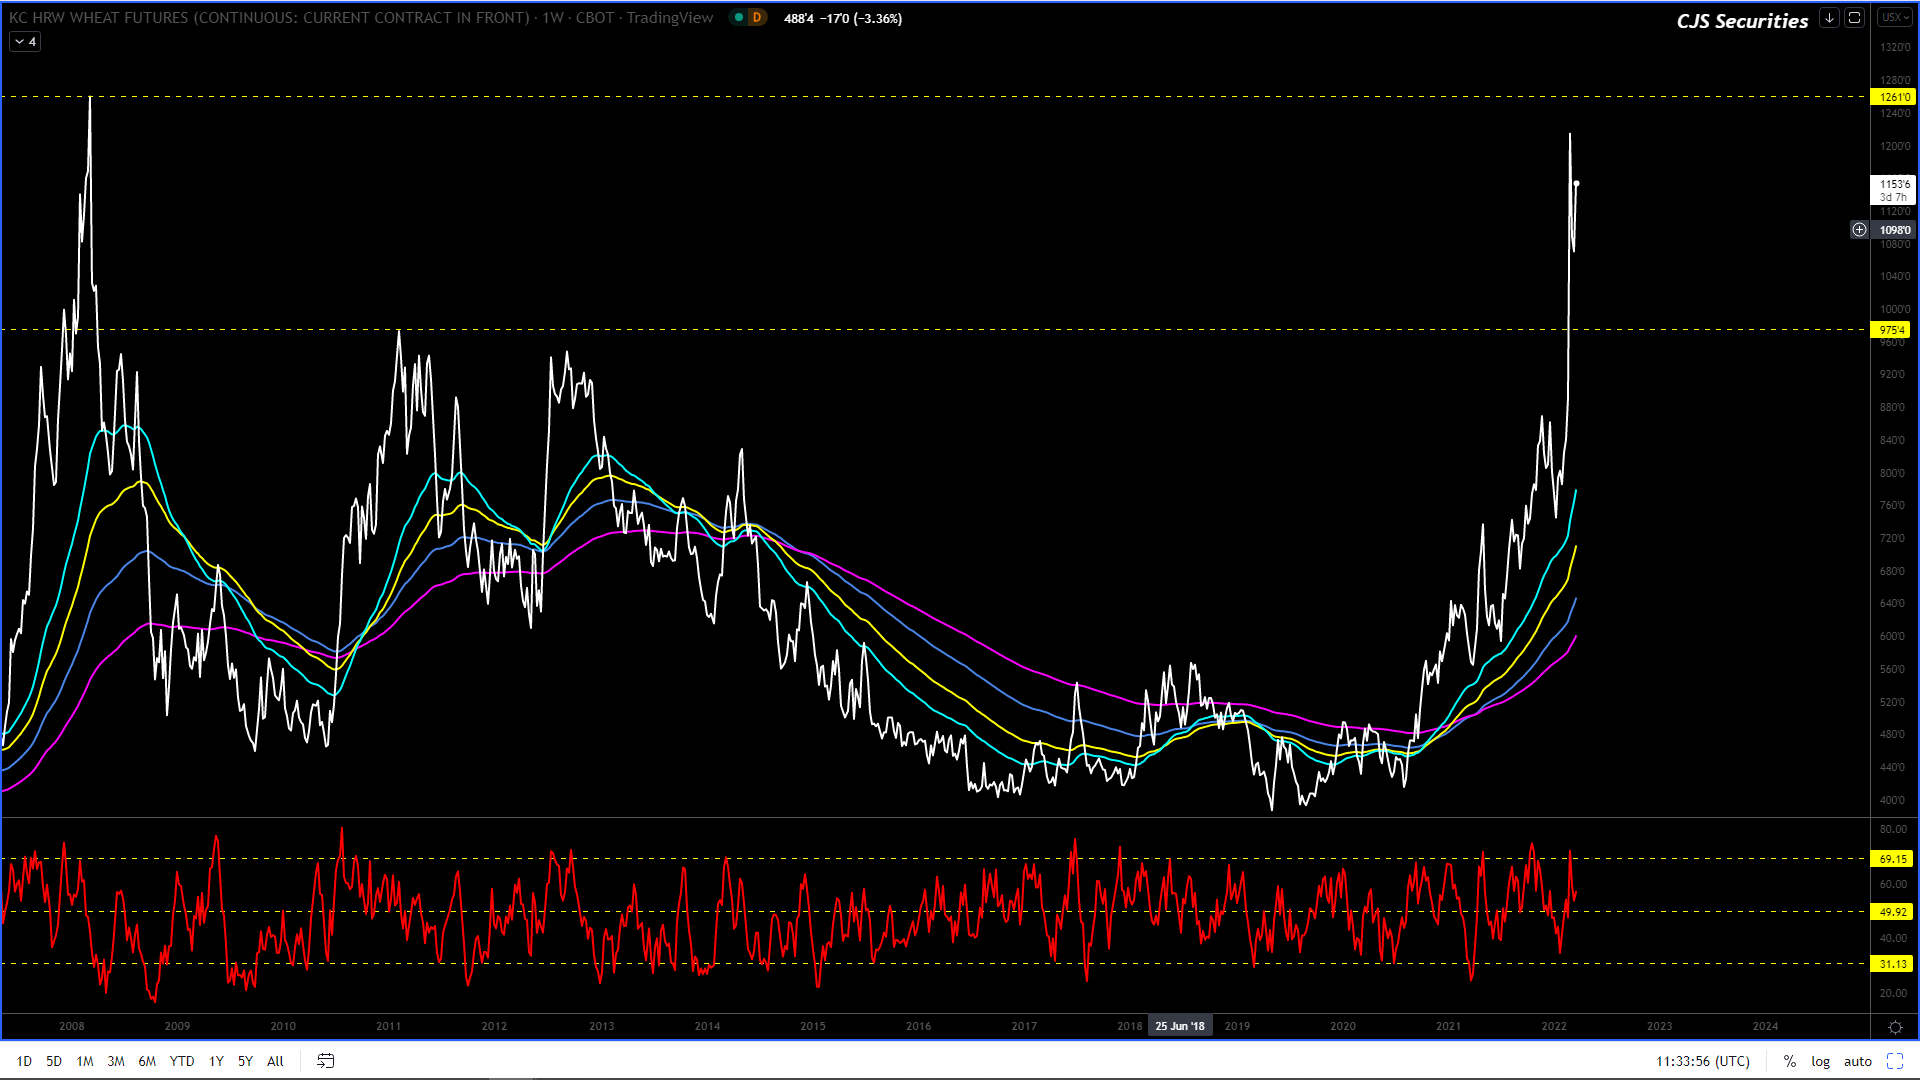
Weekly KC Wheat Continuous Close
#No Change in Commentary
Wheat has been the wildest of rides and the market now appears to be well into its corrective phase.
Stay out until further notice.
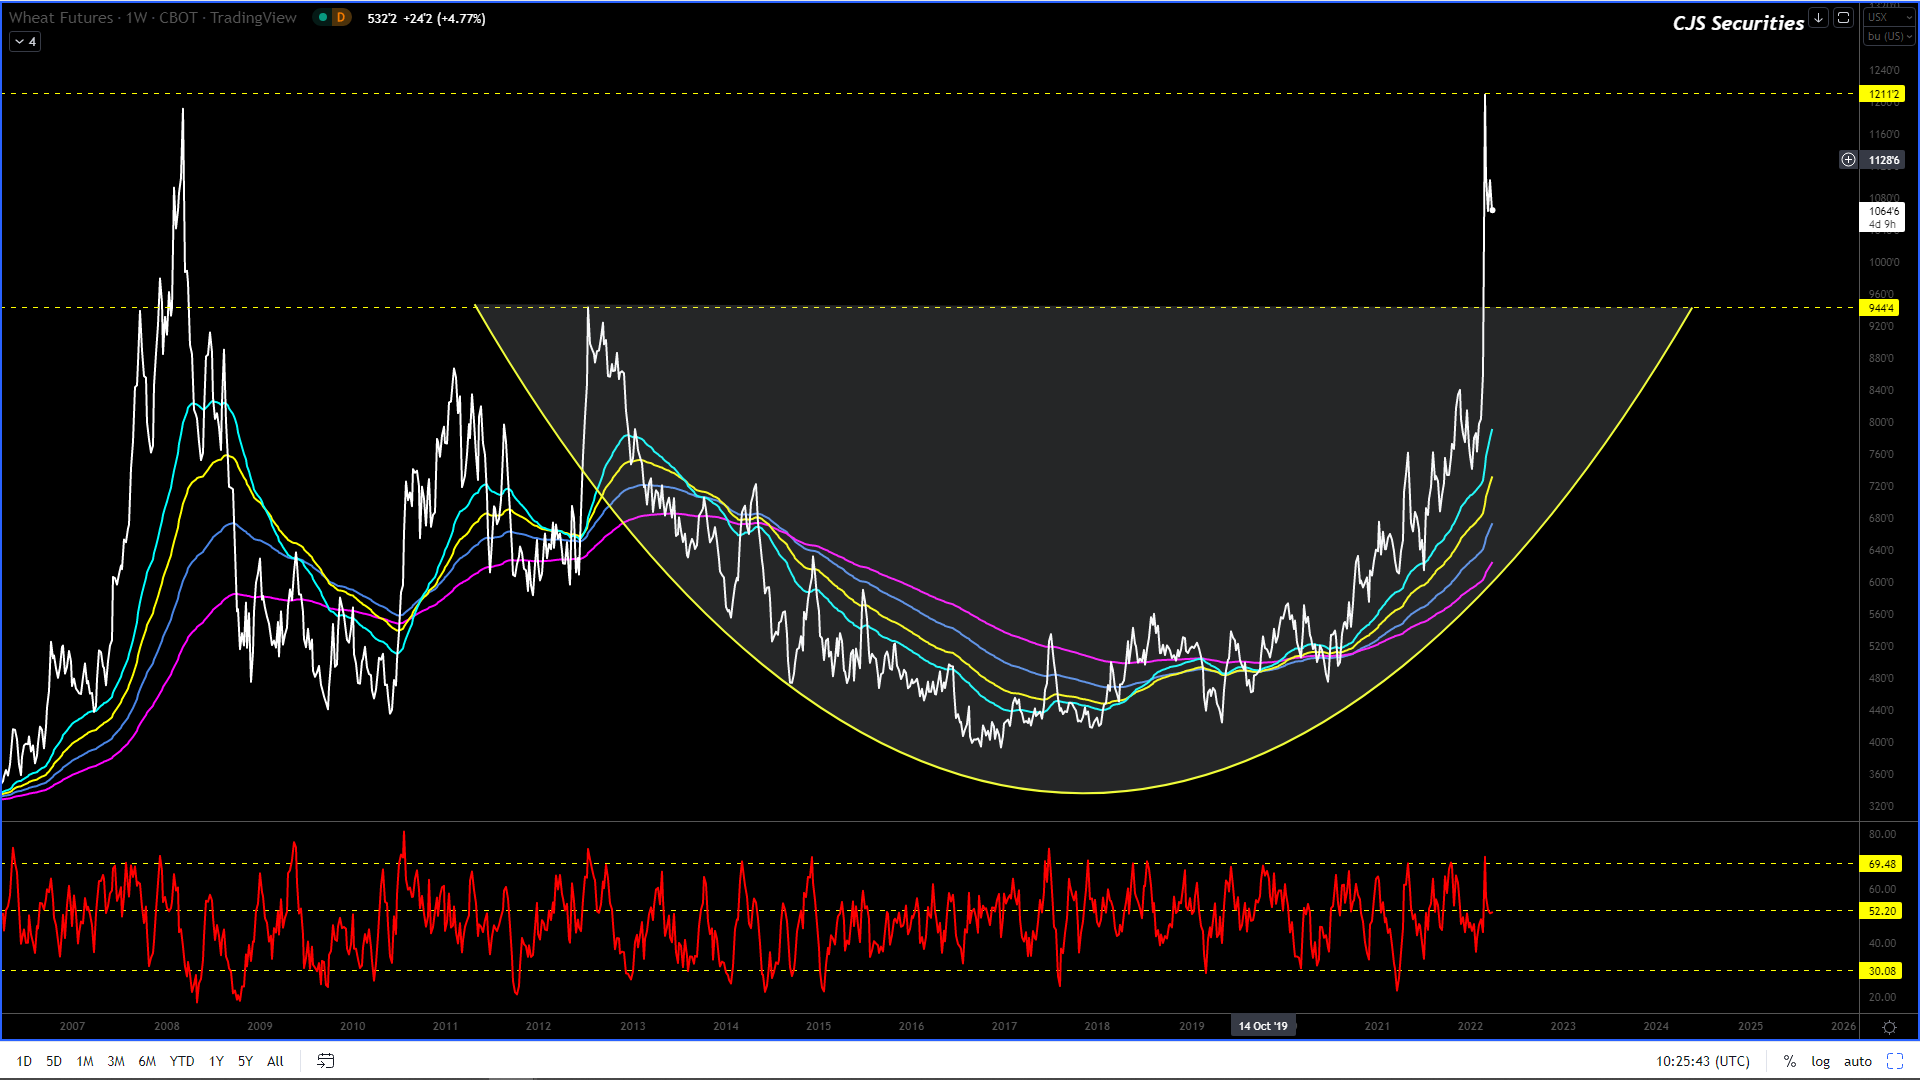
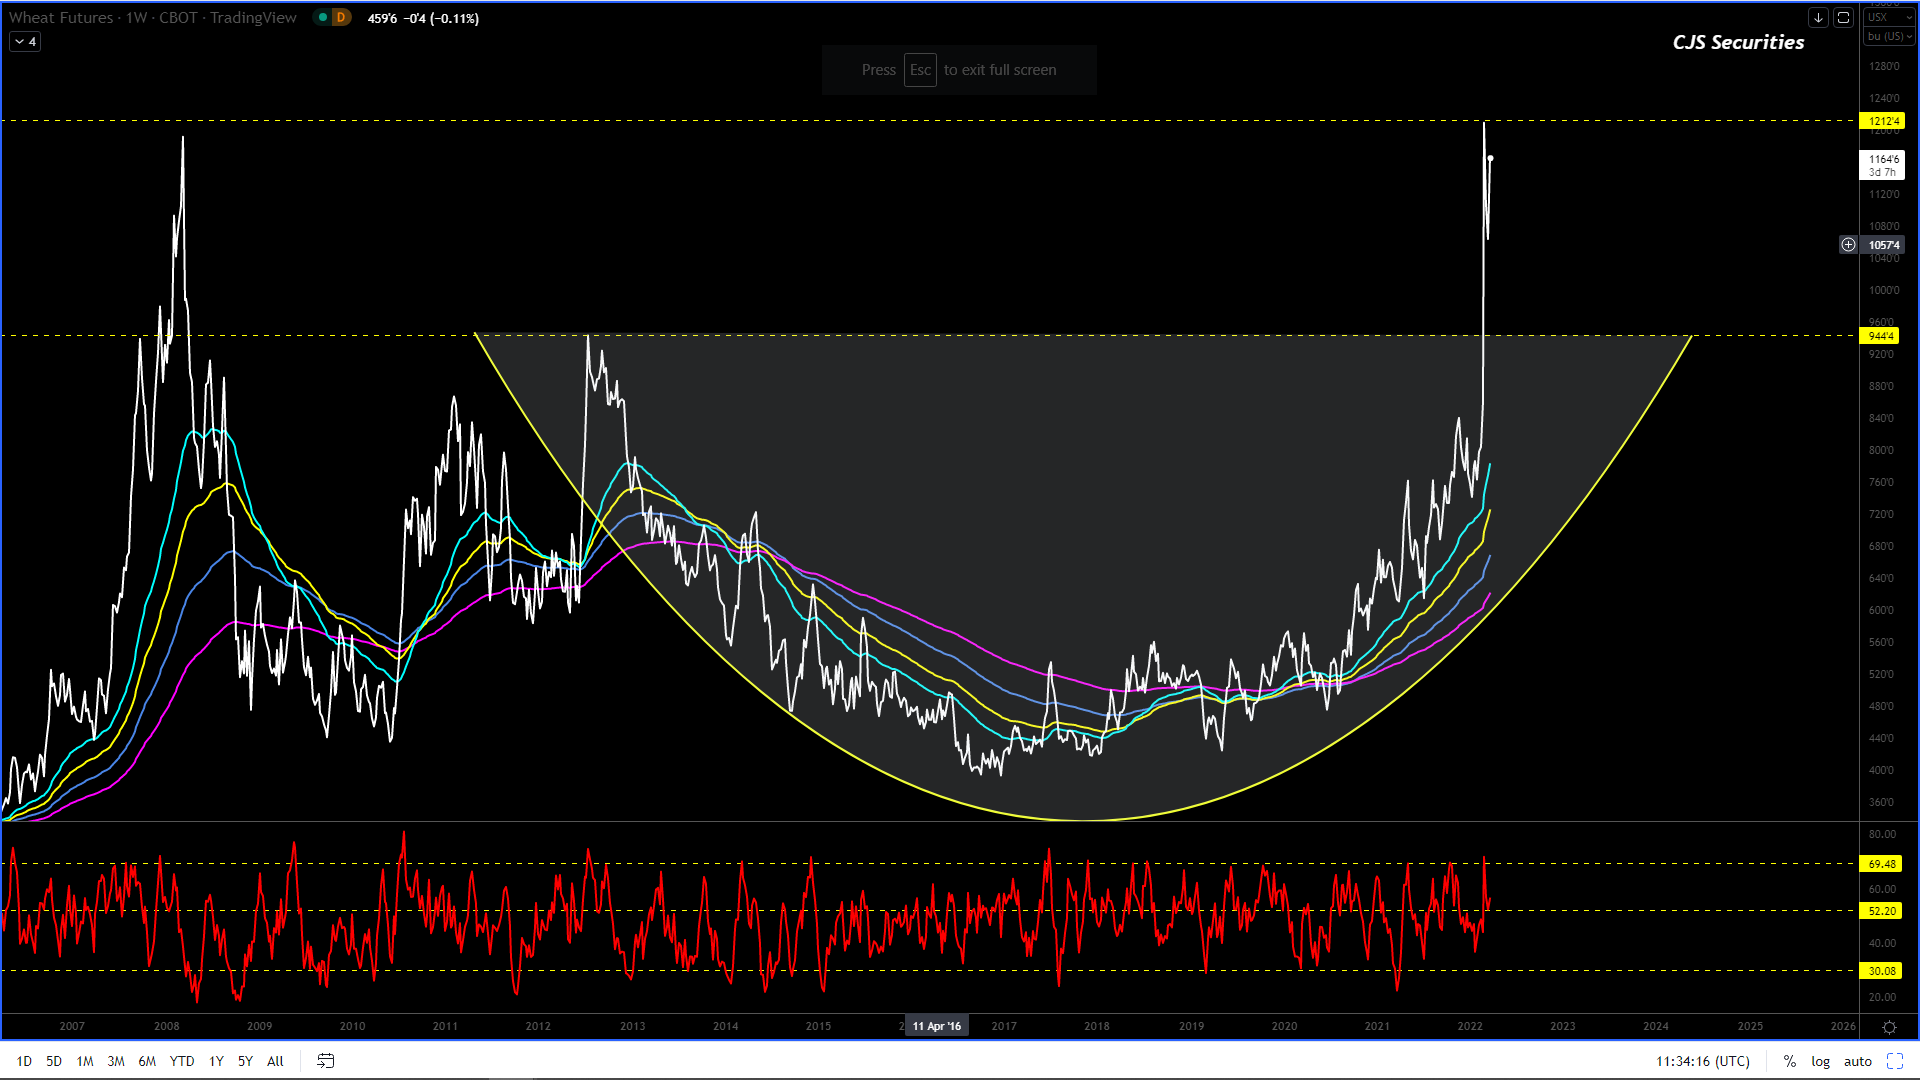
Weekly Chicago SRW Wheat Continuous
#No Change in Commentary
Wheat has been the wildest of rides and the market now appears to be well into its corrective phase.
Stay out until further notice.
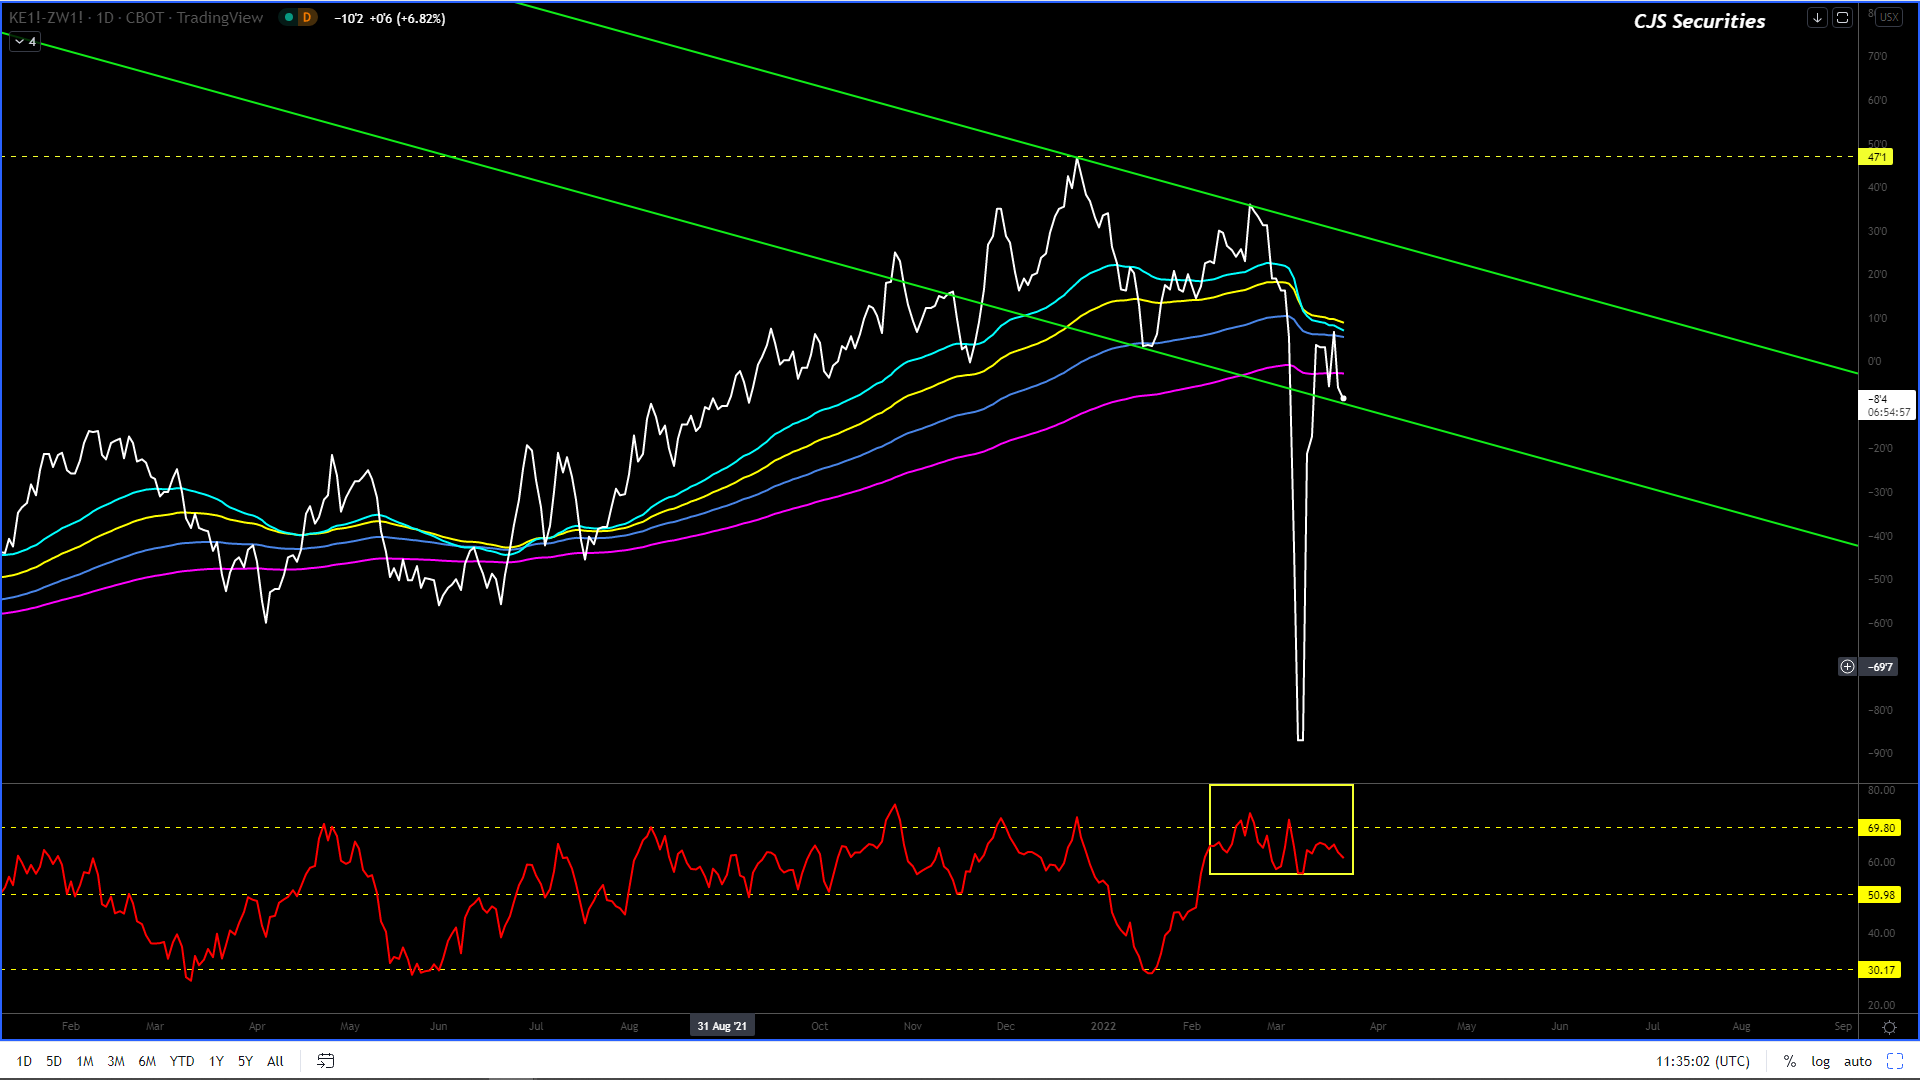
Daily Close KC Wheat v Chicago SRW Continuous Close
#No Change in Commentary
This chart is now as ugly as sin I will be staying out for some time yet.
Weekly SAF Wheat Continuous Close
Much like its US counter part, SAF wheat is in a corrective phase. – The correction could be over, but I don’t have the constitution to buy it here!
I will be patiently watching to see how this plays out over the next few weeks before looking to get in.
Daily Matif Wheat Continuous Close
Based on the current formation the chart seems to have another leg higher.
Ok, so here goes, I am still very much a ZAR BULL!
However, this is a Weekly chart and before my ultimate downside target is reached, we should be in for a decent kick that will provide us with the last chance to sell the Dollar aka buy the ZAR.
Short term outlook = testing the 233 Week EMA at R14.67 and keeping an eye on the oscillator as it approaches being well oversold.
I still see the below taking place over time.
What I see is R11.50 over the next 17 months.
I am convinced that the ZAR is in a multi-year corrective phase vs. the USD and that from today on, all upward spikes on this chart are well worth a short!
This chart could easily have a leg higher and trade toward the R16.77 level in the coming weeks. – I would use this as a USD selling opportunity.
Until then, the range is likely to be R14.88 – R15.50 and I would seriously consider owning the bottom of the range! – hopefully some of you bought the sub R15’s, even as just a ST hedge against war.
I am happy to be long the Dollar down to the R14.40’s.
Dollar/Rand Daily Candle
This chart is still headed lower, with potentially a print at R14.52.
The chart is now grossly oversold but can easily go a little further until the weekly oscillator meets the daily.
I would like a last leg higher into the high R16’s to complete the chart, but because of this leg being very deep, the kick could fail in the high R15’s. – we will watch as we go!
I cannot stress enough how important patience is and keeping your mind clear as emotions are sure to get the better of many this year. – this was a pre WAR quote.
Dollar/Rand 240 min Candle
I do not want to put in a trade here, but overall the current formation is a continuation that could trade as low as R14.70. – Looking good so far!
I am patiently waiting to see how low this chart can go, as the next trade I put on will be from the long side.
Euro/USD Weekly Close
I am very confused and in the big picture this chart could be consolidating for a serious move lower, but right now I would like to stay out!
US Dollar Index Weekly Candle
I remain unsure of where to from here, and hence I would advise staying out, although I would say that higher looks like the ST view.
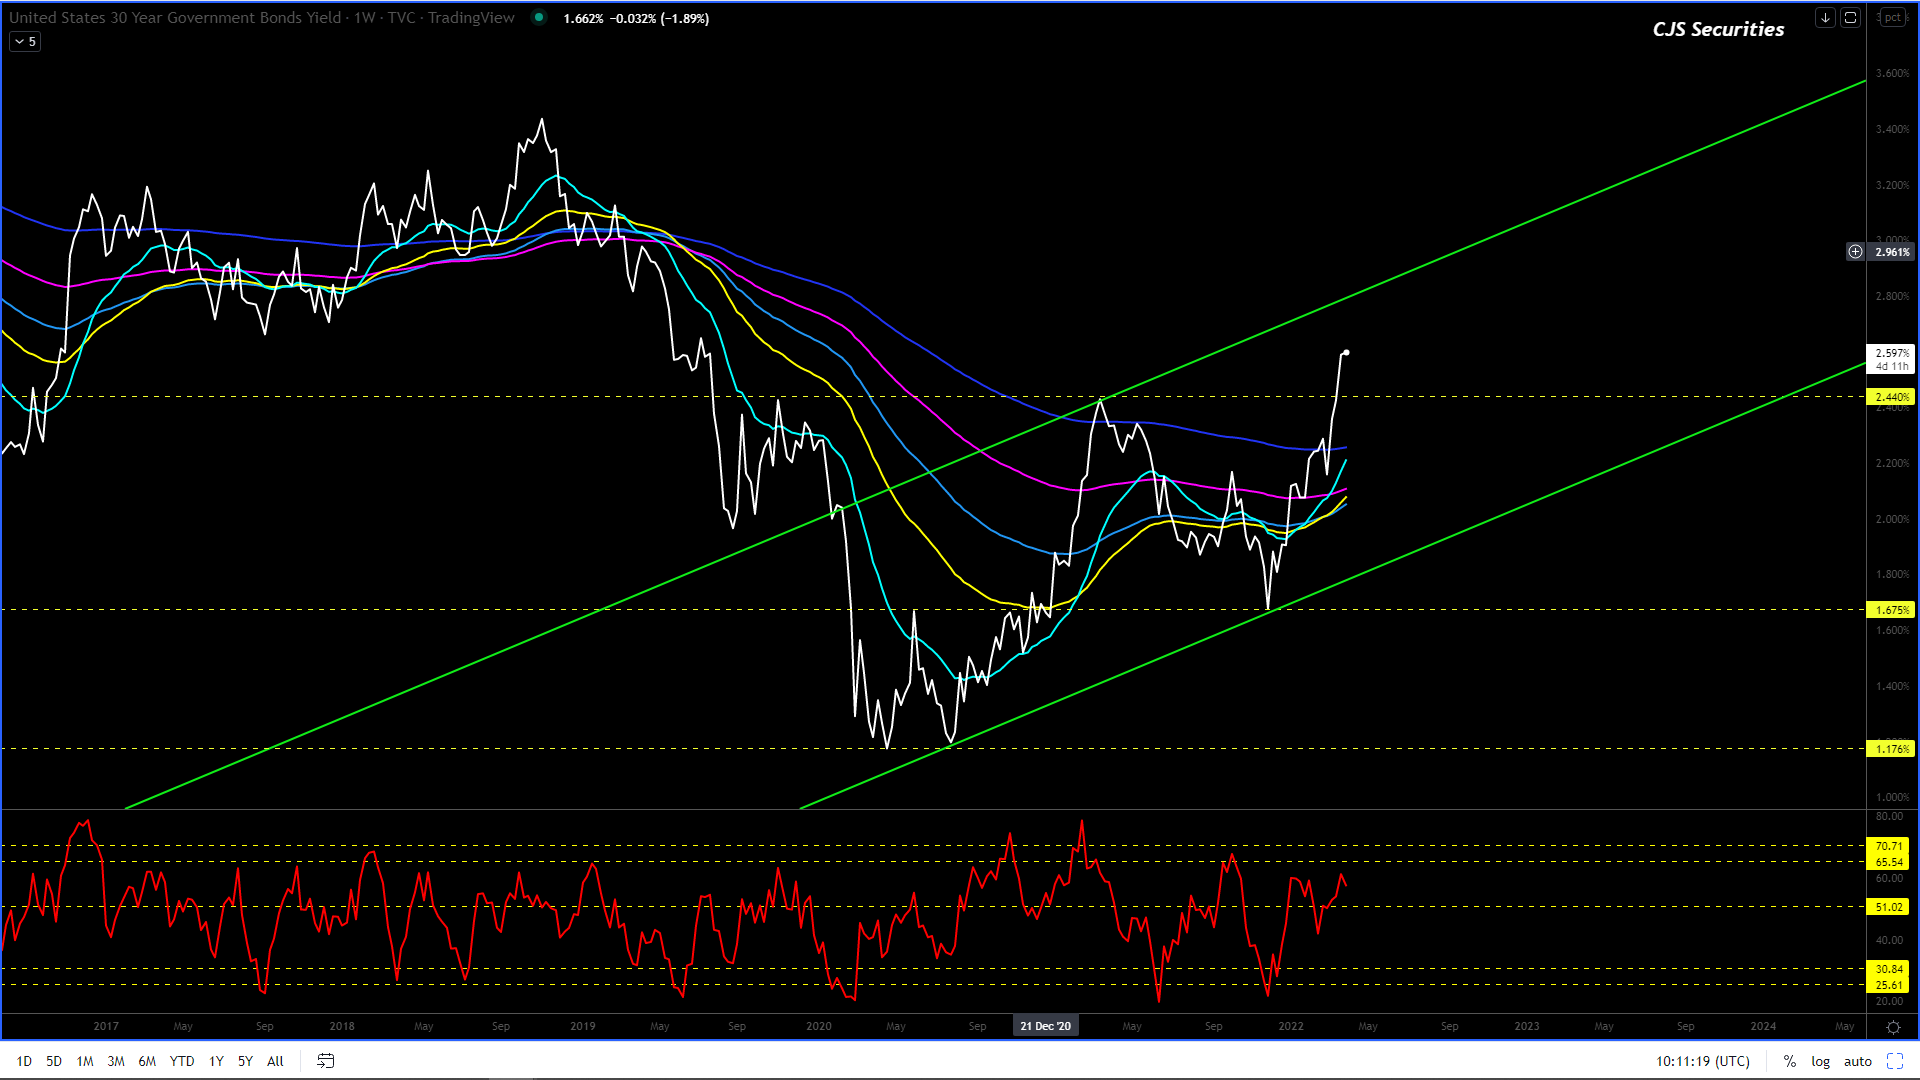
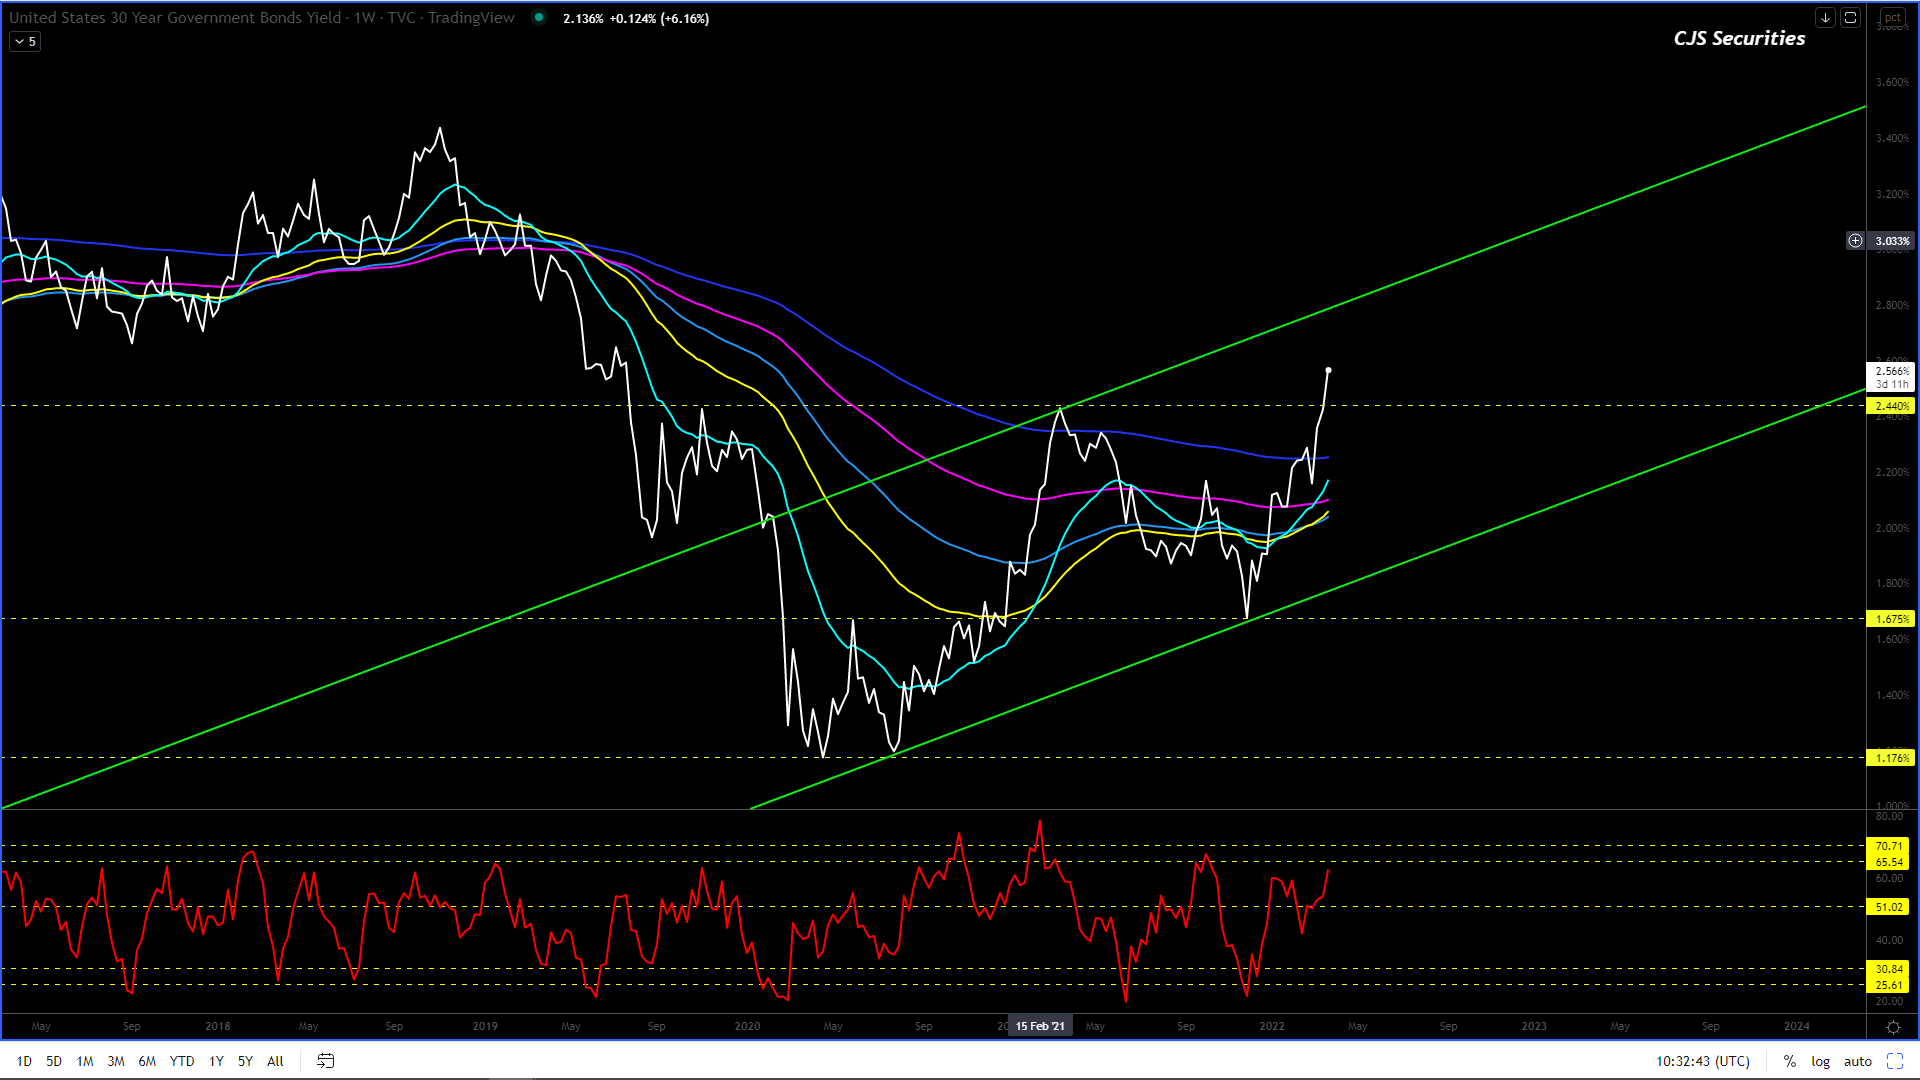
SA Government Bond 30 Year Yield Daily Close
#No Change in Commentary.
The below target level was missed with 0.08% and it could all be over bar the shouting.
The chart remains range-bound but we feel the move higher toward the top of the range at 11.40% is on the cards before looking to start a severe leg lower to sub 9.00%.
I do not want to speak too soon, but this chart may be topping out in the ST.
If we are busy correcting in a greater bull market then we could be headed down toward the $15.25 as a target.
Although we are in the throws of a raging bull market I will be patiently waiting to get long as sometimes these pullbacks go deeper than most anticipate.
240 Min CBOT May 22 Soybean Candle Chart
The 240 min chart is clearly busy making a correction.
This correction could trade as low as $15.40 in the coming weeks.
Board Crush Continuous Daily Close
There is nothing much to do here unless you are a professional “Top picker” and according to my knowledge they are all dead.
Oil Share Continuous Daily Close
Congratulations to all those that made some really good cash on their long position.
We are now happy to sit out and see how the market plays out overtime.
Weekly SAF Soy Continuous Close
There is no reason to sell this chart!
Now is the time to sit back and wait for the next opportunity.
Weekly SAF Suns Continuous Close
Spare a thought for all those that chased the market up R2000 in two weeks.
Technically there is nothing to do based on the charts current formation.
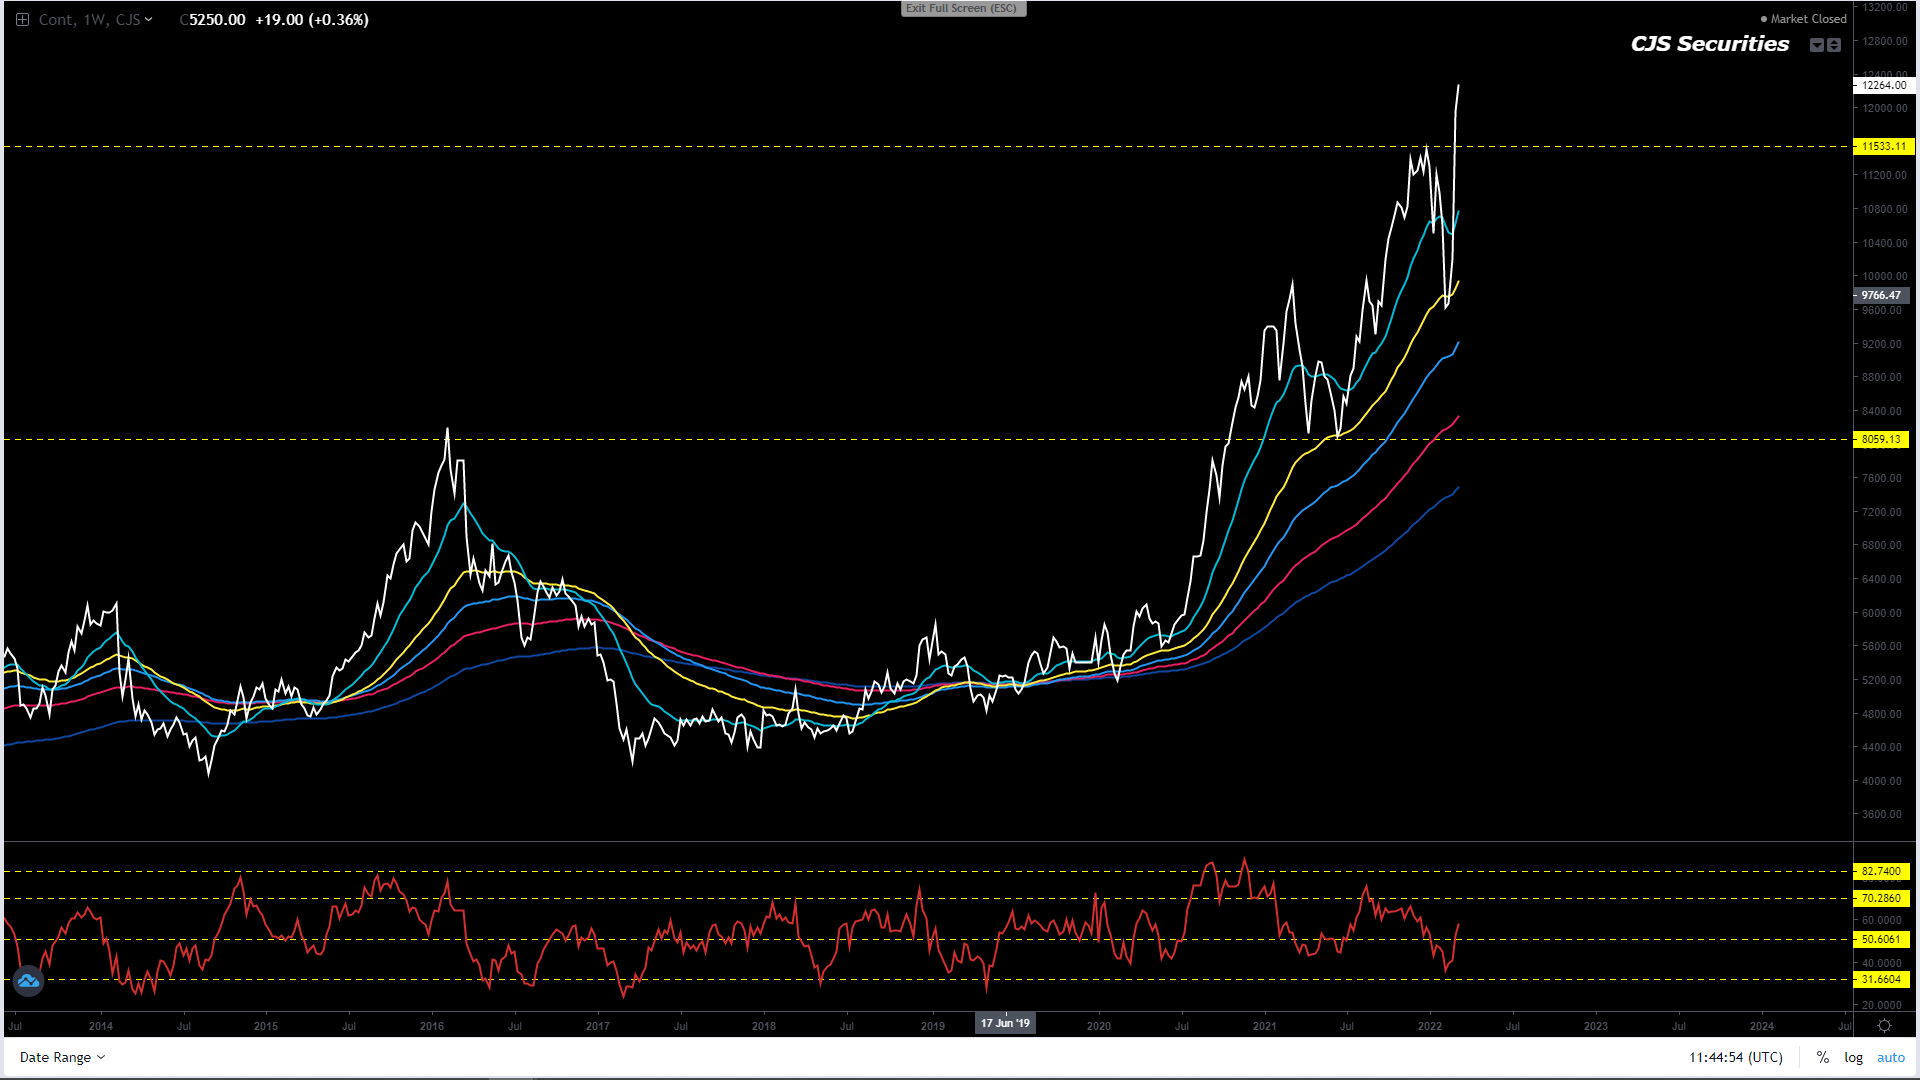
Weekly CBOT Soy Oil Continuous Close
We have been super long and will take profit on everything even though we are short of our price targets.
Congratulations to everyone who will make a small killing on this trade.
The ride had been amazing and I just feel that the time has come to consolidate and wait for a pullback to get long again.
Weekly CBOT SBM Continuous Close
Nothing has changed on the weekly chart, but we are happy to stay out until further notice.
This chart, however, could continue to rally from here!
The world feels surreal at this point, with WAR raging on and inflation going through the roof.
All I would like to say is that while this continues always remember, calm is contagious!
I still see the below taking place over time.
What I see is R11.50 over the next 17 months.
I am convinced that the ZAR is in a multi-year corrective phase vs. the USD and that from today on, all upward spikes on this chart are well worth a short!
This chart could easily have a leg higher and trade toward the R16.77 level in the coming weeks. – I would use this as a USD selling opportunity.
Until then, the range is likely to be R14.88 – R15.50 and I would seriously consider owning the bottom of the range! – hopefully some of you bought the sub R15’s, even as just a ST hedge against war.
Dollar/Rand Daily Candle
This chart could still trade lower by R0.20 – R0.35, but the chart’s formation is corrective, needs a leg higher, and this fits my weekly view.
I would like a last leg higher into the R16’s to complete the chart, but because of this leg being very deep, the kick could fail in the high R15’s.
I cannot stress enough how important patience is and keeping your mind clear as emotions are sure to get the better of many this year. – this was a pre WAR quote.
Dollar/Rand 240 min Candle
I do not want to put in a trade here, but overall the current formation is a continuation that could trade as low as R14.70.
I am patiently waiting to see how low this chart can go, as the next trade I put on will be from the long side.
“So, I have decided to get long and stay long until either R15.70 or until I am stopped out through R15.00!– long at R15.22” will be taking my pain and exiting today.
Euro/USD Weekly Close
All bets remain off.
The Black Swan that is WAR has taken over, and I will need this chart to play out over the next few weeks before remotely thinking about taking a view.
US Dollar Index Weekly Candle
With the Black Swan of WAR taking over, I am very unsure of where to from here, and hence I would advise staying out.
SA Government Bond 30 Year Yield Daily Close
The below target level was missed with 0.08% and it could all be over bar the shouting.
The chart remains range-bound but we feel the move higher toward the top of the range at 11.40% is on the cards before looking to start a severe leg lower to sub 9.00%.
Congratulations to all who held onto their long positions and have made an inordinate amount of money.
I am happy that we have been correct regarding being long, but considering this has all transpired due to WAR leaves me with a hollow feeling.
Please spare a thought for all those affected by this WAR.
I will not be taking a view for a few weeks or until the dust settles.
240 Min CBOT January 22 Soybean Candle Chart
The
Black Swan of WAR has ended many careers by its sound, and looking at this
chart, all I can say is that another leg up from here seems to be on the cards.
I
do not have the stomach to put on a trade though.
Board Crush Continuous Daily Close
There is nothing much to do here, and I am still happy to sit out.
Oil Share Continuous Daily Close
We will be taking profit ASAP.
We have not been stopped on the below view but will put in a stop under 40% as this chart is now highly overbought!
“After kicking off extremely oversold levels and making a new MT low, the chart remains at oversold levels and another leg lower to 42% will get me long. – lets see how this plays out.”
Weekly SAF Soy Continuous Close
Well done to those who were long, although again, I am only sorry this move has come because of WAR.
Now is the time to sit back and wait for the next opportunity as it’s not every day that you will make R500 + on a trade
Weekly SAF Suns Continuous Close
I have had this chart wrong, and WAR’s Black Swan could quickly still drive it higher.
However, I would stay out unless one has to as a turn could happen anytime.
Weekly CBOT Soy Oil Continuous Close
The below has not changed, and we are riding this one into the sunsetas we are winning! – (unfortunately, this is playing out due to WAR)
I seem to have this wrong and although we are long, this chart is now grossly oversold on a weekly basis and we need to dig deep and buy more scale down with a stop under $0.52 as the rally is coming, even if its only a kick!
I feel the correction is done (it had another leg lower), and all the pullbacks from here are buying opportunities with upside targets between $0.85 -$0.89! – the correction was obviously not done.
I almost feel that we don’t have enough cash to get as long as we should, buy at best and scale down, this is budget making stuff with a sprinkling of retirement!!!! – hope we don’t go broke before retiring.
Weekly CBOT SBM Continuous Close
Nothing
has changed on the weekly chart, but we are happy to stay out until further
notice.
This
chart, however, could quickly rally from here!