I remain of the opinion that, currently, this chart looks far more like a correction than a top.
The pullback level I had was as low as R17.60 before going higher has a minimum downside target of R17.87 that could have been reached yesterday.
I would seriously consider locking in Dollars (if you need to buy them) under R17.90 and buying into weakness. – there was a 2-hour period yesterday when the price traded sub R17.90.
The only way the market is not in a corrective phase based on the Weekly chart is if we close under R17.07. – this looks highly unlikely.
The good news is that the next leg higher would be well worth a top picker’s chance, as IMO this should be the last leg higher before starting a decent corrective phase.
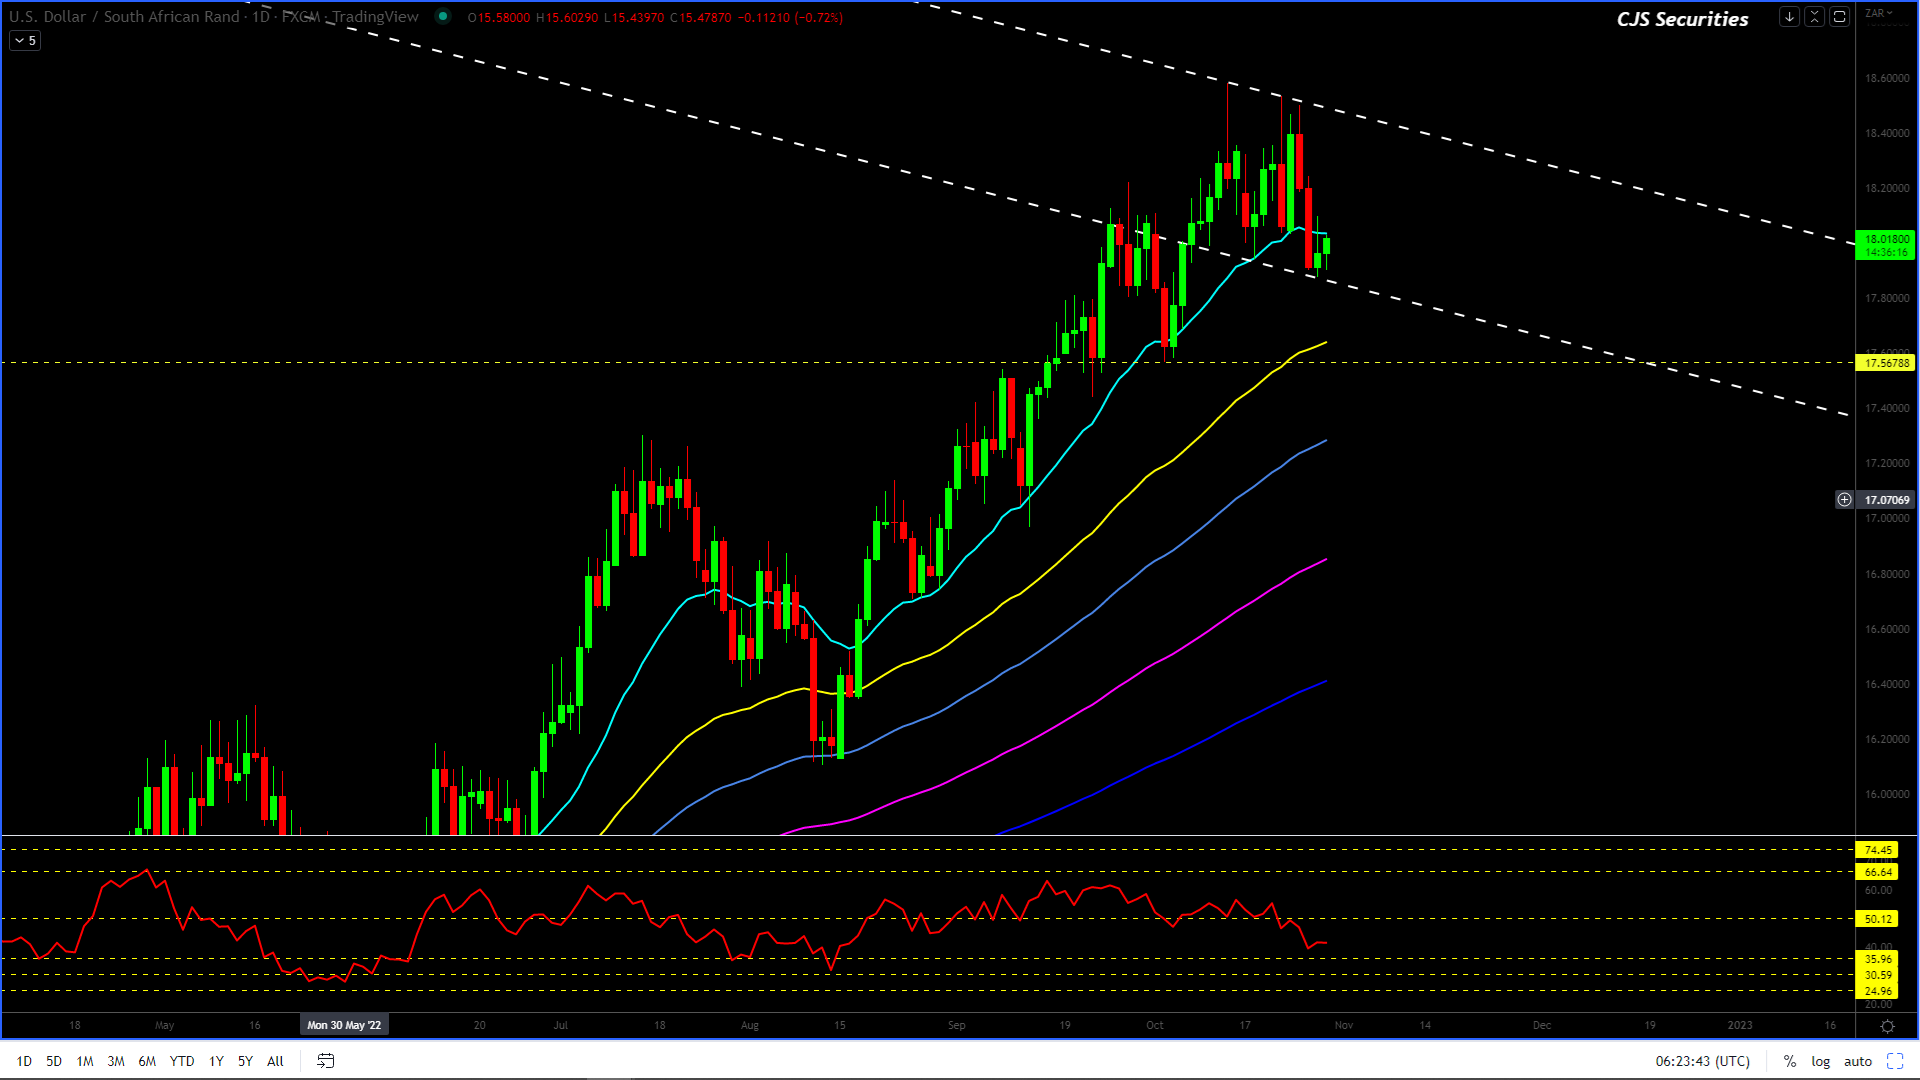
Dollar/Rand Daily Candle
The
Daily Chart starts to look more corrective than its Weekly counterpart.
The pullback
level on the Daily could potentially still trade as low as R17.60.
I would look to buy a dip of this nature as scale down
to R17.45with
a stop under R17.40.
The Daily chart will only reverse
the upward trend based on a close under R17.17.
With the current price ranges
trading this wide, we would prefer to adopt a risk-off approach unless we see
the lower levels at which we can get long USD.
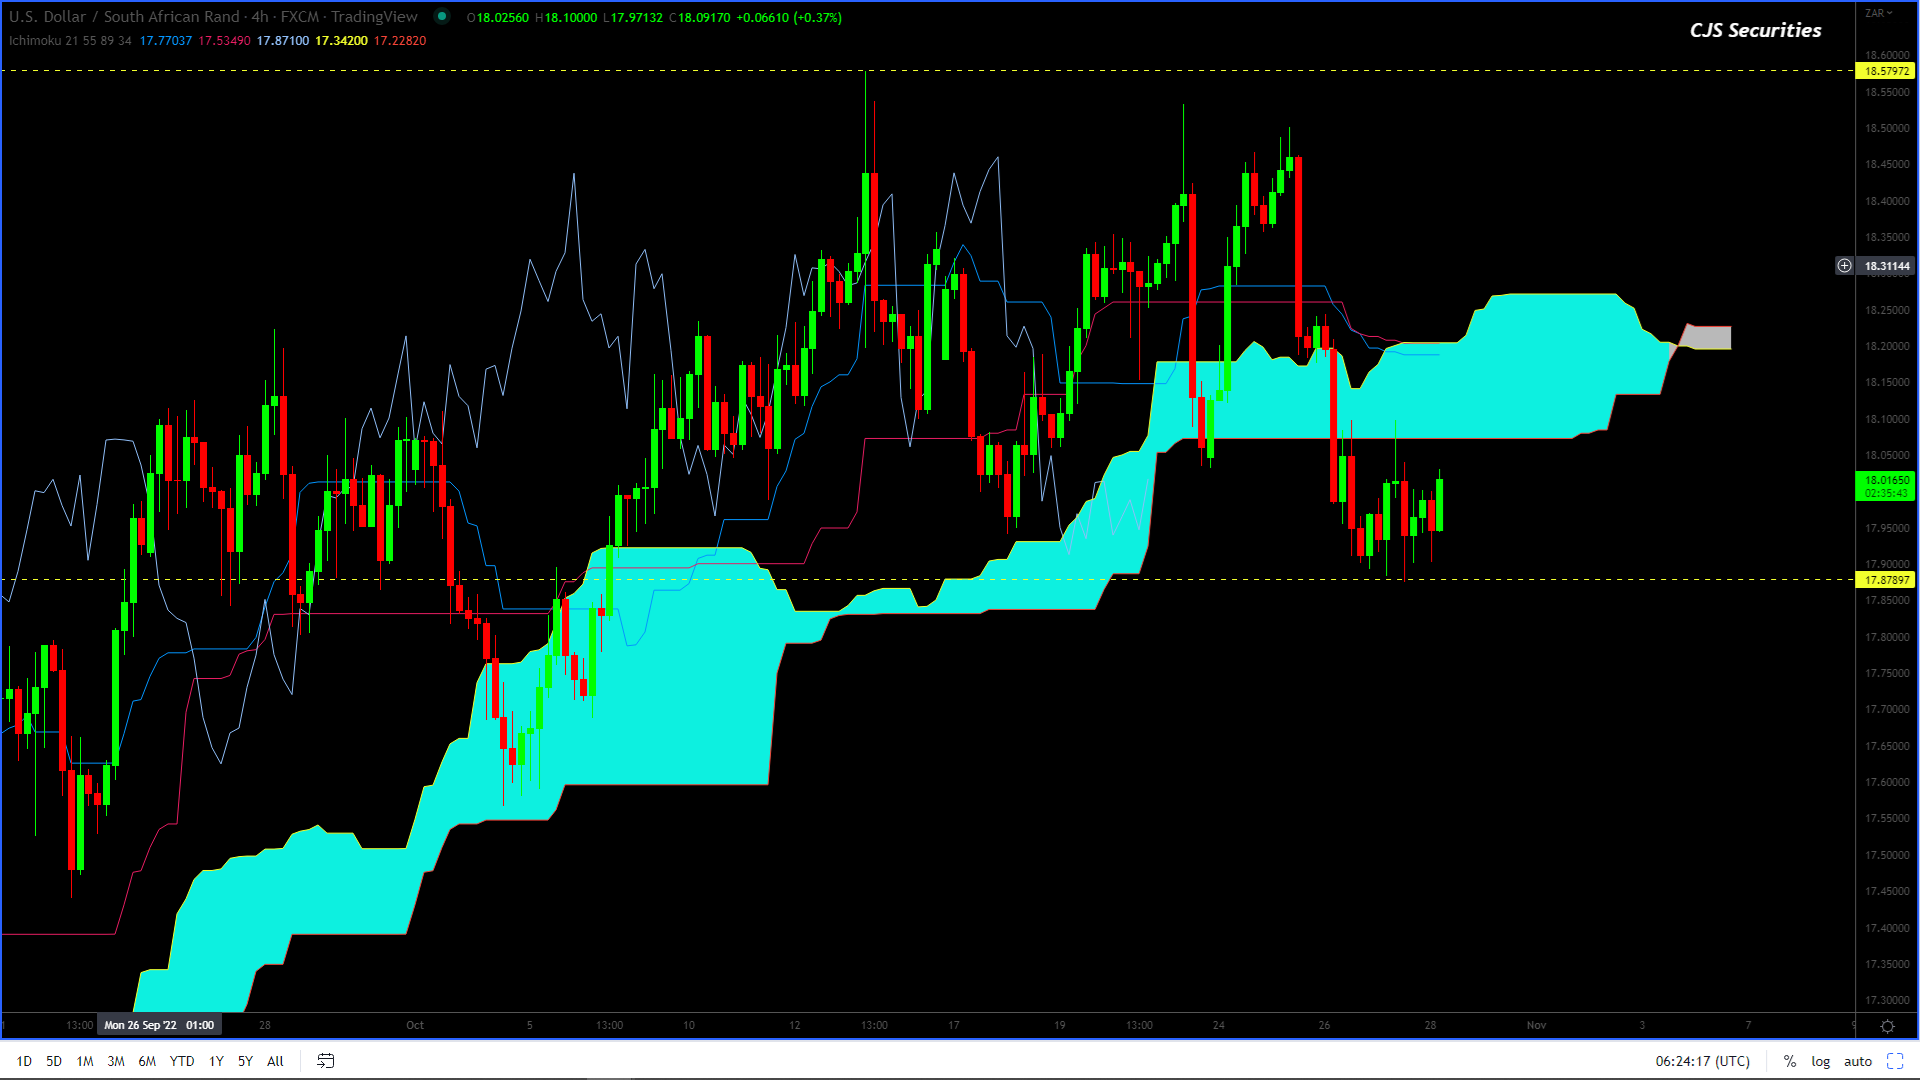
Dollar/Rand 240 Min Candle
The 240 Min Chart appears to be making a consolidation that will trade
anything between R0.12 – R0.30lower.
As mentioned, I feel we
are more in a corrective phase, and the chart’s current formation also lends itself
more to being corrective rather than a top formation.
Technically, I would look to
own the USD on a decent move lower with an SL under R17.55.
Because I feel this is a
correction, I would start buying Dollars under R17.90.
The 240 Min
Chart, at this point, is the joker in the pack and will likely test your
patience more than anything else.
Right now, I
am focused on the LT charts and trust that they will play out.
As mentioned,
I feel we are more in a corrective phase, and even though the chart has come
back R0.60, the correction is currently
not big enough (famous last words).
Technically,
the chart gives me some confidence based on the fact that a lower move starts
to test the thin part of the cloud.
Because I feel
this is a correction, I would start buying Dollars under R17.90.
In the bigger picture, not much has changed (because not much has happened), and I remain a SERIOUS seller of a move over $7.00.
The ranges, however, have changed with the current consolidation we are experiencing.
The chart currently seems to be experiencing its last MT upside consolidation (potential triangle), which could see the price dip down to $6.62.
This should attract buying at the 100 Day MA, a favourite of the funds.
From there we could see a rally as high as $7.29 to close the upside gap before coming off significantly to close the low gap as an absolute minimum. (as seen in my yellow road map.)
The above view will be negated and the chart will collapse on a daily close under $6.52.