Welcome to 2023, a year that is sure to test your metal even more than 2022, based on the technical action on these charts!
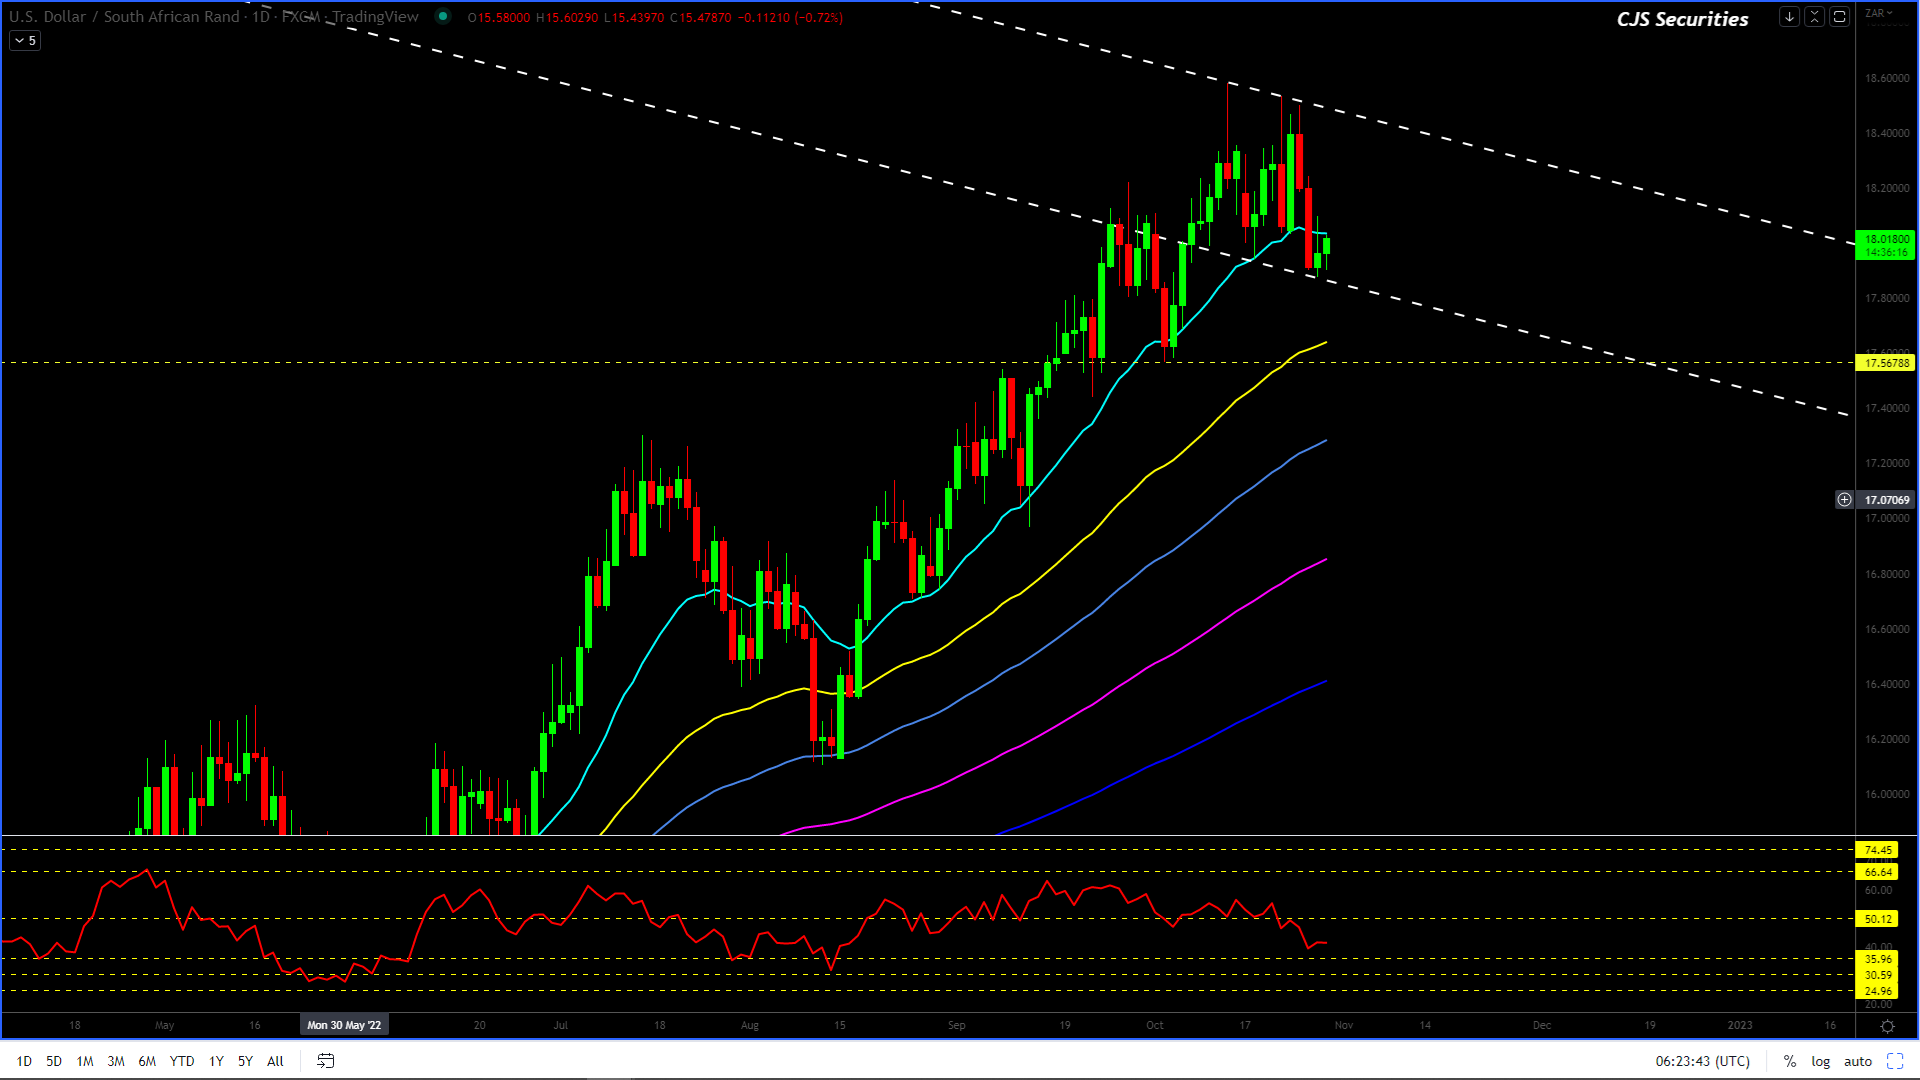
The Weekly Close chart remains very much in a corrective phase.
Based on the chart’s current formation I expect a USD rally of note in the short–medium term.
The upside targets could be the previous high atR19.06 or even make a new ATH, there are many permeations, and currently, all I can say is that one needs to be long USD or square.
To all the USD bears out there, I pose the following questions:
– where were you when the DXY was at 115?
– why so bearish now with the index at 102?
– how do you feel being short down here?
People keep perspective and remember I am bearish the USD, just not from here and just not now after everyone and their dog are SHORT in SIZE!
“The hard cold reality of trading is that every trade has an uncertain outcome” – Mark Douglas
Welcome to 2023, a year that is sure to test your metal even more than 2022, based on the technical action on these charts!
The Weekly Close chart remains very much in a corrective phase.
Based on the chart’s current formation I expect a USD rally of note in the short–medium term.
The upside targets could be the previous high atR19.06 or even make a new ATH, there are many permeations, and currently, all I can say is that one needs to be long USD or square.
To all the USD bears out there, I pose the following questions:
– where were you when the DXY was at 115?
– why so bearish now with the index at 102?
– how do you feel being short down here?
People keep perspective and remember I am bearish the USD, just not from here and just not now after everyone and their dog are SHORT in SIZE!
“The hard cold reality of trading is that every trade has an uncertain outcome” – Mark Douglas
I feel that in the ST, we may move lower toward the R16.70 – R16.62 level.
A move of this nature would see the price target the 55-Day EMA, and with the chart being this oversold Weekly, I would definitely be looking at buying USD.
Although my road map shows a move back to the mid R18.00’s as a minimum, the deeper the current move, the less likely we will see a significant move higher unless we have a Black Swan event.
A very good friend of mine recently said, “2022 has been a year we have seen a bevy of Black Swans” in other words not so rare.
In any event, a move down to R16.70 would be a USD buy, as from these levels, we should see a relief rally of between R0.60 – R0.70, purely based on the chart being this deeply oversold.
Good luck for the rest of the week, and remember, in these volatile markets, trade it, don’t marry it!
“Don’t be a hero. Don’t have an ego. Always question yourself and your ability. Don’t ever feel that you are very good. The second you do, you are dead.”– Paul Tudor Jones
I have not changed the road map since Oct 6, 2022.
Looking at this chart, I am convinced that should we see a rally to $7.30, I would still happily go short there!
Alternatively, if this chart starts to crack, it could be horrid, and as things one would have to say, the majority of the market is long in size.
Hence where does the price need to go to hurt the most people?
I am not advocating selling this market naked here in size, but I am saying that I would look at shipping in some cheap puts against any longs you may have because a move lower from here looks very much like it will end up hurting the most.
Happy Monday!
“Don’t be a hero. Don’t have an ego. Always question yourself and your ability. Don’t ever feel that you are very good. The second you do, you are dead.”– Paul Tudor Jones
I remain of the opinion that, currently, this chart looks far more like a correction than a top.
The pullback level I had was as low as R17.60 before going higher has a minimum downside target of R17.87 that could have been reached yesterday.
I would seriously consider locking in Dollars (if you need to buy them) under R17.90 and buying into weakness. – there was a 2-hour period yesterday when the price traded sub R17.90.
The only way the market is not in a corrective phase based on the Weekly chart is if we close under R17.07. – this looks highly unlikely.
The good news is that the next leg higher would be well worth a top picker’s chance, as IMO this should be the last leg higher before starting a decent corrective phase.
Dollar/Rand Daily Candle
The
Daily Chart starts to look more corrective than its Weekly counterpart.
The pullback
level on the Daily could potentially still trade as low as R17.60.
I would look to buy a dip of this nature as scale down
to R17.45with
a stop under R17.40.
The Daily chart will only reverse
the upward trend based on a close under R17.17.
With the current price ranges
trading this wide, we would prefer to adopt a risk-off approach unless we see
the lower levels at which we can get long USD.
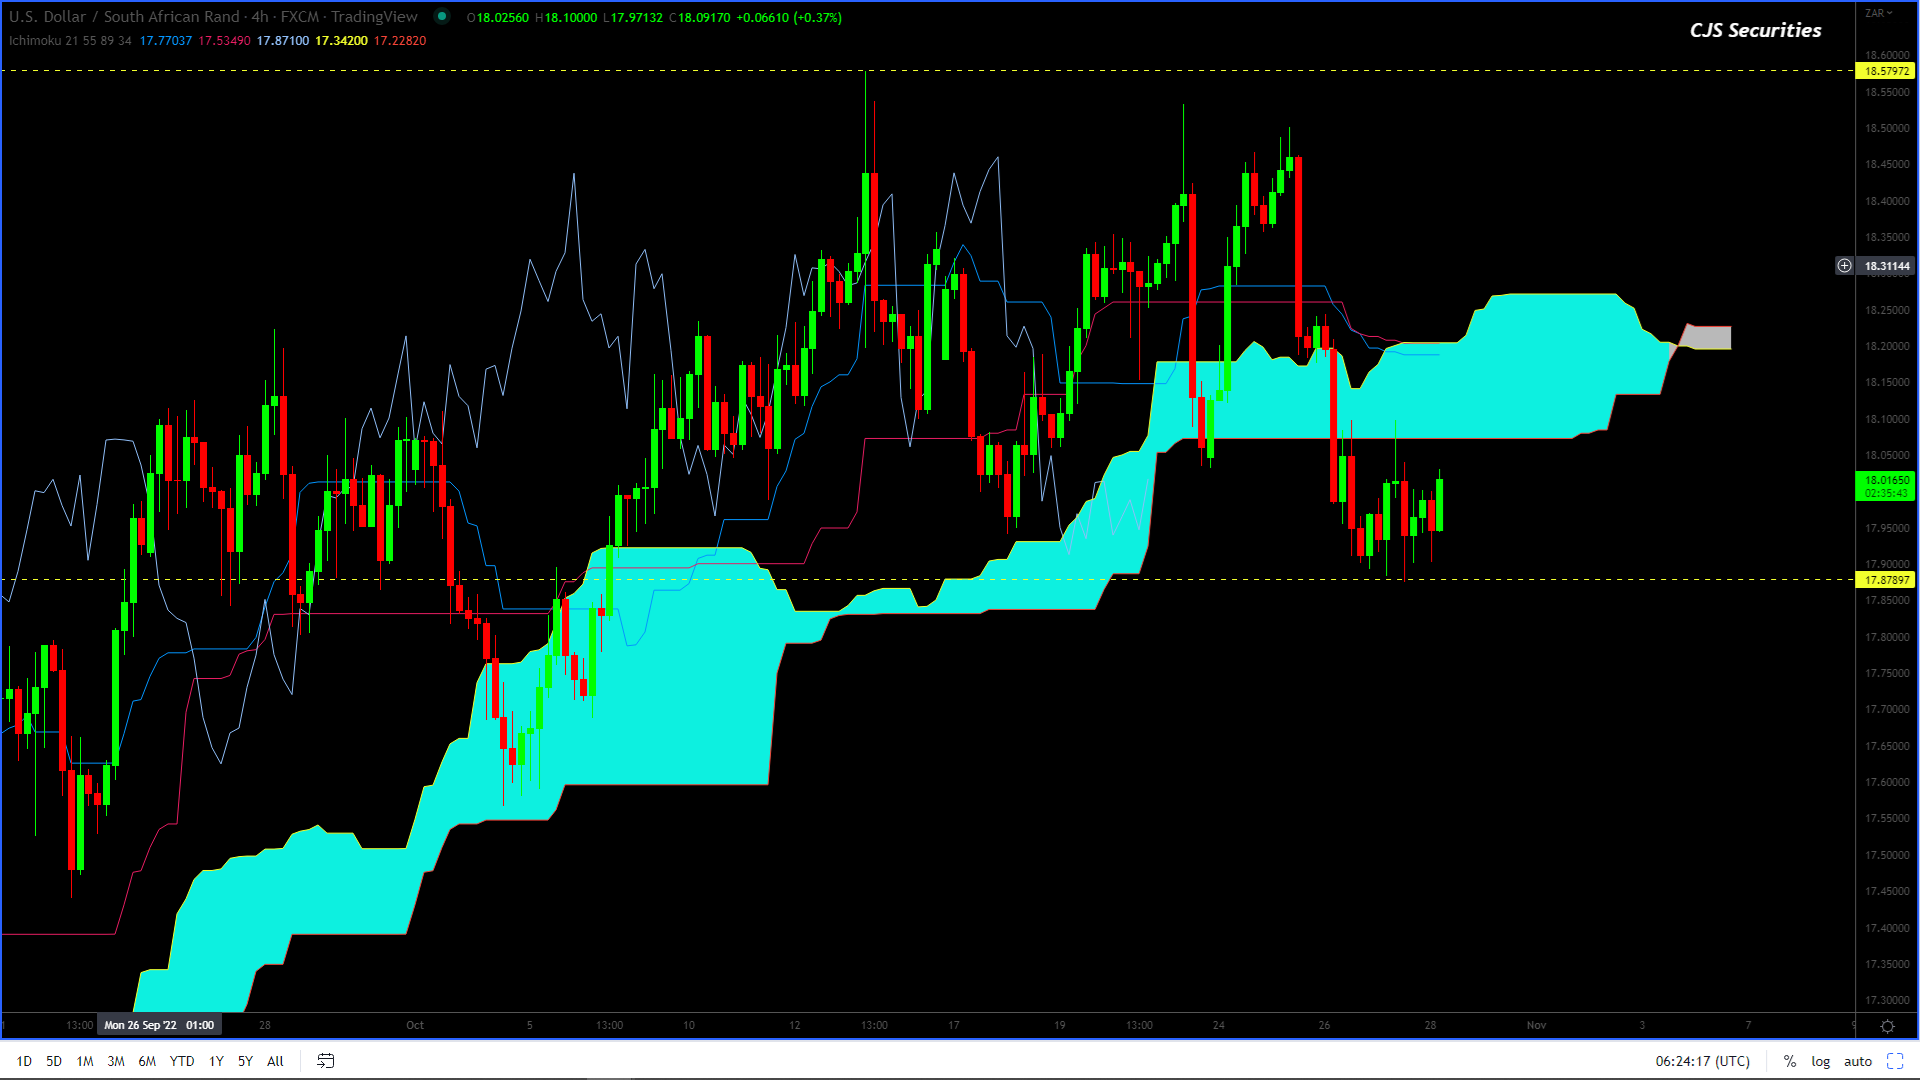
Dollar/Rand 240 Min Candle
The 240 Min Chart appears to be making a consolidation that will trade
anything between R0.12 – R0.30lower.
As mentioned, I feel we
are more in a corrective phase, and the chart’s current formation also lends itself
more to being corrective rather than a top formation.
Technically, I would look to
own the USD on a decent move lower with an SL under R17.55.
Because I feel this is a
correction, I would start buying Dollars under R17.90.
The 240 Min
Chart, at this point, is the joker in the pack and will likely test your
patience more than anything else.
Right now, I
am focused on the LT charts and trust that they will play out.
As mentioned,
I feel we are more in a corrective phase, and even though the chart has come
back R0.60, the correction is currently
not big enough (famous last words).
Technically,
the chart gives me some confidence based on the fact that a lower move starts
to test the thin part of the cloud.
Because I feel
this is a correction, I would start buying Dollars under R17.90.
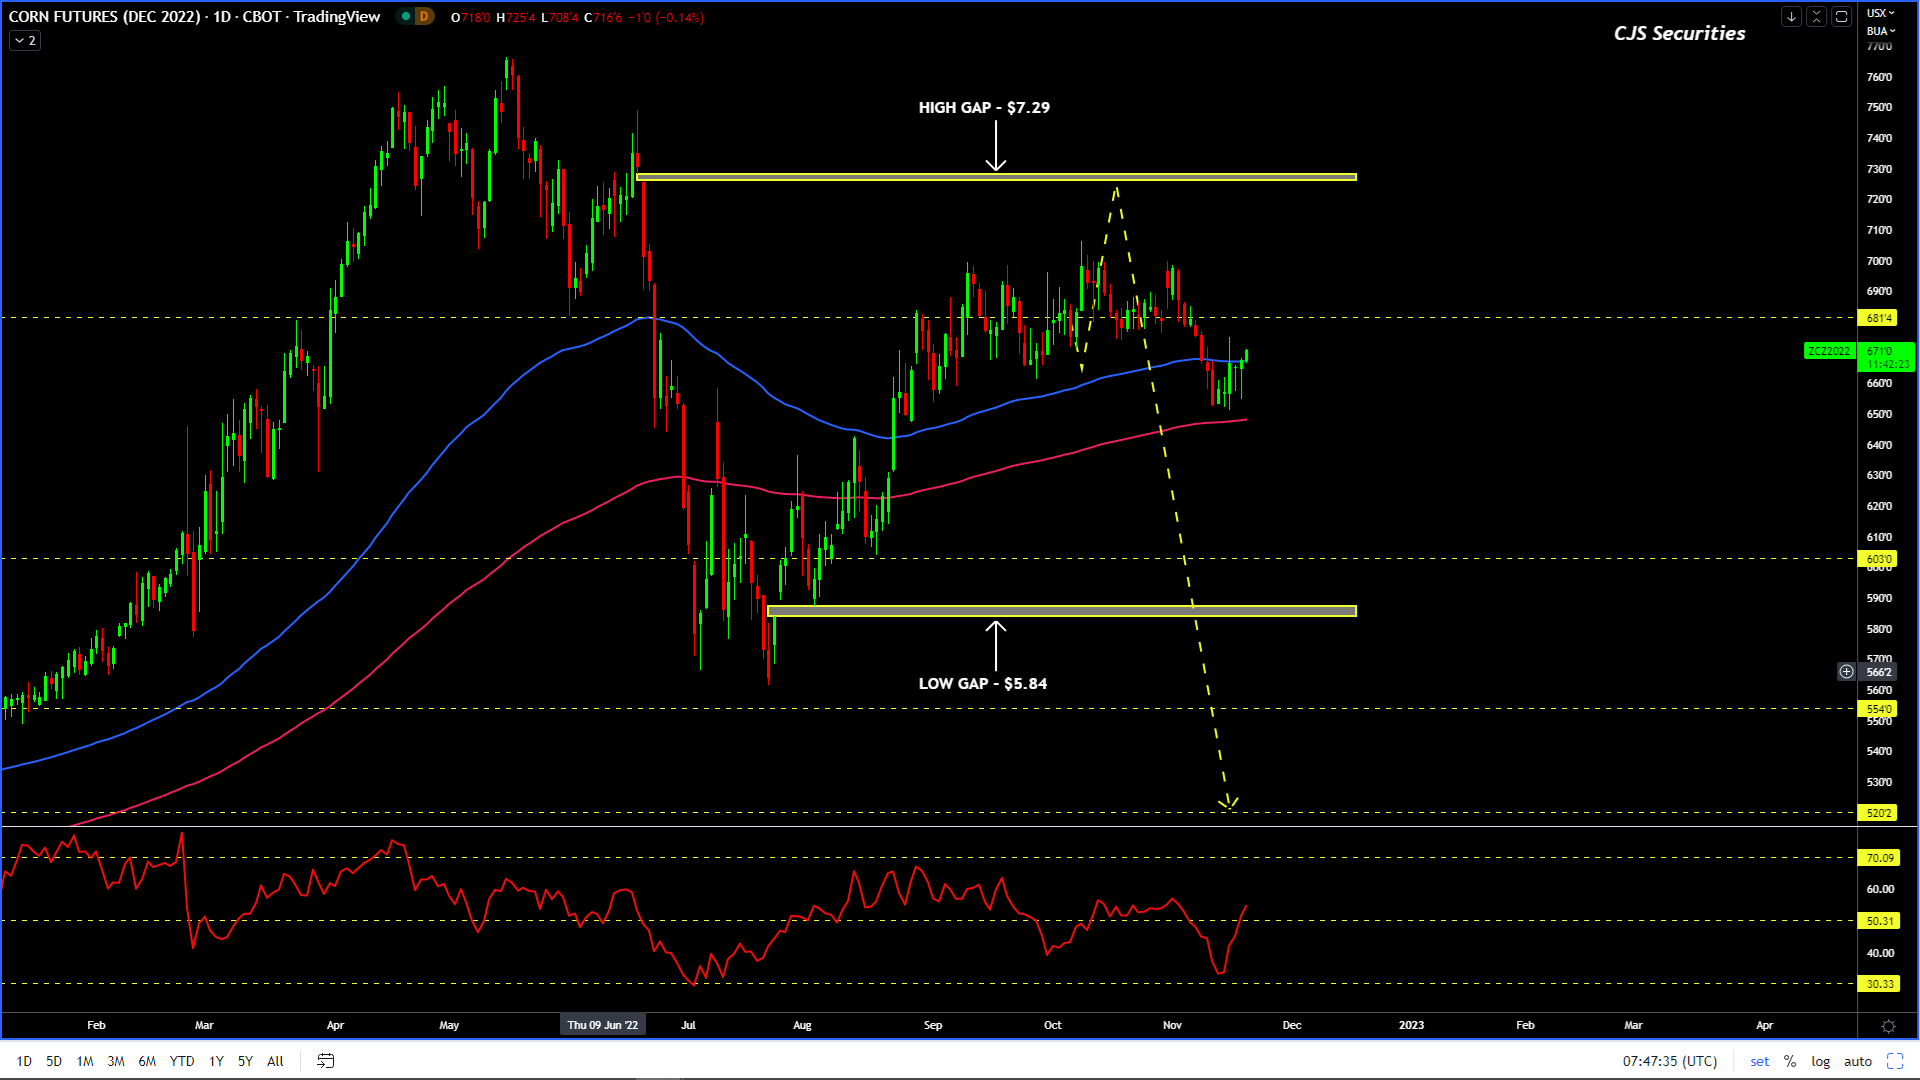
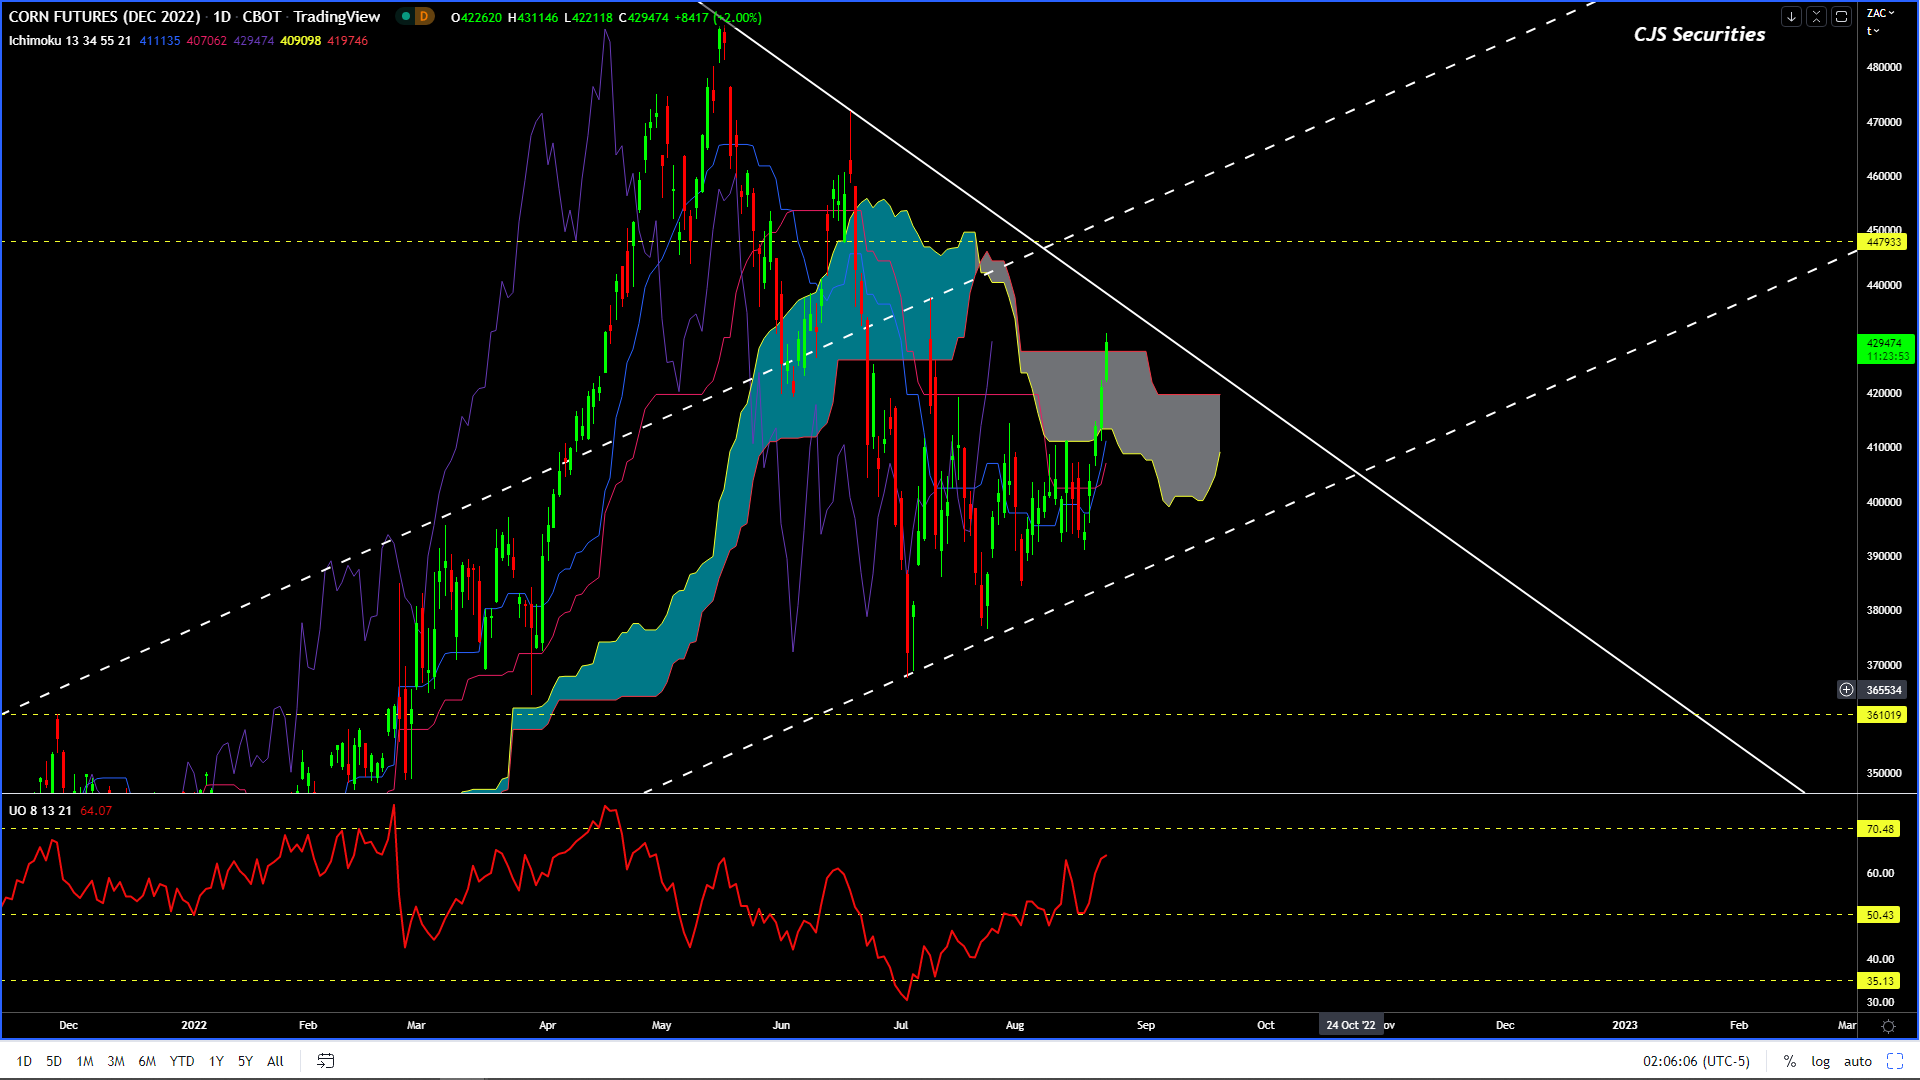
In the bigger picture, not much has changed (because not much has happened), and I remain a SERIOUS seller of a move over $7.00.
The ranges, however, have changed with the current consolidation we are experiencing.
The chart currently seems to be experiencing its last MT upside consolidation (potential triangle), which could see the price dip down to $6.62.
This should attract buying at the 100 Day MA, a favourite of the funds.
From there we could see a rally as high as $7.29 to close the upside gap before coming off significantly to close the low gap as an absolute minimum. (as seen in my yellow road map.)
The above view will be negated and the chart will collapse on a daily close under $6.52.
As per the last report sent out on Jan 30th, the ZAR has weakened significantly against the USD.
We are now experiencing a pullback/correction from these levels, but IMO the weakening trend is not over as it stands on the LT charts.
This trend will only reverse once we have a Daily Close under R17.40 combined with a Weekly Close under R17.60.
Until then all major pullbacks are USD buying opportunities.
Most of you will know that IMO the USD bull run is over but that we are currently experiencing a correction and this along with the sentiment and SA’s own internal strife is adding to the ZAR weakness.
In the big picture, there will most certainly be an opportunity to buy the ZAR as IMO the ZAR will have a decent Bull run before year-end, but that time is not now.
Stay focused, and don’t get sucked into being bullish, bearish, or right, focus on your hedge or capitalize on volatility, and the rest will follow.
“When you genuinely accept the risks, you will be at peace with any outcome.” – Mark Douglas
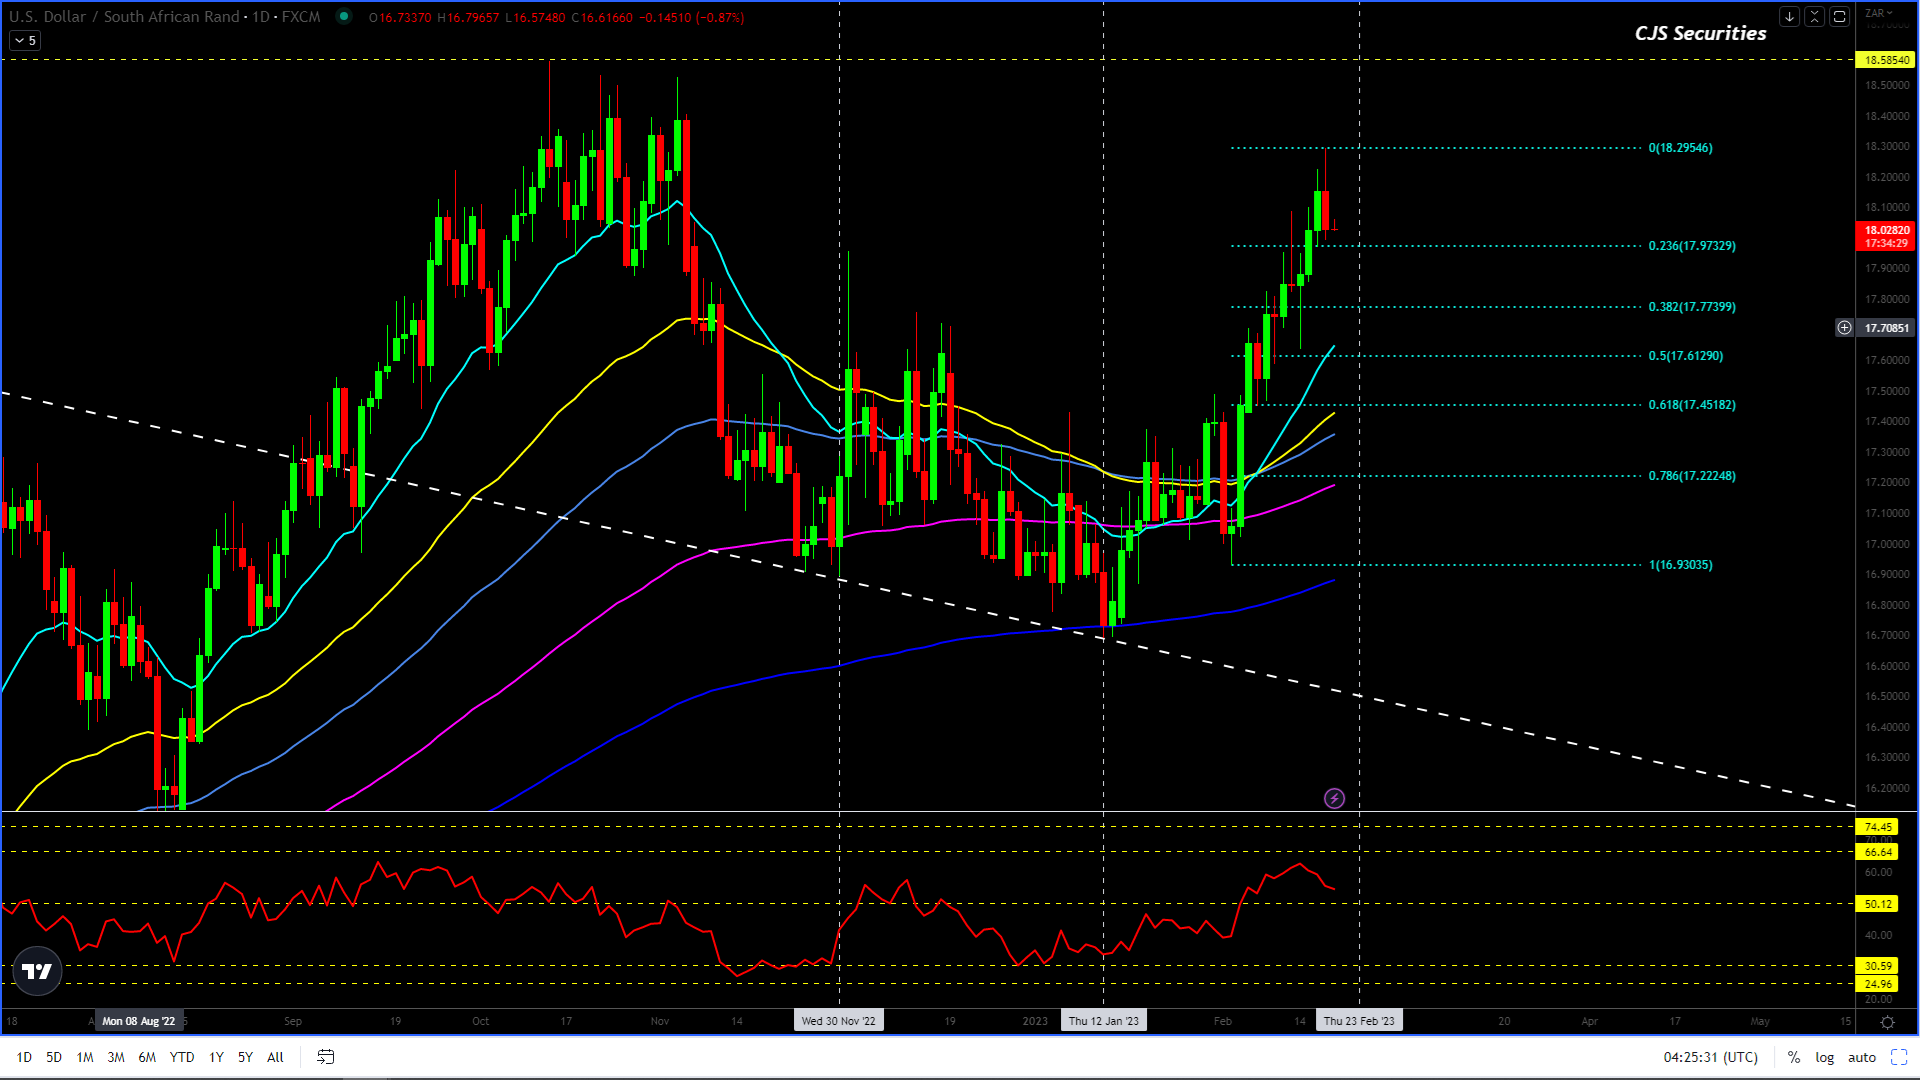
Dollar/Rand Daily Candle
The Daily Candle Chart is trading very nicely on a technical basis.
After a very decent rally, off the low of R17.63 after the US CPI print this chart looks set to consolidate between R18.30 and R17.75.
I would look to buy a dip sub R17.80 scale down to R17.48 (if it gets this low) as there is another leg higher IMO.
The ‘last” upward leg in this move should target R18.58 as a minimum target, and potentially even test the charts ATH’s at R19.35.
In closing, all pullbacks are buying opportunities until the ZAR breaks under R17.40.
If we keep our heads there should be a significant opportunity to make very good returns or hedging decisions in the coming weeks and months as volatility is here to stay.
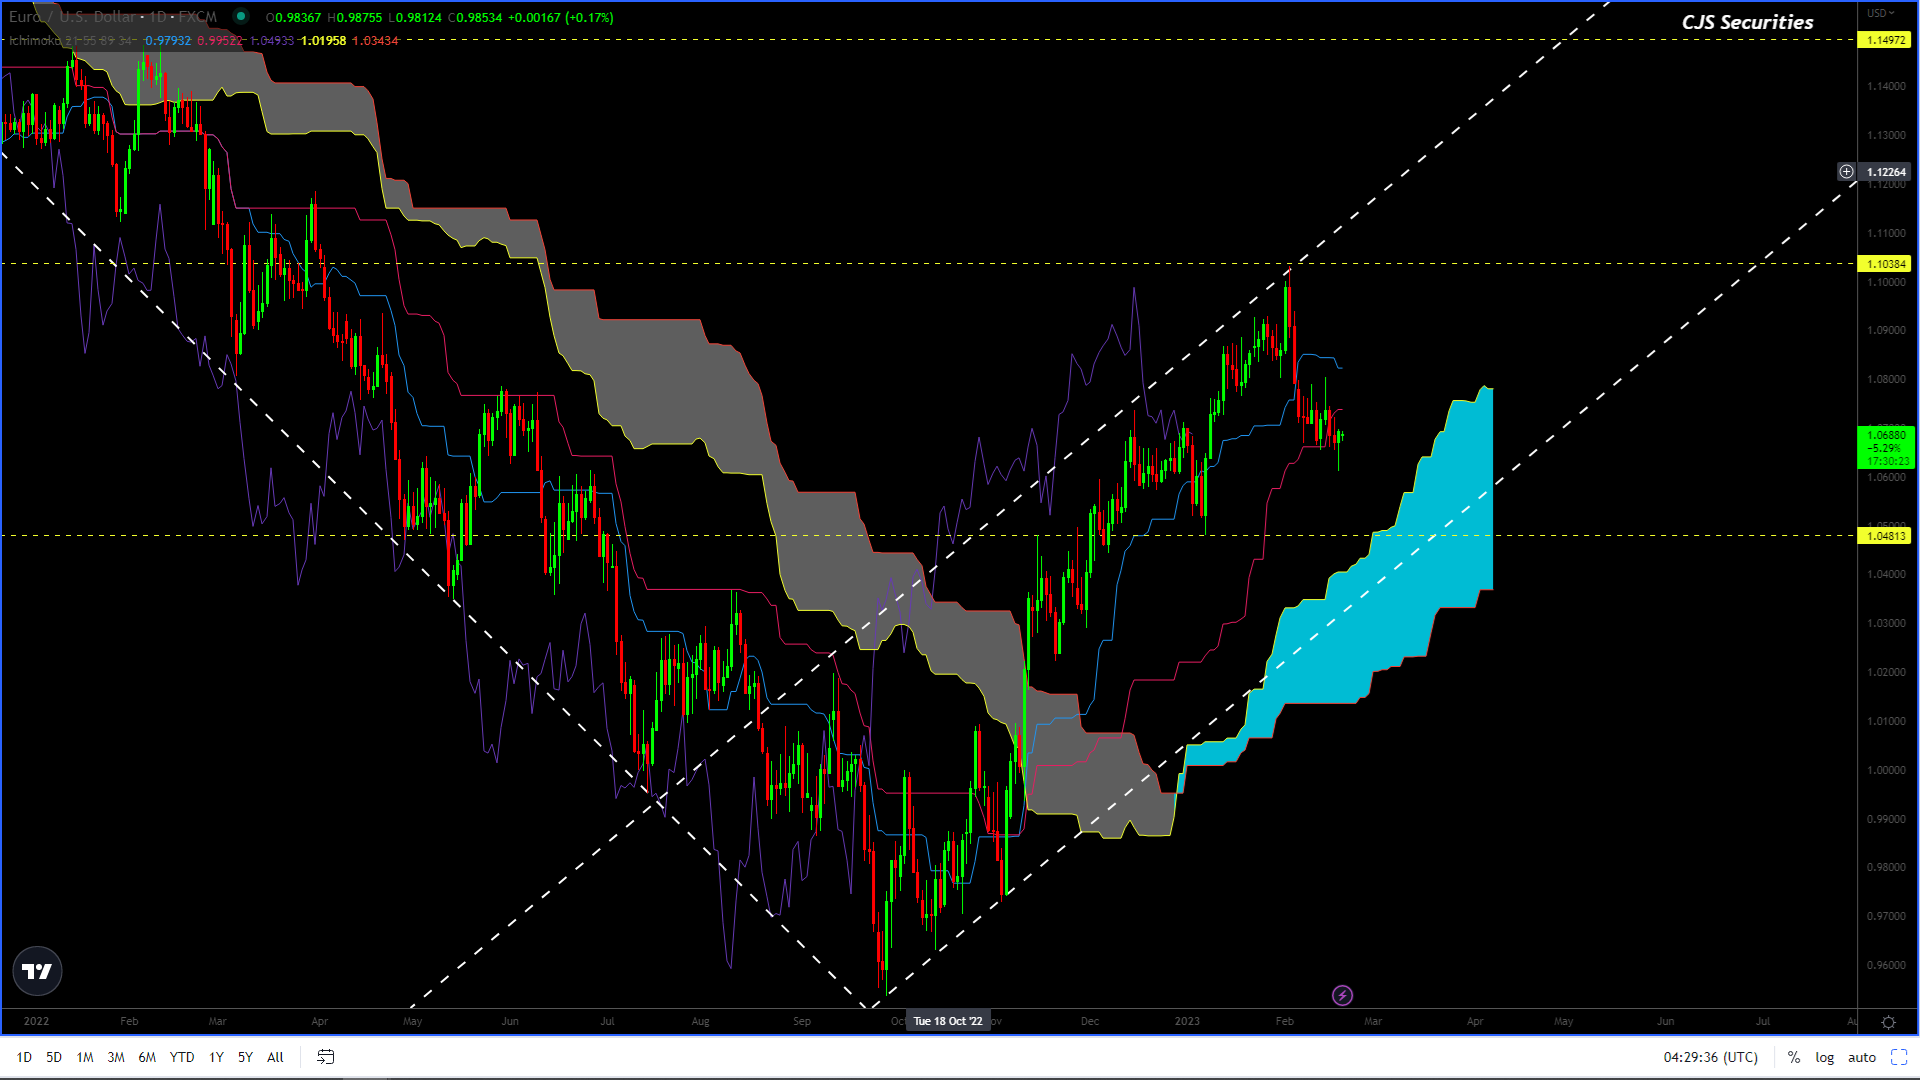
EURO/USD Daily Candle
Ladies and Gentlemen.
I cannot truly explain just how “perfectly” the Euro / Dollar chart is trading.
IMHO, the Dollar is done, at least for the next 24 months and all pullbacks like the one we are experiencing now are Euro-buying opportunities.
My targets over the next 24 months range from $1.15 (which the chart should easily achieve) to $1.25.
This is one of the clearest pictures I have seen in a while and coincides with the DXY chart below.
“Don’t be a hero. Don’t have an ego. Always question yourself and your ability. Don’t feel that you are very good. The second you do, you are dead.” – Paul Tudor Jones
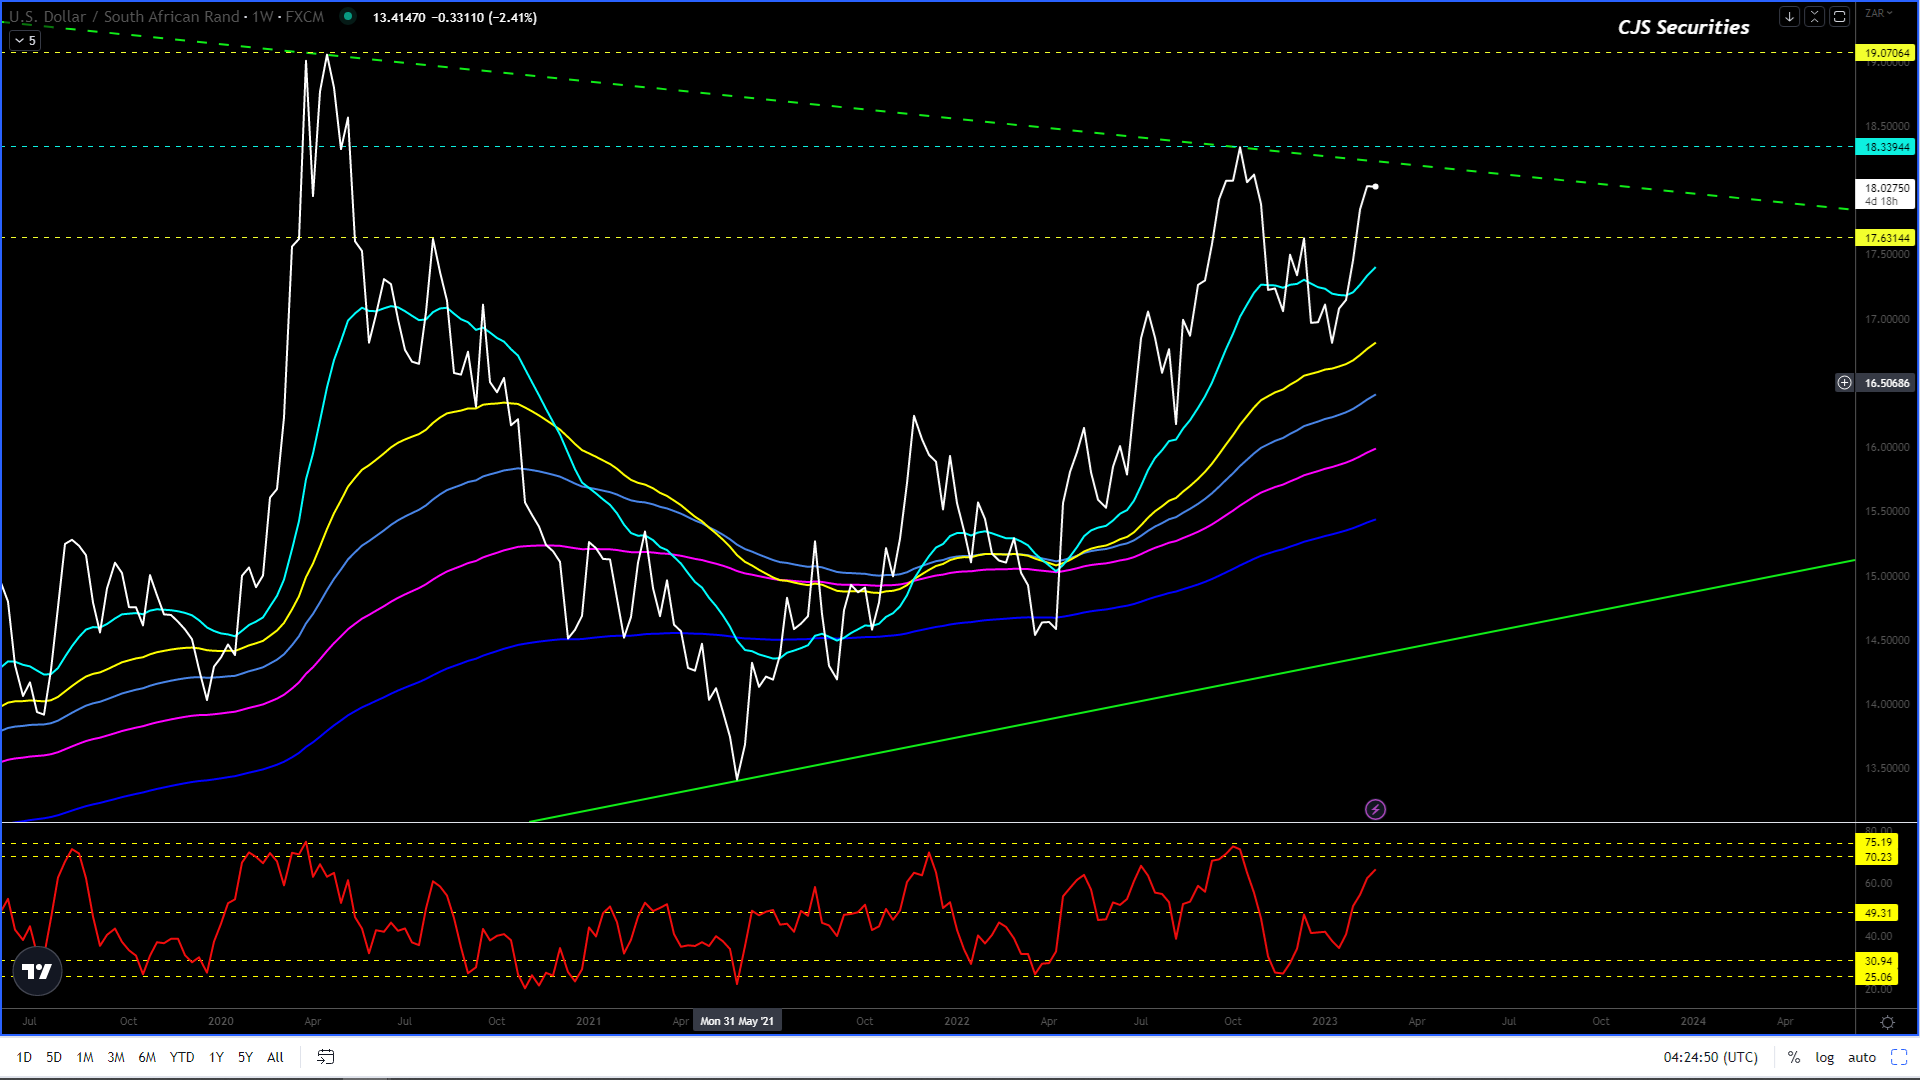
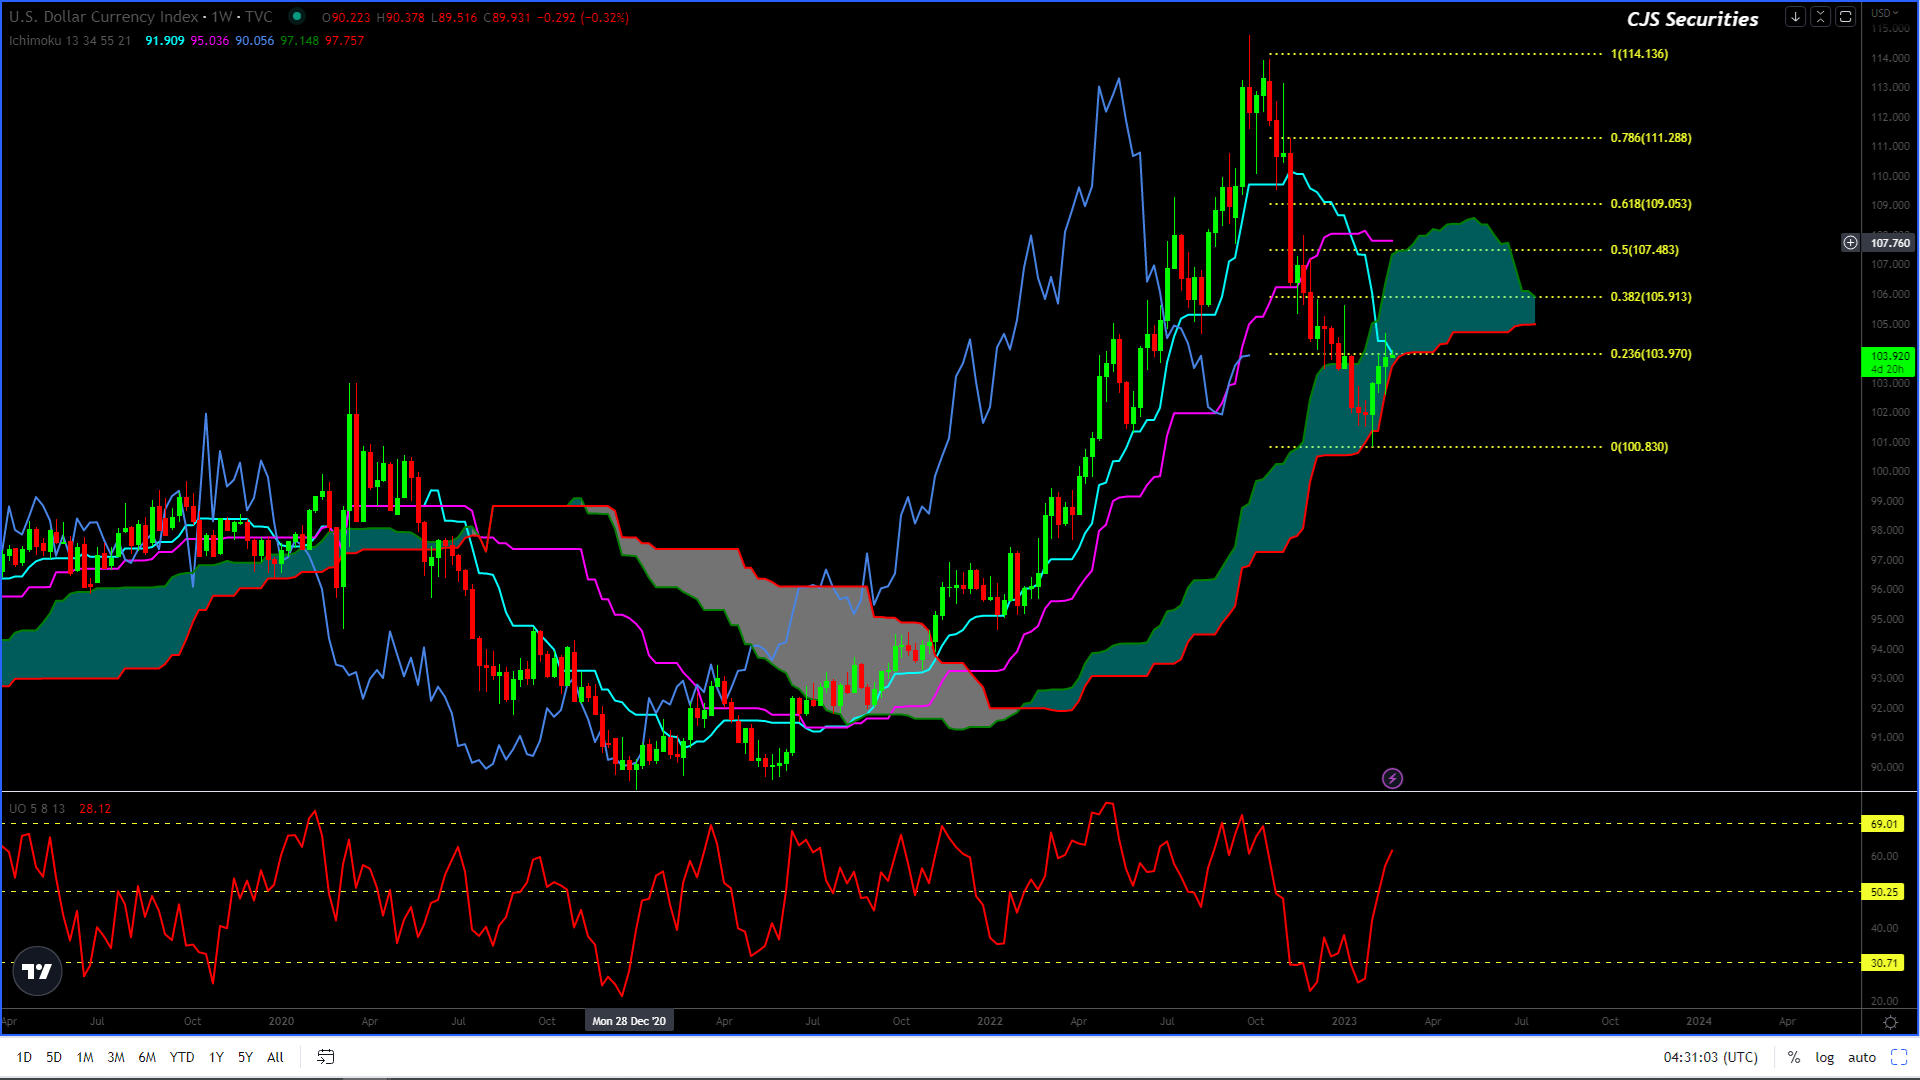
US Dollar Index Weekly Candle
My Friend the DXY
This Weekly Candle / Cloud chart is another chart that paints a pretty picture and dovetails wonderfully with the Euro chart.
Very few people were bearish about this chart over 110, but after printing what IMO is the MT – LT high at 115there is serious scope for this chart to trade back to the low 90’s.
I Am looking for this chart to make between a 38.2% – 50% pullback before heading lower.
This will also see the chart test the top of the cloud.
In Technical analysis terms this chart along with the Euro chart is trading amazingly, let us all hope it holds!
It’s been a long three weeks, with volatility being the order of the day and the ZAR trading on its steam, and frankly, I have had no objective view, hence my reluctance to post anything.
Please keep the last few weeks in the memory bank when reading the below commentary.
As most of you will know, I have been bearish on the ZAR and looking for upside targets from R17.50 – R18.30.
This was predominantly why I was confused, as I felt the chart could be done.
Based on this last move, I am convinced that we will see the last leg higher and although I have R18.30 as an upside target, please note that the ZAR has a propensity to overshoot in both directions.
Once this last leg up has been completed, my LT view that we see the ZAR strengthen is still very much on the cards.
The carry is your friend, never forget.
Daily Candle
This chart is looking great and complements the Weekly Close perfectly.
Please note that a week in trading could be a lifetime and especially so when it comes to the Dollar / Rand with Weekly targets around R17.65 and daily targets that could trade as high as R18.70.
The Daily oscillator is well on its way, plus the general formation has me bullish on the USD in the ST.
My general feeling is that the DXY has a leg higher and the Euro a leg lower and that USD strength will persist for a few weeks.
Good luck out there, and remember, trade the market, do not marry it!