I am now calling the low of the market for the MT but will only get excited once we have a Weekly Close over $13.02.
One should use the volatility to play the ranges with a bias to building a decent long sub $12.00!– I hope many of you played ball sub $12.00as we printed $11.84.
Most should be long at seriously good levels sub $12.00 and feeling very comfortable.
We just need to ride out the next few weeks before the rally continues in earnest!
240 Min CBOT January 22 Soybean Candle Chart
New chart time frame, same bullish view, the current levels and lower are a buy.
I really like what I see currently and a close over $12.95 will give us targets at $13.48 & $14.14!
Board Crush Continuous Daily Close
This chart has had a great pullback to it’s support and with the oscillator coming off oversold levels, I expect a re-testing of the highs.
Although we are bullish we will need support to hold and confirm before getting long.
Oil Share Continuous Daily Close
After kicking off extremely oversold levels, this chart is now in limbo.
We are keen to sell a rally but will need to see how high it wants to kick.
Weekly SAF Soy Continuous Close
#No change in commentary
After bottoming sub R7000, This chart looks great, and I expect a move to over R8000 in the coming weeks!
One should use weakness to price daily! – this has been the staple over the last six weeks.
Weekly SAF Suns Continuous Close
#No change in commentary
New ATH’s and based on its formation, the chart wants to go higher.
I would advise having no part in this if you do not already have a position as both longs and shorts could see their wallets emptied.
Weekly CBOT Soy Oil Continuous Close
#No Change in Commentary, three weeks in a row now!
I am super bullish and starting to wonder if the energy / power issues in China will transpire as the trigger for the below number to play out?
I feel the correction is done, (I feel good about this one) and all the pullbacks from here are buying opportunities with upside targets between $0.85 -$0.89!
I almost feel that we don’t have enough cash to get as long as we should, buy at best and scale down, this is budget making stuff with sprinkling of retirement!!!!
Weekly CBOT SBM Continuous Close
#No change in the below commentary
I
love the chart, and after confirming a low, all the pullbacks are a chance to
BTFD’s!
Ok, I am about to change my whole view, although it remains bullish!
$5.95remains a massive level to close above, but as of now, I feel we could be going into a complex correction that has upside targets from$6.30 – $7.35.
So I remain bullish, but I am not sure that this will be the start of the next “bull” phase, however I do see $20 + move higher within the next couple of weeks, so BTD’s down to $5.65!
240 Min March 22 Corn Candle Chart Close
Ok, so here we have a new chart (Mar 2022) and a new MT view.
Firstly, we are happy we took a small profit on the Dec short, but now the time has come to go long!
I would buy at best and all the way down to Friday’s low with upside targets set at $6.18 -$6.31 which would give one around a $20.00 profit!
Weekly WM Continuous Close
The below view is still in place but I would advise putting in a stop profit should we have a daily close under R3400 on the Mar 2022 contract.
“We would look to start buying back sub R3250.’ – we hope you picked up some stock as this is from 2 weeks ago.
The big pullbacks are still decent buying opportunities.” – I cannot stress this enough!
Weekly YM Continuous Close
The below view is still in place but I would advise putting in a stop profit should we have a daily close under R3610 on the Mar 2022 contract.
This chart is headed to its targets, and well done to those who believed in BTD’s.
There are zero reasons to pick a top on this chart and do not get caught short over the next week, but instead wait to buy.
Weekly KC Wheat Continuous Close
#No Change in commentary
Congratulations to the Pigs who stayed long!!!!!
At this point, we could easily see this chart rally another $0.80 before coming off, and although we have missed the last part of this rally, we are now pleased to sit back and wait until the next opportunity comes our way!
Weekly Chicago SRW Wheat Continuous
#No Change in commentary
Congratulations to the Pigs who stayed long!!!!!
At this point, we could easily see this chart rally another $0.80 before coming off, and although we have missed the last part of this rally, we are now pleased to sit back and wait until the next opportunity comes our way!
Daily Close KC Wheat v Chicago SRW Continuous Close
The below view has played out even better than imagined, but we are still keen to stay out.
This chart now appears to want to target the $0.30level.
We are happy to sit back for a few weeks longer before getting involved.
Weekly SAF Wheat Continuous Close
This chart could go even higher, but even so, we are now very happy to sit back and wait until the next opportunity comes our way!
Daily Matif Wheat Continuous Close
We are happy to sit back and allow this chart to develop over the coming weeks as this is not the place to get involved.
Ok, firstly for all, those asking me what is my feeling regarding the “new variant” and its effect on the ZAR, my answer is simple, I do not know and hence why I prefer to look at the market technically.
The chart blew through my levels and unfortunately it came over one of the most illiquid trading holidays, Thanksgiving!
But alas I have learnt long ago that markets will do whatever they want, whenever they want.
The Weekly Close at R16.26 is very bullish this chart and congratulations to all who played and made money on the inverted H&S formation.
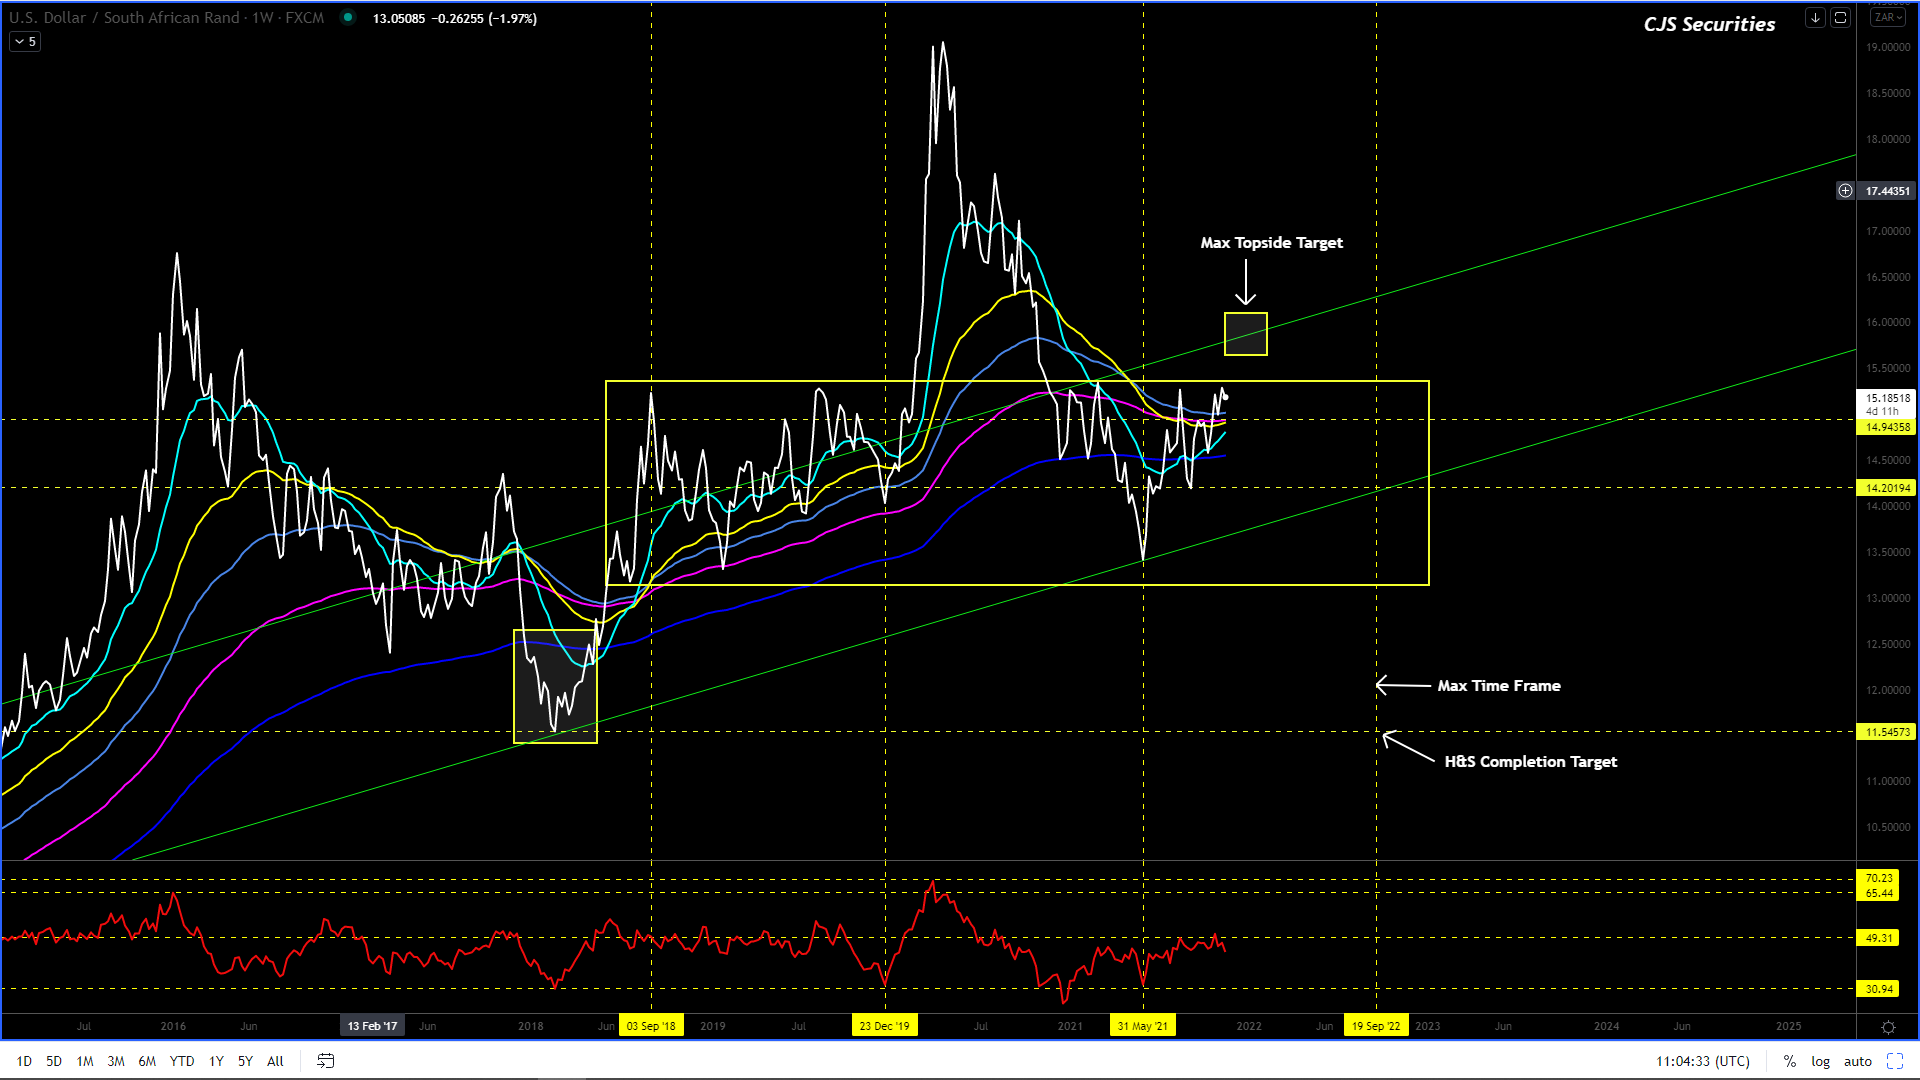
For those that are long USD, I would advise taking some cash if not all the cash as there might well be a pullback toward the R15.70 level.
This chart will only turn lower on a Weekly Close under R15.35.
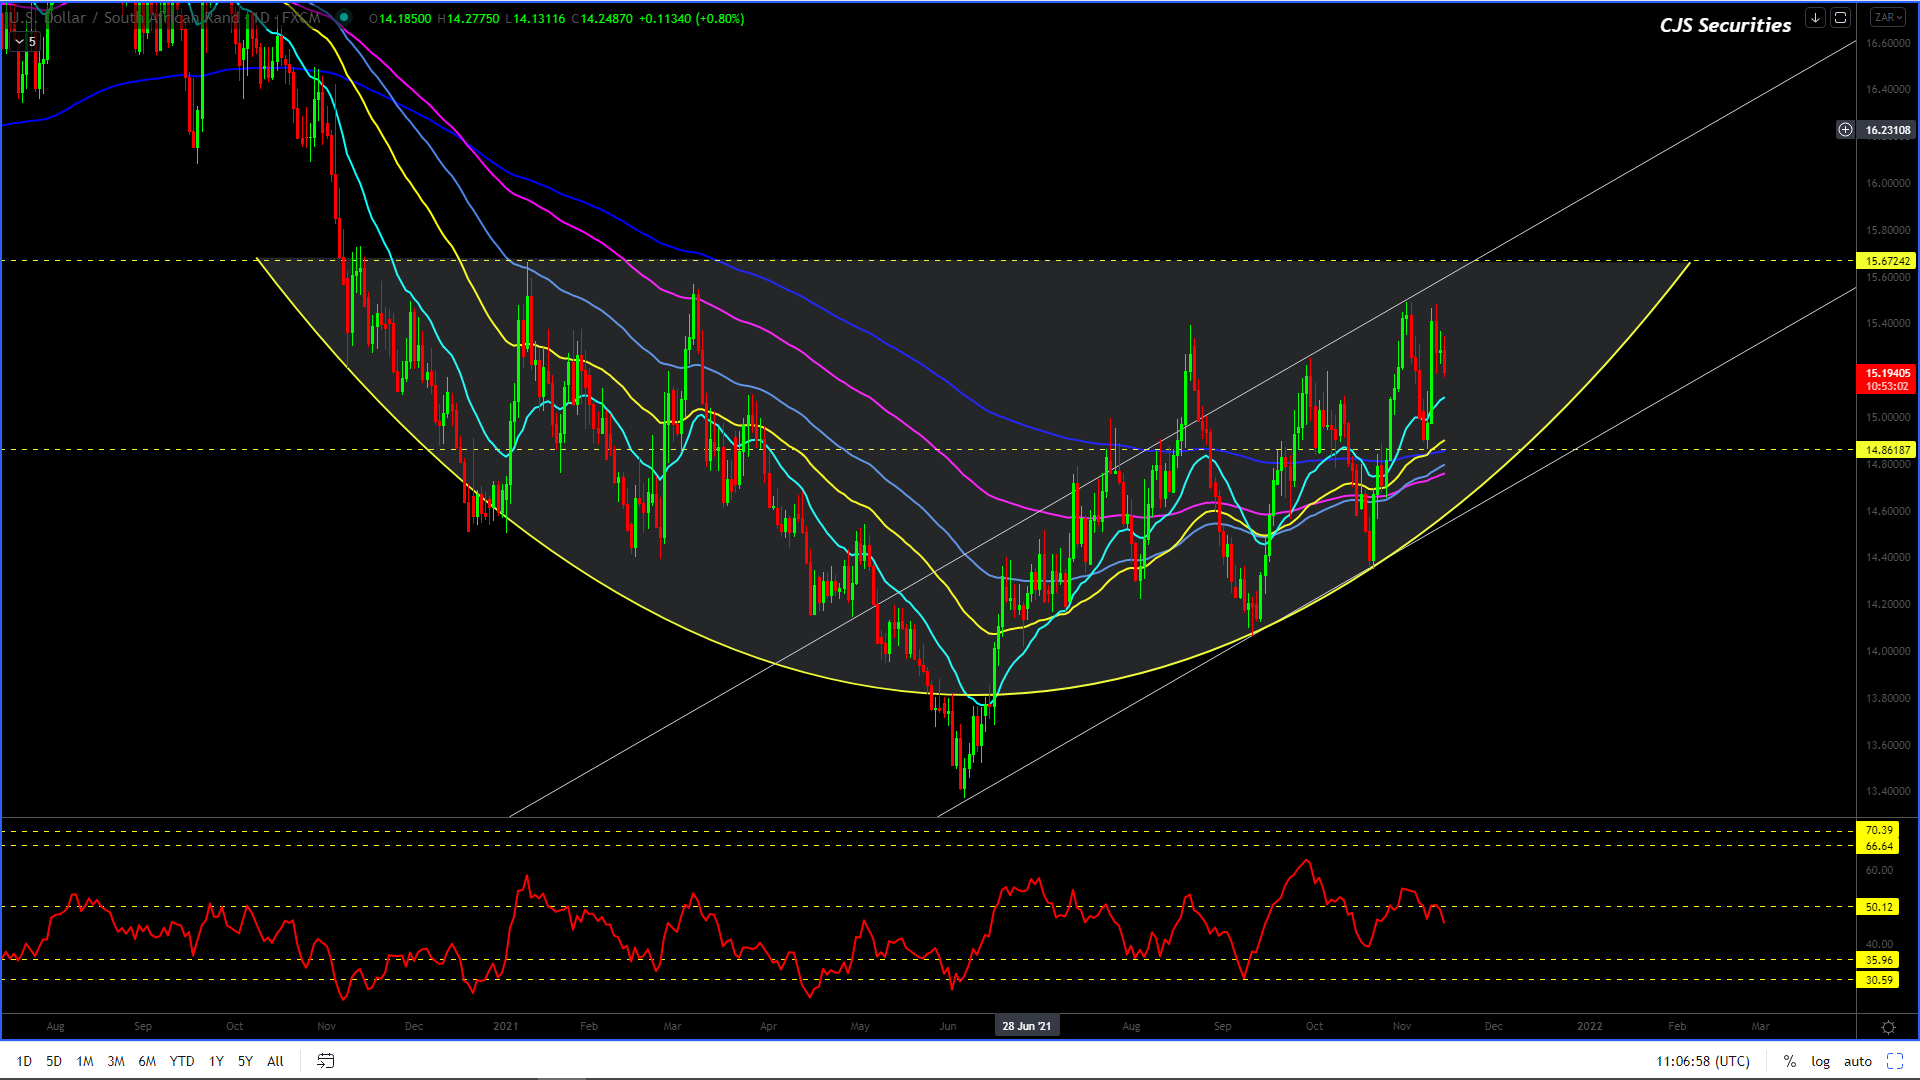
Dollar/Rand Daily Candle
First and foremost, congratulations to all those that traded the inverted H&S formation, I did not have the conviction.
The charts are now strictly bullish, but that a move back over R16.20 should be an opportunity to take some of the cash off the table as the pullback zone is from R15.74 – R15.51.
Expect R15.97 to provide some very good support in the ST.
Should this chart trade under R15.50 would the bullish technical action be negated.
In closing, keep your stops tight! – goes to show why we do it, as anything can happen and mostly likely will happen, especially over US trading holidays!
Dollar/Rand 240 min Candle
Firstly, the below trade did not work out, but we are in a good place as long as we follow our RR structures.
Sell R16.08 with a stop over R16.20 with targets at R15.38.
This trade will have a RR of 58/10.
As for the chart’s current formation, the only thing I can see from here is that R15.97 will provide excellent support and that there could easily be another leg higher before any significant pullback.
Due to the ferocity of this move and the “black swan” feeling associated with the activity, I am hesitant to put a trade on and would like the chart to play out for another week.
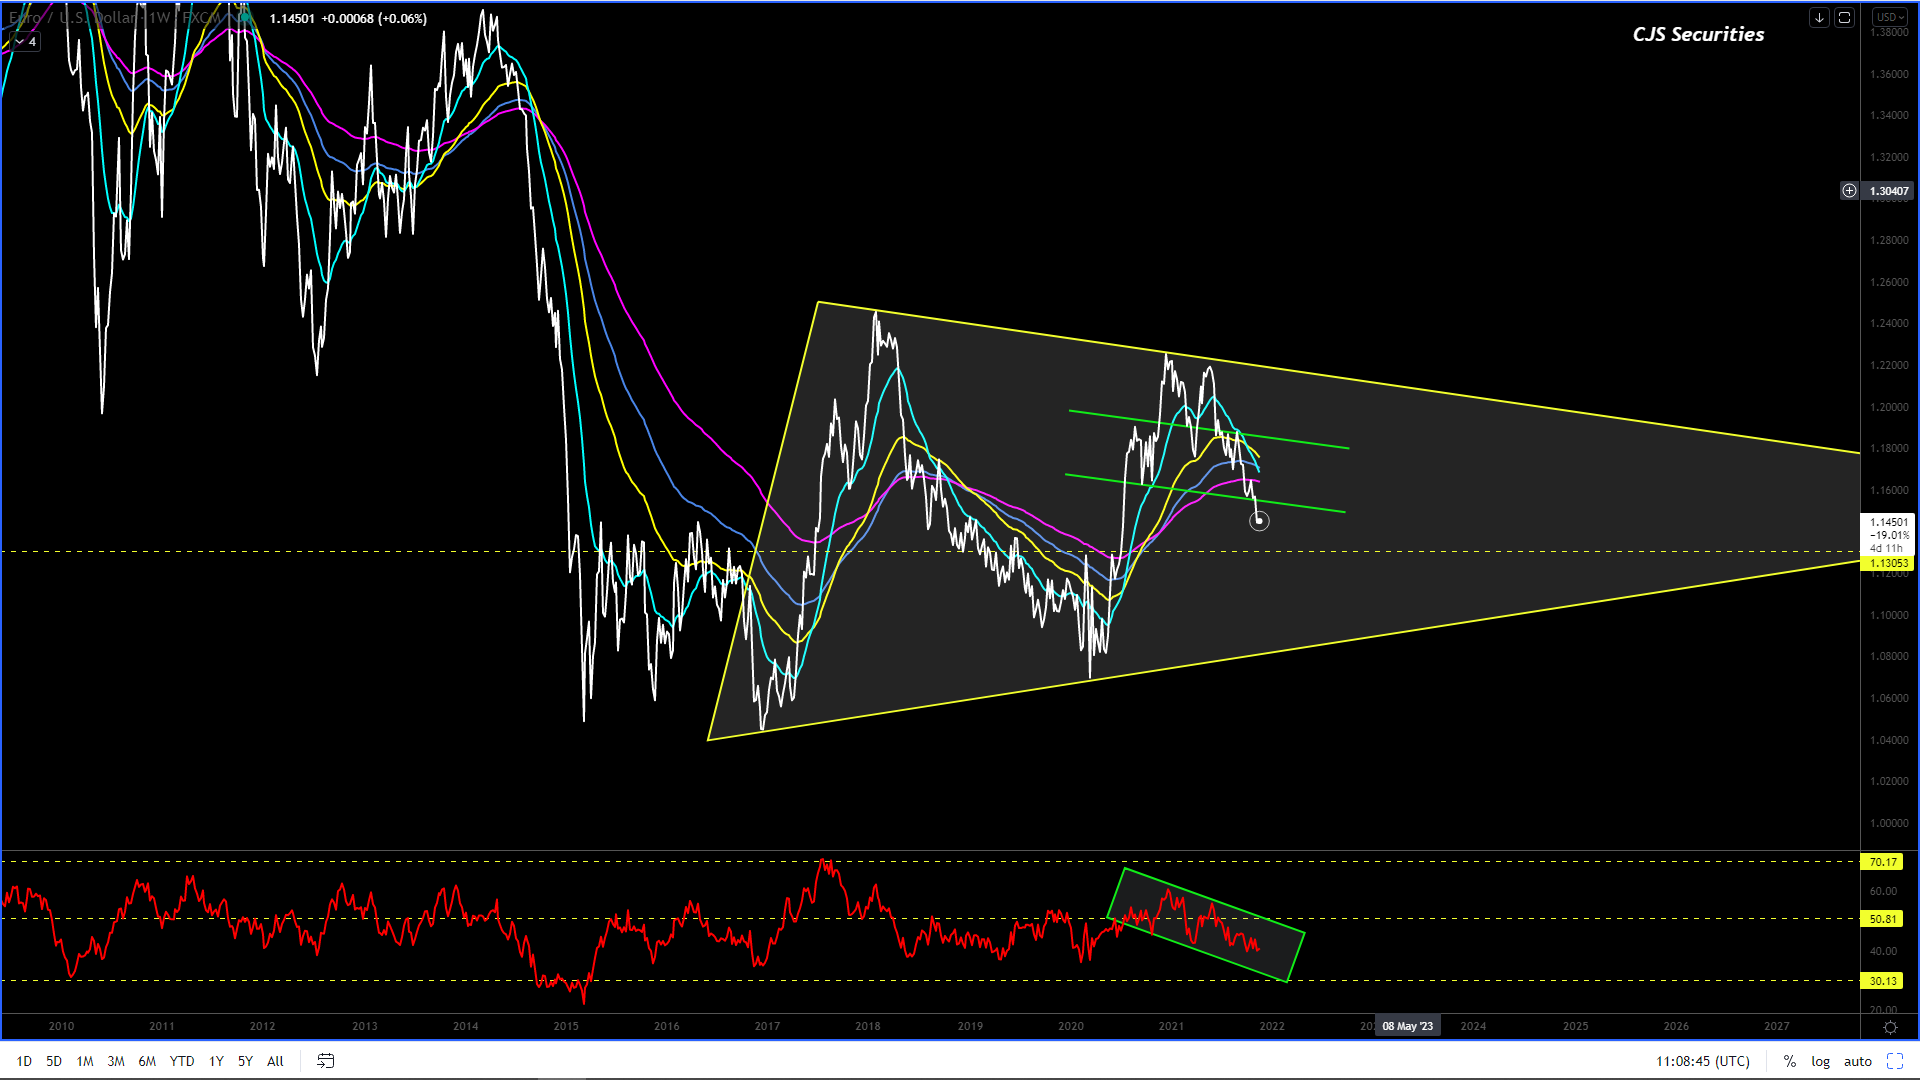
Euro/USD Weekly Close
#No Change in the below commentary
The USD remains broken and all I know is that $1.1250 is massive on a Weekly Close and if she goes we might print sub $1.10 before this chart even thinks about kicking.
We will need this chart to play out over a few weeks before “hopefully” gaining greater insight.
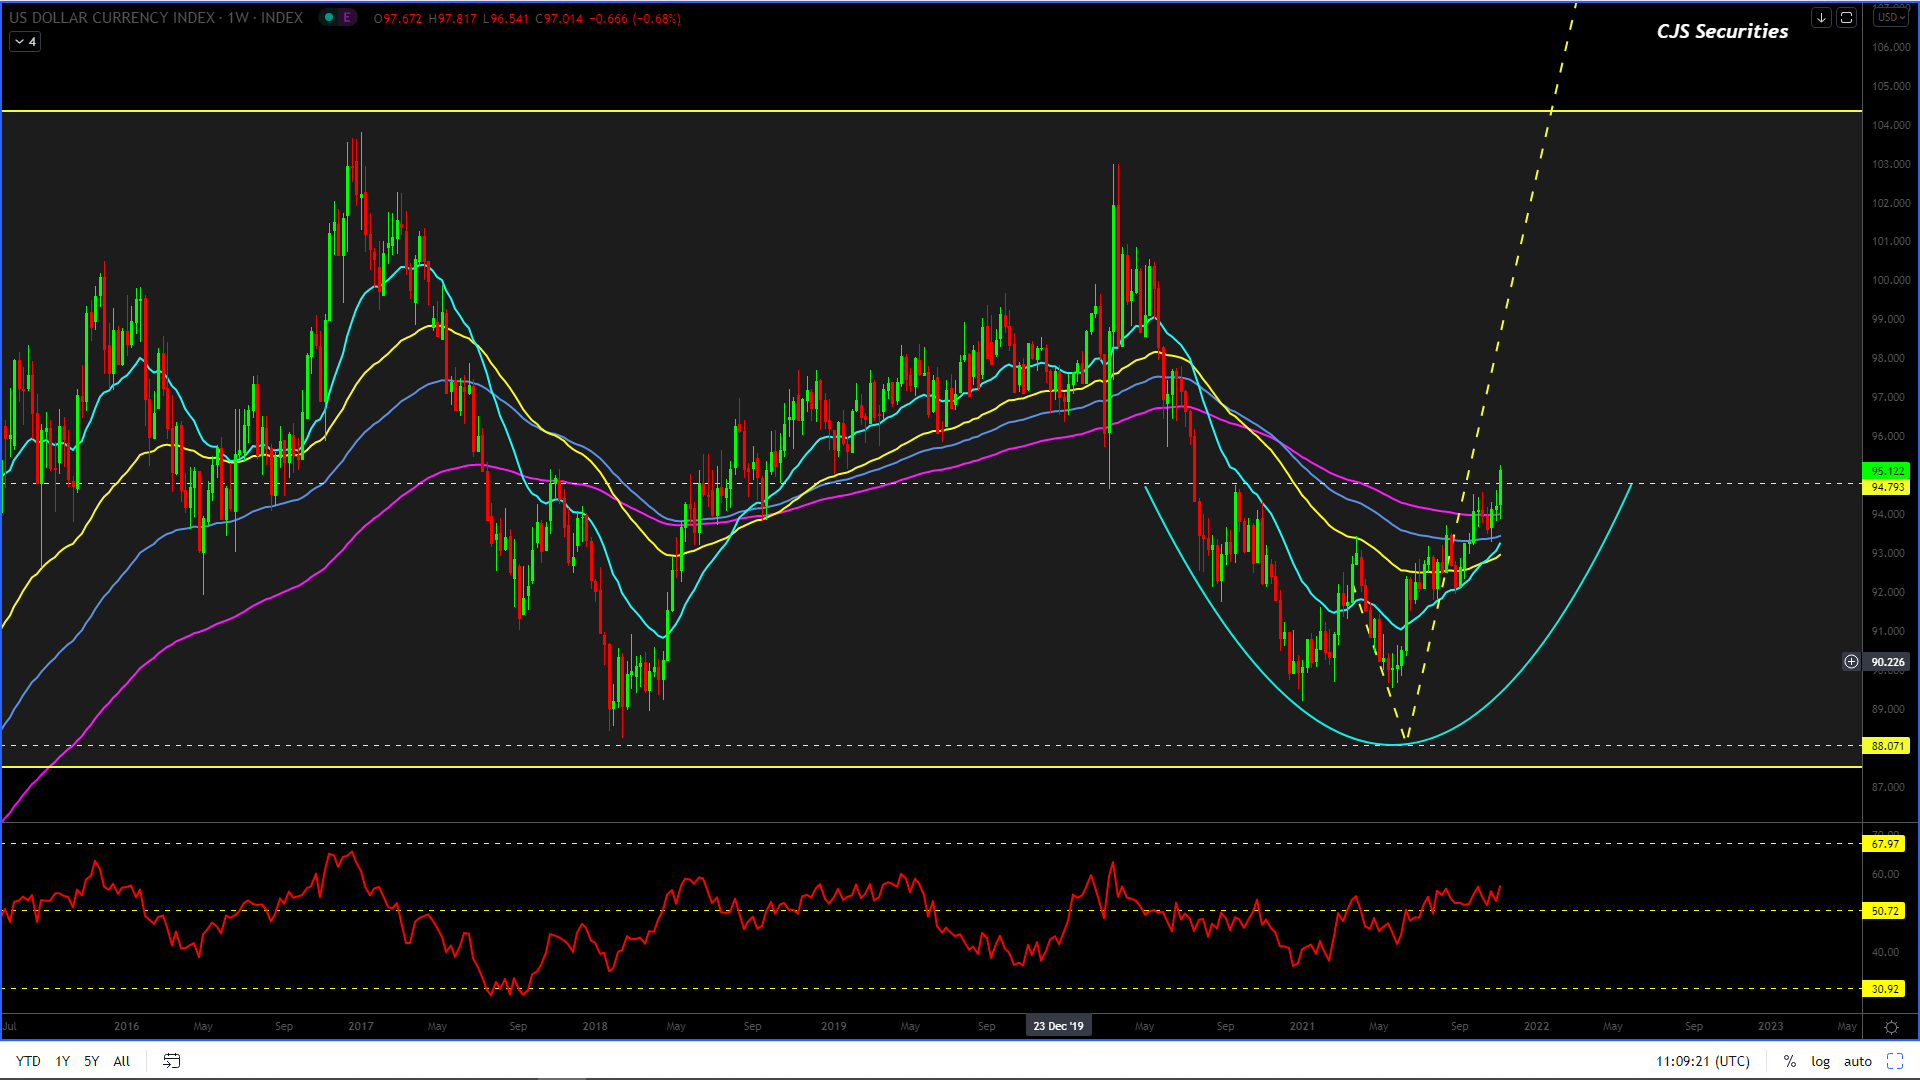
US Dollar Index Weekly Candle
The only thing I can add to the below is that if the last candle plays out this chart might have had a false break.
But it is early days and should take 3 weeks to playout.
We are long at 95.32 and will keep a tight stop under 95.
The road map is playing out very well and the sky is the limit.
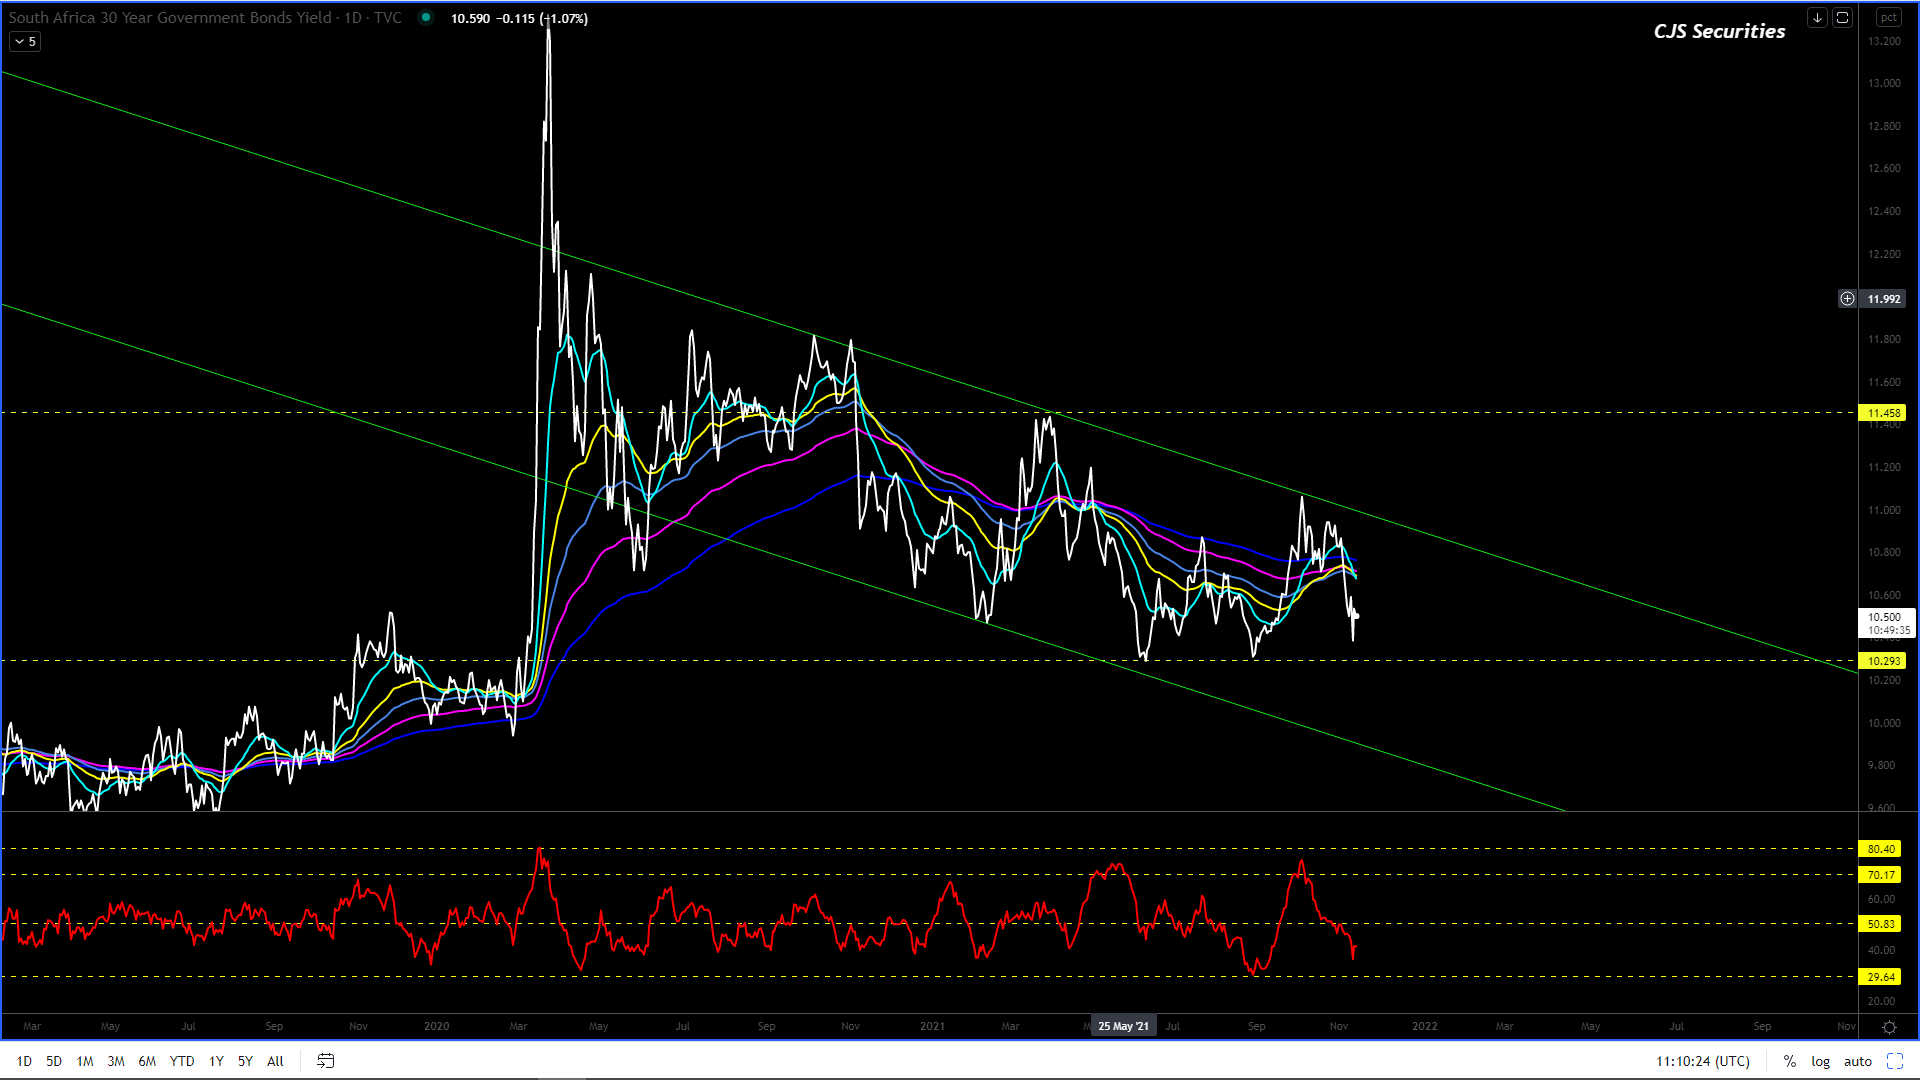
SA Government Bond 30 Year Yield Daily Close
Nice break of the trend, but now has double tops, but as it stands I can still see 11.40% printing within the next 4 – 8 weeks.
Expect the 11% level to provide massive resistance! – this has aged pretty well.
US Government Bond 30 Year Yield Weekly Close
I still favour the below view and the chart is now highly oversold.
I would look at buying a move back to 1.90% – 1.80%that will have upside targets from 2.58% – 2.71%.
Use an SL under 1.70%.
Please note that only a weekly close of over 3.50% will confirm that the trend has been broken.
I cannot change too much of the below commentary as I have to stick to my levels now.
I am not convinced this is the start of a “new bull” market as the short time frames keep me wondering.
I will only consider the correction over once we have a weekly close over $5.95.
We are pleased to be square until we have more confidence in our view.
I REMAIN really bullish in the “big picture” but, we could easily see this market come off and look to trade back sub $5.30and even$4.80. “
240 Min December 21 Corn Candle Chart Close
So much for sticking to my levels.
I will bail on this position, albeit slightly in the money (lucky me), because I am starting to see the last leg as consolidation, so I now have low conviction.
“We are short at $5.82, fingers crossed, as the below commentary has not changed.
Sell at best and all the way up to $5.94 with a stop over $5.96.
The downside targets will be sub $5.30 and hence this trade will have a 7/1 risk reward.
I REMAIN a proponent of BTD’s and take cash on the rallies until we confirm a bull market over $6.00!.”
Weekly WM Continuous Close
This chart looks great, and there is no reason it cannot continue to rally from current levels; hence, I say BTD’s.
“We would look to start buying back sub R3250.’ – we hope you picked up some stock as this is from 2 weeks ago.
The big pullbacks are still decent buying opportunities.” – I cannot stress this enough!
Weekly YM Continuous Close
This chart is headed to its targets, and well done to those who believed in BTD’s.
There are zero reasons to pick a top on this chart and do not get caught short over the next week, but instead wait to buy.
Weekly KC Wheat Continuous Close
Congratulations to the Pigs who stayed long!!!!!
At this point, we could easily see this chart rally another $0.80 before coming off, and although we have missed the last part of this rally, we are now pleased to sit back and wait until the next opportunity comes our way!
Weekly Chicago SRW Wheat Continuous
Congratulations to the Pigs who stayed long!!!!!
At this point, we could easily see this chart rally another $0.80 before coming off, and although we have missed the last part of this rally, we are now pleased to sit back and wait until the next opportunity comes our way!
Daily Close KC Wheat v Chicago SRW Continuous Close
This chart now appears to want to target the $0.30level.
We are happy to sit back for a few weeks longer before getting involved.
Weekly SAF Wheat Continuous Close
This chart has traded R200 higher than its original targets and could likely go even further, but even so, we are now very happy to sit back and wait until the next opportunity comes our way!
Daily Matif Wheat Continuous Close
We are happy to sit back
and allow this chart to develop over the coming weeks as this is not the
place to get involved.
I am now calling the low of the market for the MT but will only get excited once we have a Weekly Close over $13.02.
One should use the volatility to play the ranges with a bias to building a decent long sub $12.00!– I hope many of you played ball sub $12.00as we printed $11.84.
Most should be long at seriously good levels sub $12.00 and feeling very comfortable.
We just need to ride out the next few weeks before the rally continues in earnest!
240 Min CBOT November 21 Soybean Candle Chart
I seriously doubt that this chart will make a new low but rather only a pullback!
I really like what I see currently so keep BTD’s and play the ranges until we have a move and close over $13.08 when the bull market confirms.
Board Crush Continuous Daily Close
After a massive rally and topping out, this chart is pulling back.
We are keen to get in again but will need more data / a better formation before making a decision.
Oil Share Continuous Daily Close
More downside this last week, but this chart is due a serious kick as its extremely oversold.
We are keen to sell a rally but will need to see how high it wants to kick
Weekly SAF Soy Continuous Close
After bottoming sub R7000, This chart looks great, and I expect a move to over R8000 in the coming weeks!
One should use weakness to price daily! – this has been the staple over the last six weeks.
Weekly SAF Suns Continuous Close
New ATH’s and based on its formation, the chart wants to go higher.
I would advise having no part in this if you do not already have a position as both longs and shorts could see their wallets emptied.
Weekly CBOT Soy Oil Continuous Close
#No Change in Commentary. (steady as she goes)
I am super bullish and starting to wonder if the energy / power issues in China will transpire as the trigger for the below number to play out?
I feel the correction is done, (I feel good about this one) and all the pullbacks from here are buying opportunities with upside targets between $0.85 -$0.89!
I almost feel that we don’t have enough cash to get as long as we should, buy at best and scale down, this is budget making stuff with sprinkling of retirement!!!!
Weekly CBOT SBM Continuous Close
#No change in the below commentary
I
love the chart, and after confirming a low, all the pullbacks are a chance to
BTFD’s!
Good Afternoon and apologies for not sending the reports out yesterday, but I have recently taken up Bog Snorkeling, and there was a new Bog I just had to Snorkel.
Back to business, the chart has traded up to and printed the much-vaunted R15.88 level and could quite possibly still print R16.08.
However, I still feel this is not the start of a ZAR blowout, and only a Weekly Close over R16.00 would have me negate this view.
On the fundamental side, Fed Chairman Jerome “printer” Powell has been renominated for another term.
One would think this will be good for the ZAR as the carry trade attractiveness should be looking a lot sexier in the medium term.
Dollar/Rand Daily Candle
For those trading the inverted H&S congratulations, now might be the time to take some cash off the table.
I am not keen to have a position up here as only a Weekly Close over R16.00 would get me long and until it does square feels so right.
Because R15.50 was such a significant upside level, it now serves as the “break lower level,” and until it is breached this chart remains bullish.
In closing, keep your stops tight!
Dollar/Rand 240 min Candle
We are now two for two, and this makes me both nervous and excited!
Buy R15.17 – R15.11 with a stop under R15.0800 and look to sell out at R15.45.– great trade!
Today we have another trade we are hunting.
Sell R16.08 with a stop over R16.20 with targets at R15.38.
This trade will have a RR of 58/10.
Euro/USD Weekly Close
The USD remains broken and all I know is that $1.1250 is massive on a Weekly Close and if she goes we might print sub $1.10 before this chart even thinks about kicking.
We will need this chart to play out over a few weeks before “hopefully” gaining greater insight.
US Dollar Index Weekly Candle
We are long at 95.32 and will keep a tight stop under 95.
The road map is playing out very well and the sky is the limit.
SA Government Bond 30 Year Yield Daily Close
The chart is trading nicely and as it stands I can still see 11.40% printing within the next 8 – 12 weeks.
Expect the 11% level to provide massive resistance!
US Government Bond 30 Year Yield Weekly Close
#I still favour the below view, but this chart is not very pretty at all.
I would look at buying a move back to 1.90% – 1.80%that will have upside targets from 2.58% – 2.71%.
Use an SL under 1.70%.
Please note that only a weekly close of over 3.50% will confirm that the trend has been broken.
Herewith is the Weekly
Candle chart, and as it stands, the charts looks pretty bullish with very
decent support from R14.84 – R15.03.
This chart could quickly
spike up to the R16.00level and potentially slightly higher.
Reiterating what I wrote
in Monday’s report, I am not sold that this is the major blowout and that a
decent rally in this chart would be an opportunity to take some profit on your
USD long positions.
As for this afternoon’s
rate decision, a 25 BIP hike seems to be priced in, so should the MPC not raise
rates combined with USD strength, this could precipitate a potential R0.60move higher.
While a hike and a hawkish
speech could see the ZAR strengthen once again.
The latter is my preferred
view.
Good luck out there, and I
do not see the point of carrying sizable risk into this afternoon!
I am not convinced this is the start of a “new bull” market as the short time frames keep me wondering.
I will only consider the correction over once we have a weekly close over $5.95.
We are pleased to be square until we have more confidence in our view.
I REMAIN really bullish in the “big picture” but, we could easily see this market come off and look to trade back sub $5.30and even$4.80. “
240 Min December 21 Corn Candle Chart Close
I have to stick to my guns and the below trade, and based on the chart currently, I am not sold on this being the start of the “new bull” market, but luckily for me, I happen to know where I am wrong.
“We are short at $5.82, fingers crossed, as the below commentary has not changed.
Sell at best and all the way up to $5.94 with a stop over $5.96.
The downside targets will be sub $5.30 and hence this trade will have a 7/1 risk reward.
I REMAIN a proponent of BTD’s and take cash on the rallies until we confirm a bull market over $6.00!.”
Weekly WM Continuous Close
Today we saw an explosion in the price vs. the rest of the market
We would look to start buying back sub R3250. – we hope you picked up some stock.
“The big pullbacks are still decent buying opportunities.” – I cannot stress this enough!
Weekly YM Continuous Close
The chart looks very decent, and we remain proponents of BTD’s
“Now is the time to look to buy back those shorts.” – This has aged well.
Weekly KC Wheat Continuous Close
New highs and for those that have been piggish, well done as I lacked the big brass ones to stay long, never the less decent profits were made by all.
This chart still has upside based on the oscillator being nowhere overbought.
Good luck to the longs, and always remember pigs generally get slaughtered.
We are now very happy to sit back and wait until the next opportunity comes our way!
Weekly Chicago SRW Wheat Continuous
New highs and for those that have been piggish, well done as I lacked the big brass ones to stay long, never the less decent profits were made by all.
This chart still has upside based on the oscillator being nowhere overbought.
Good luck to the longs, and always remember pigs generally get slaughtered.
We are now very happy to sit back and wait until the next opportunity comes our way!
Daily Close KC Wheat v Chicago SRW Continuous Close
This chart has topped out
for the MT and traded just short of its targets at $0.28.
We are happy to sit back
for a few weeks.
Weekly SAF Wheat Continuous Close
I am very unsure what I am now looking at, especially after the Sep 21 squeeze.
We are now very happy to sit back and wait until the next opportunity comes our way!
Daily Matif Wheat Continuous Close
We are happy to sit back and allow this chart to develop over the coming weeks.
Keep your eye on the potential divergence developing!
Whether the low is in or not, as previously mentioned, only a rally and Weekly Close over $13.02 will get me excited.
One should use the volatility to play the ranges with a bias to building a decent long sub $12.00!– I hope many of you played ball sub $12.00as we printed $11.84.
Most should be long at really good levels sub $12.00 and for those that know the crypto markets the best advice I can give right here, right now is to hold and buy more on the way down as the price action is starting to look very much like it wants to print $11.50.
240 Min CBOT November 21 Soybean Candle Chart
In
the big picture, this chart and its formation are set to rally.
The
only question is, does it make a new low?
I
hope you all repurchased your long positions on the last dip even though:
“I
don’t like this formation and although it can trade higher this chart needs and
should see another leg lower.
Keep
BTD’s and play the ranges until we have a move and close over $13.08when the
bull market confirms.
Board Crush Continuous Daily Close
This chart is mental, and all I can say is that it’s now overbought, but who knows just how high it can go, not me!
We are happy to sit out for now.
Oil Share Continuous Daily Close
It looked like when 47% went, the market collapsed.
However, the market is seriously oversold in the ST, and I expect a kick and consolidation before seeing further downside.
Weekly SAF Soy Continuous Close
The below commentary has not changed for weeks now, and all I can say is that you all used weakness to price.
The chart is coming off beautifully and, with a bit of luck, could still trade as low as R6700.00.
Irrespective of the market moving, one should use weakness to price, daily!
Weekly SAF Suns Continuous Close
Based on its formation, the chart seems to be consolidating before going higher, but I would advise having no part in this as both longs and shorts could see their wallets emptied.
Weekly CBOT Soy Oil Continuous Close
#No Change in Commentary. (steady as she goes)
I am super bullish and starting to wonder if the energy / power issues in China will transpire as the trigger for the below number to play out?
I feel the correction is done, (I feel good about this one) and all the pullbacks from here are buying opportunities with upside targets between $0.85 -$0.89!
I almost feel that we don’t have enough cash to get as long as we should, buy at best and scale down, this is budget making stuff with sprinkling of retirement!!!!
Weekly CBOT SBM Continuous Close
Finally!!!!!!!
I
love the chart, and after confirming a low, all the pullbacks are a chance to
BTFD’s!
I believe that this chart is not ready for its “major break” higher yet!
In the ST, there are too many potential outcomes for me to mention, hence why I am happy to sit out for the time being and allow the chart to develop as it pleases.
Dollar/Rand Daily Candle
I am well aware that many people are calling for the inverted H&S to play out, but I have seen these formations fail more than I have seen them work, and it’s with this mind that currently, I am struggling to see this chart consistently trade over R16.00 in the ST / MT.
Overall though, I would not be surprised for this chart to make one last assault on the R15.50 level and potentially even breakthrough, but as previously mentioned, I would be a seller of the USD should we see those levels.
In closing, if you are keen to buy the USD, keep your stop under R14.88! – missed this with R0.0150
Dollar/Rand 240 min Candle
We seem to have had the below trade pretty spot on.
“Buy R15.00 – R14.90 with a stop under R14.8650.Targets will be at R15.47 – R15.66, and this trade will have a 35 / 10 risk-reward! “– super chuffed for those who executed.
This week we are going to see if lightning can strike twice!
Buy R15.17 – R15.11 with a stop under R15.0800 and look to sell out at R15.45.
This trade will give us risk-reward of 5 / 1.
Euro/USD Weekly Close
All I know is that the USD is broken, and I have no idea what I am looking at regarding whether this is a correction or whether it’s the start of a new leg that could trade as low parity.
We will need this chart to play out over a few weeks before “hopefully” gaining greater insight.
US Dollar Index Weekly Candle
Although we are over 95, we have not had a weekly close over 95 because I can’t stress just how important the 95 level is on a weekly close!
But with the chart being over 95 I am now compelled to get long and keep my stop as a weekly close under 95!
SA Government Bond 30 Year Yield Daily Close
Even though I remain unhappy with what I am looking I feel the ST low is in and that the chart should look to trade up from current levels.
The current formation (even though I am slightly more bullish) has more than two potential outcomes, and hence we are keen to stay out until we have a better view while the downside at 10.30% should remain very solid, I hope!
US Government Bond 30 Year Yield Weekly Close
#I still
favour the below view, but this chart is not very pretty at all.
I would look at buying
a move back to 1.90% – 1.80%that will have upside targets from 2.58% – 2.71%.
Use an SL under 1.70%.
Please note that only
a weekly close of over 3.50%will confirm that the trend has been broken.