I was wrong on a mammoth scale, and the Black Swan of WAR seems to have ended many a player.
Being wrong is nothing compared to what the people being affected by this war are experiencing, so with that in mind, let us hope for everyone’s sake this conflict ends soon.
I am not willing to make a call on any of these charts.
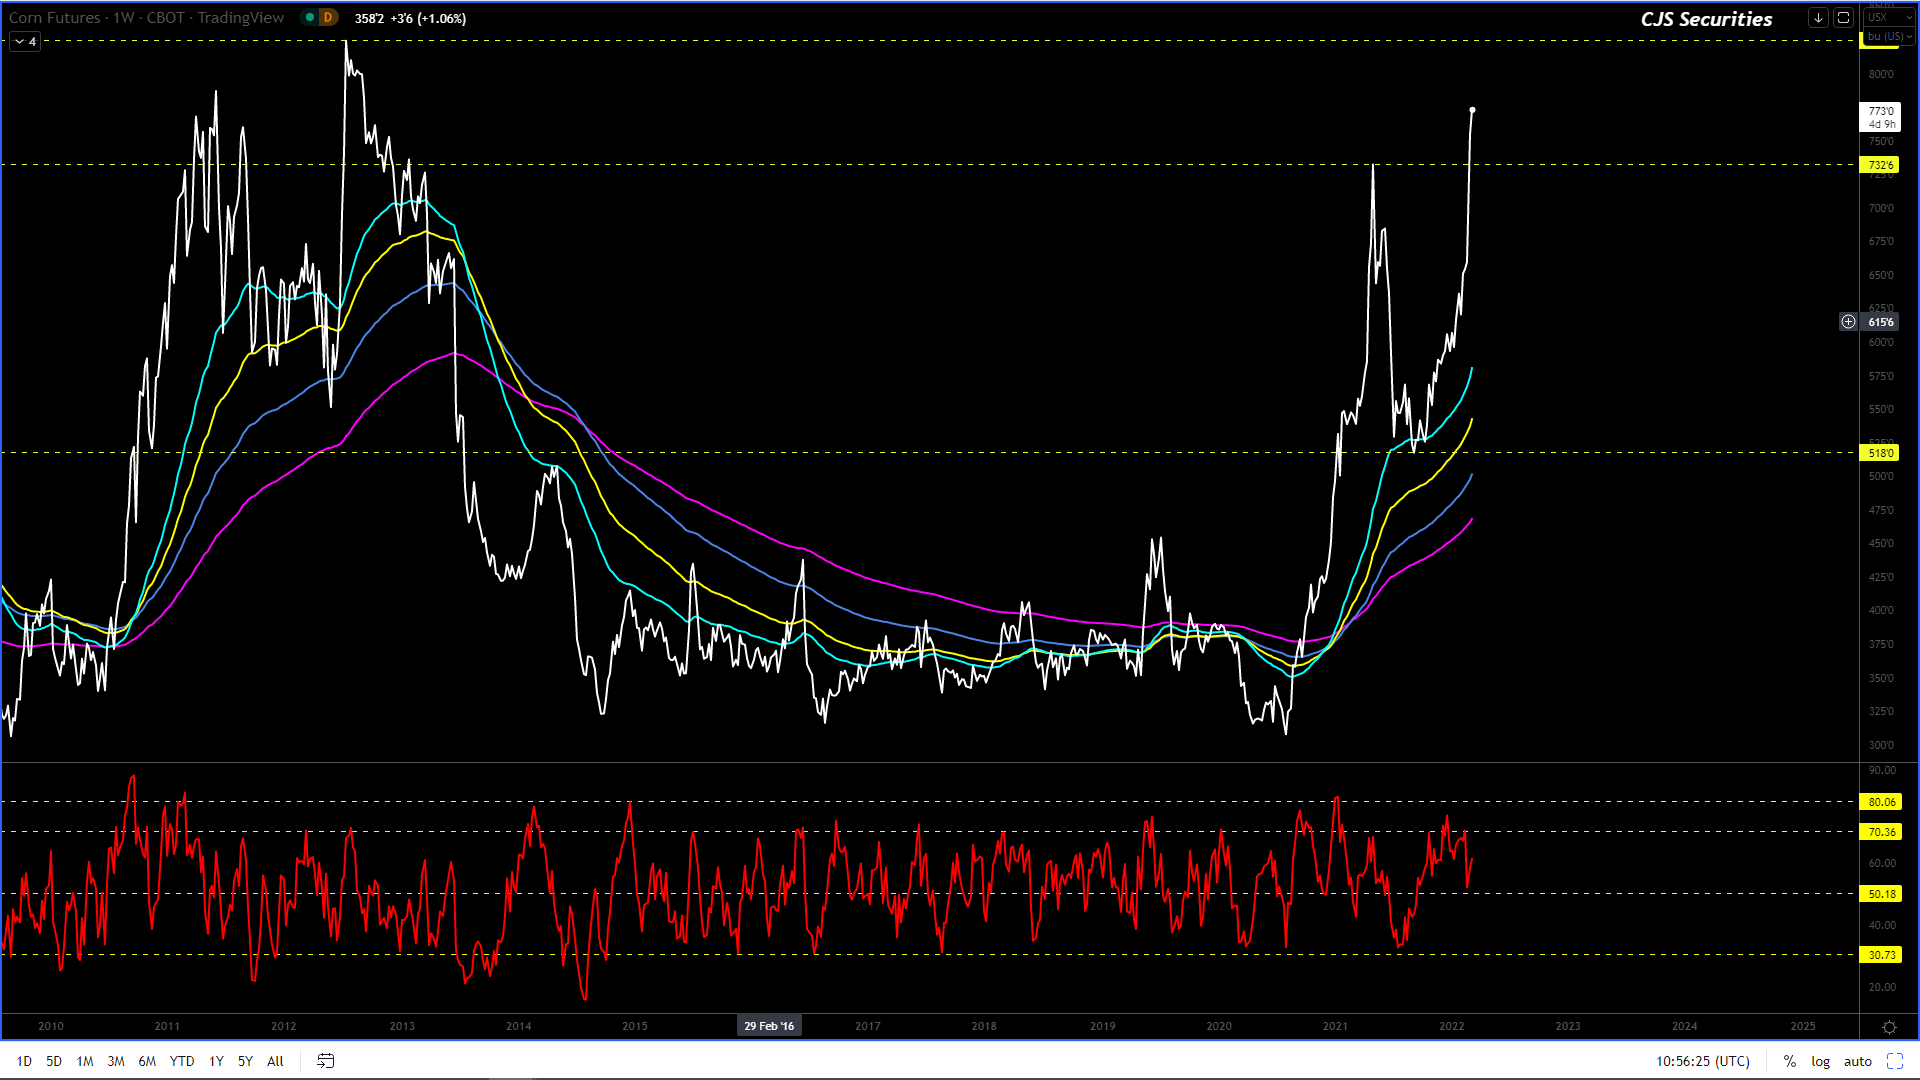
240 Min March 22 Corn Candle Chart Close
Again thank goodness for stop losses.
Technically this chart is now so 50/50, and hence I am happy to sit out until the dust has settled.
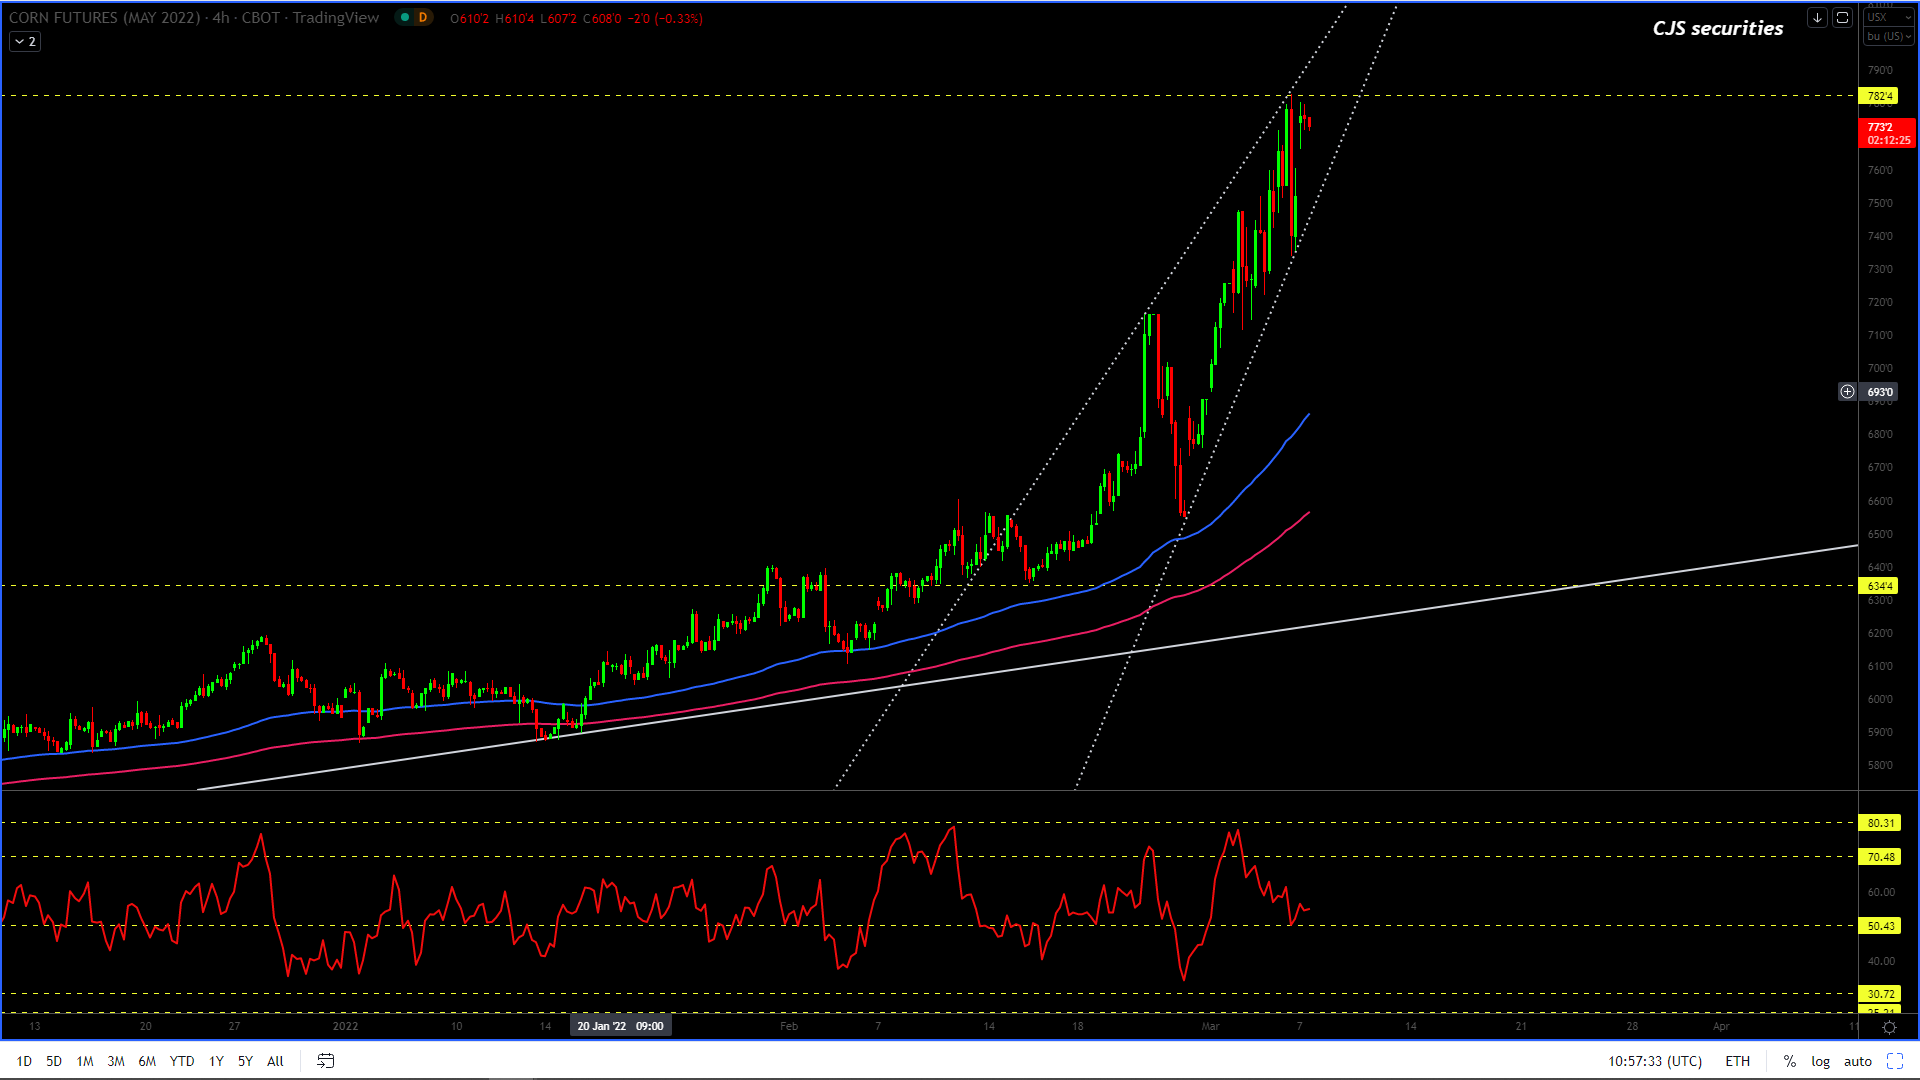
Weekly WM Continuous Close
Another chart I have had utterly wrong due to the Black Swan of WAR.
I have no strong views other than to urge producers to price as anything can happen.
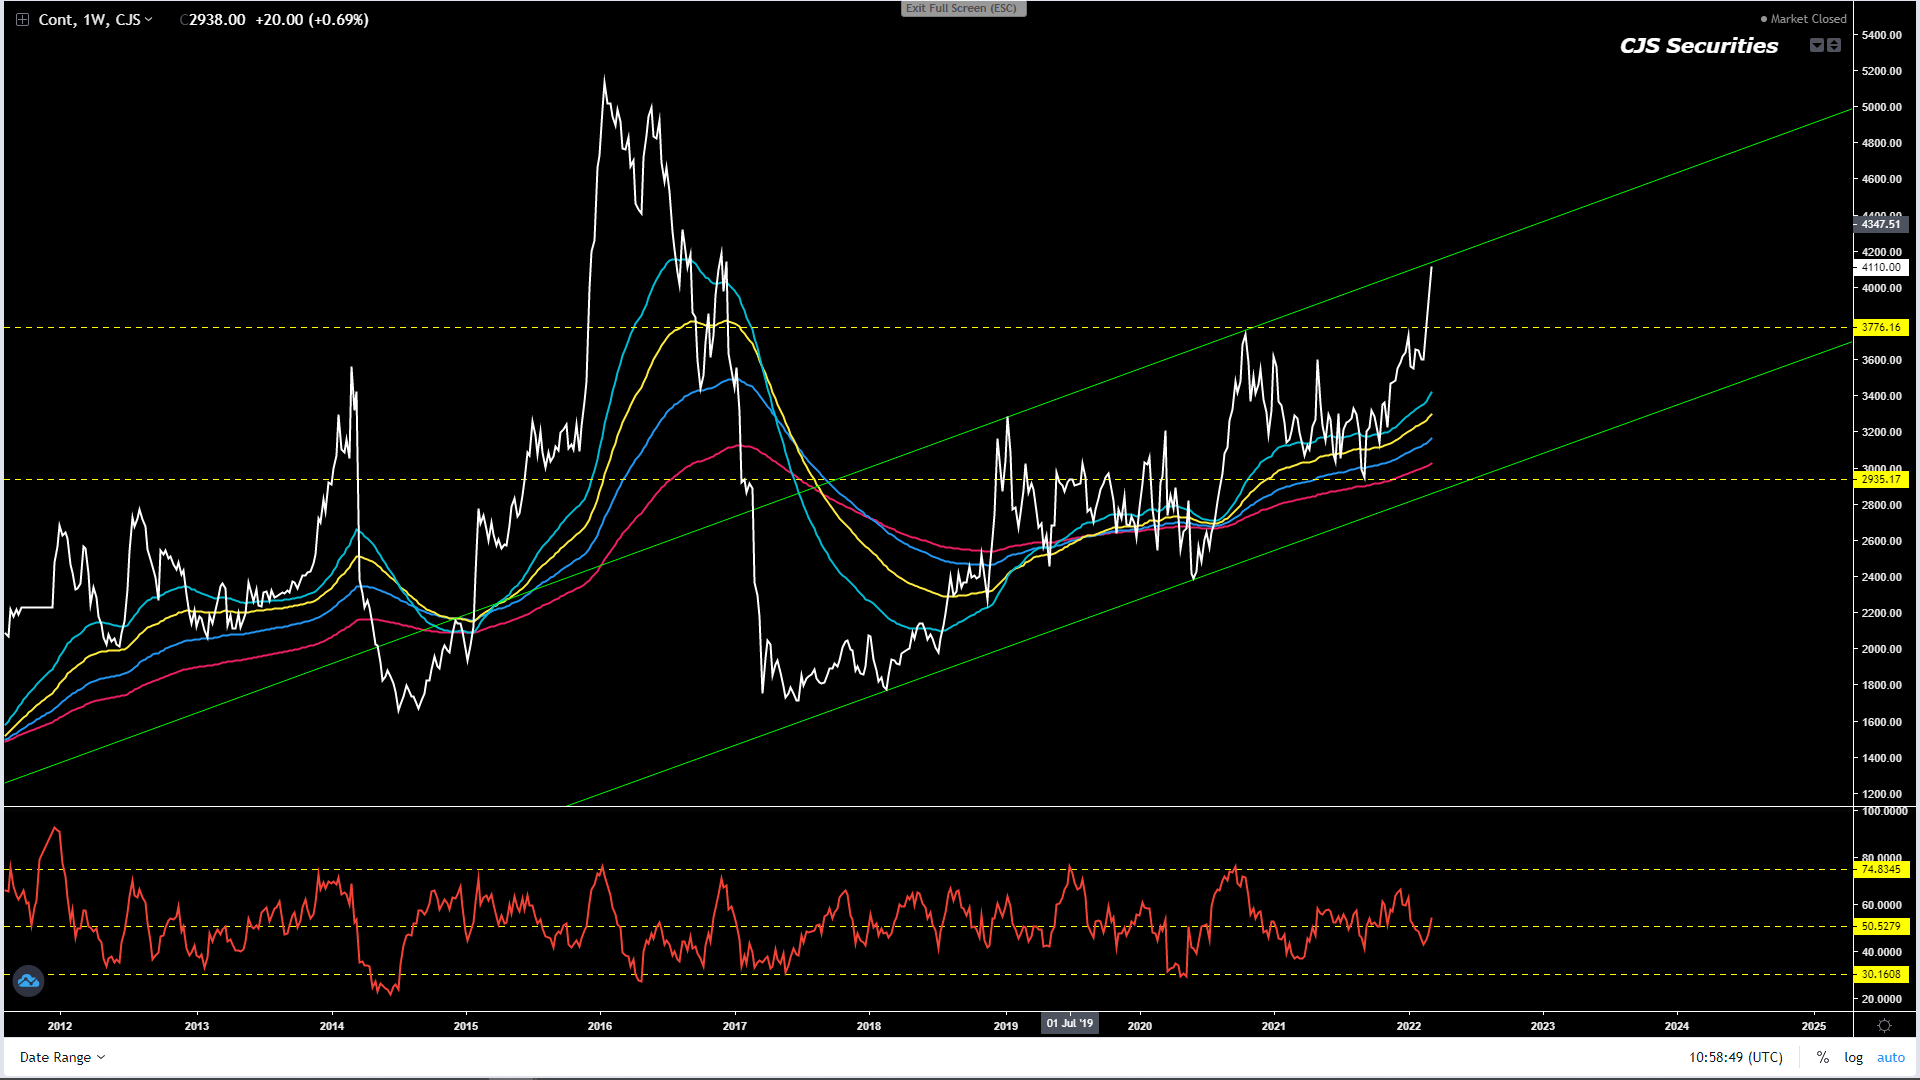
Weekly YM Continuous Close
Another chart I have had entirely wrong due to the Black Swan of WAR.
I have no strong views other than to urge producers to price as anything can happen.
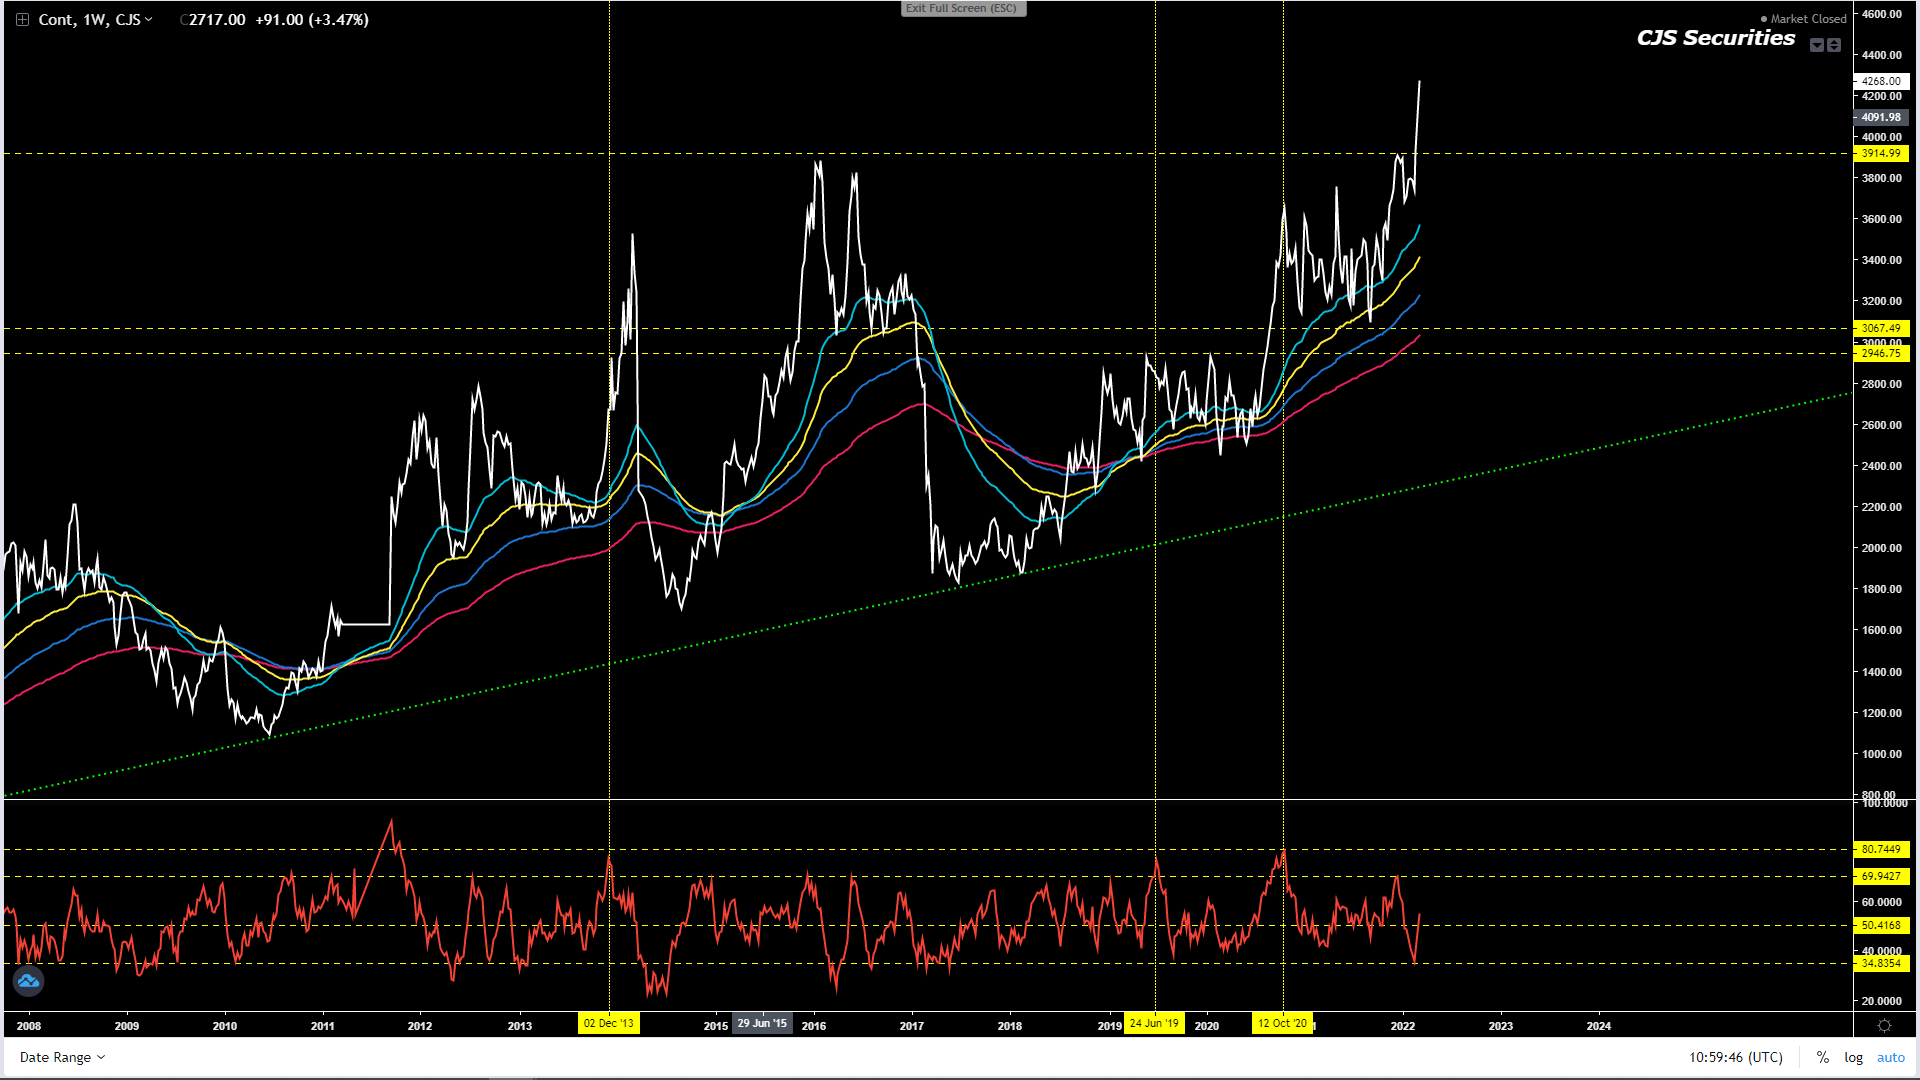
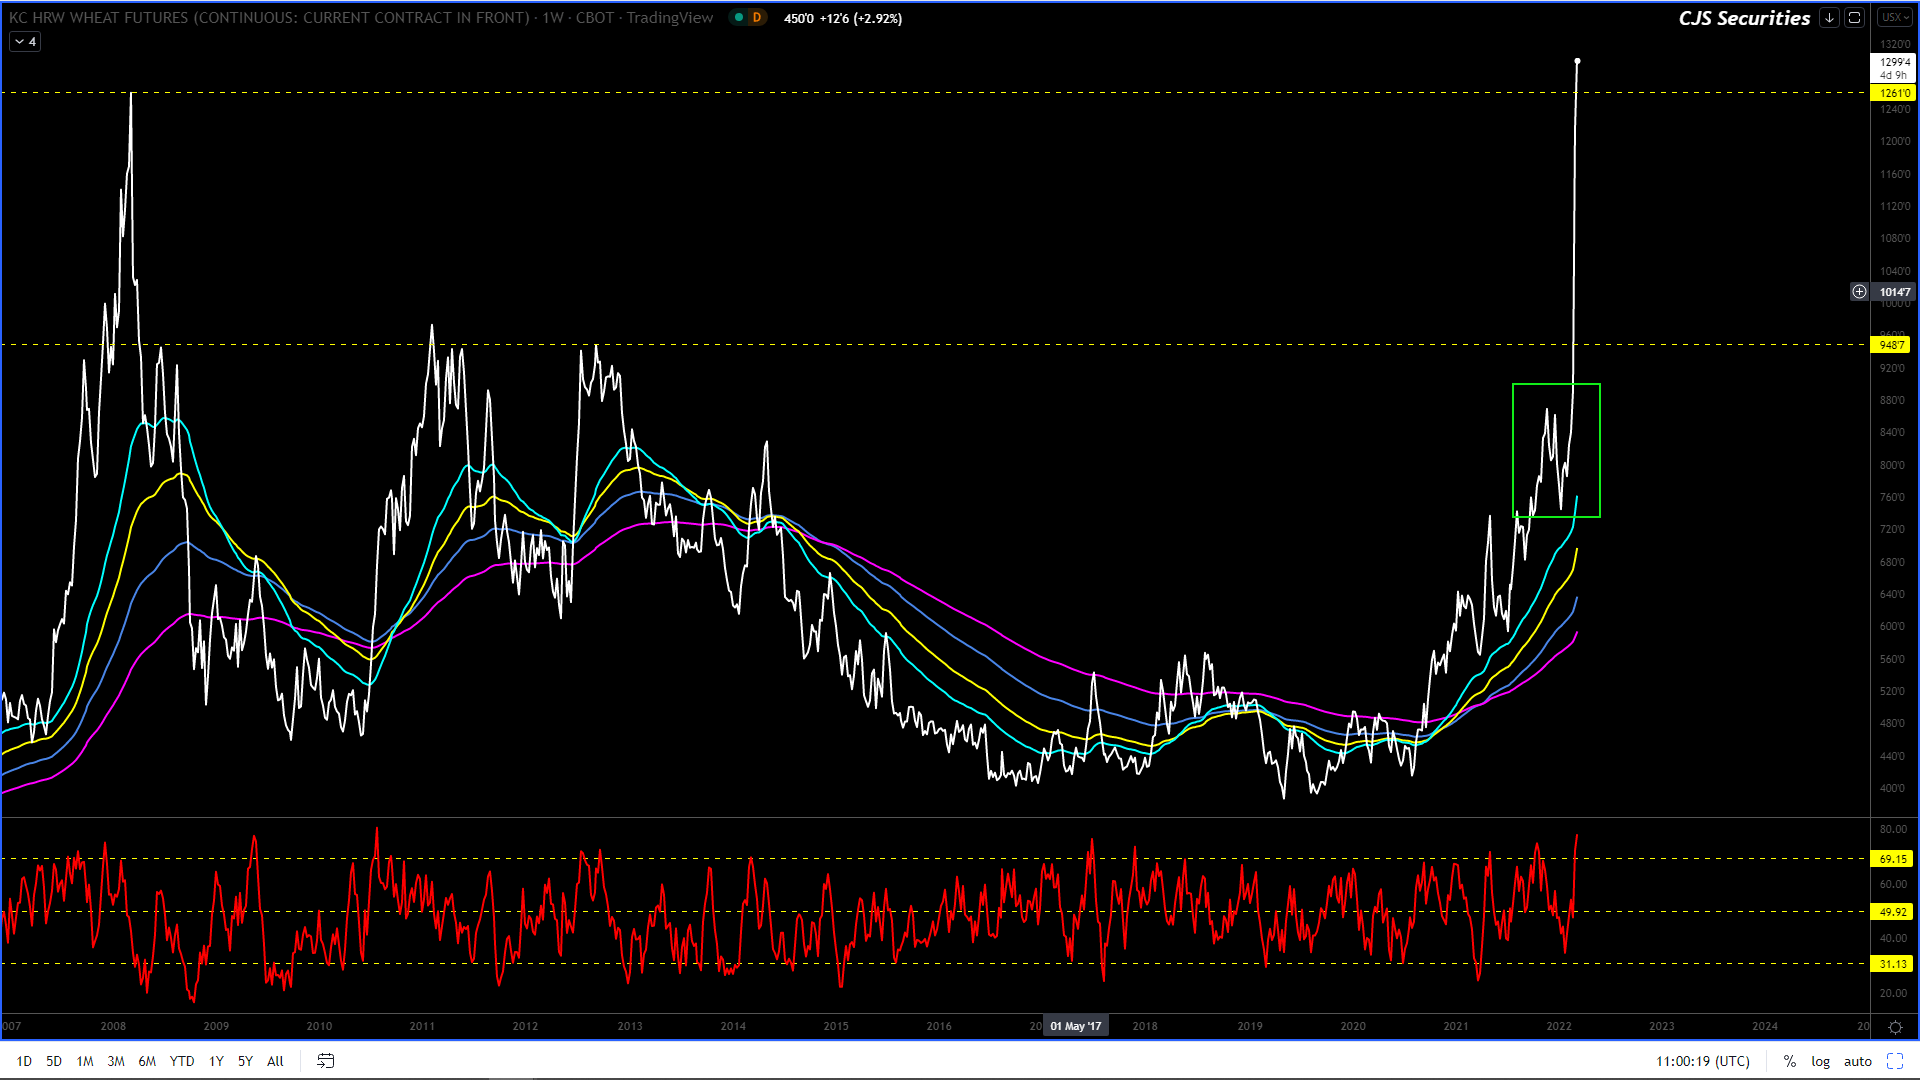
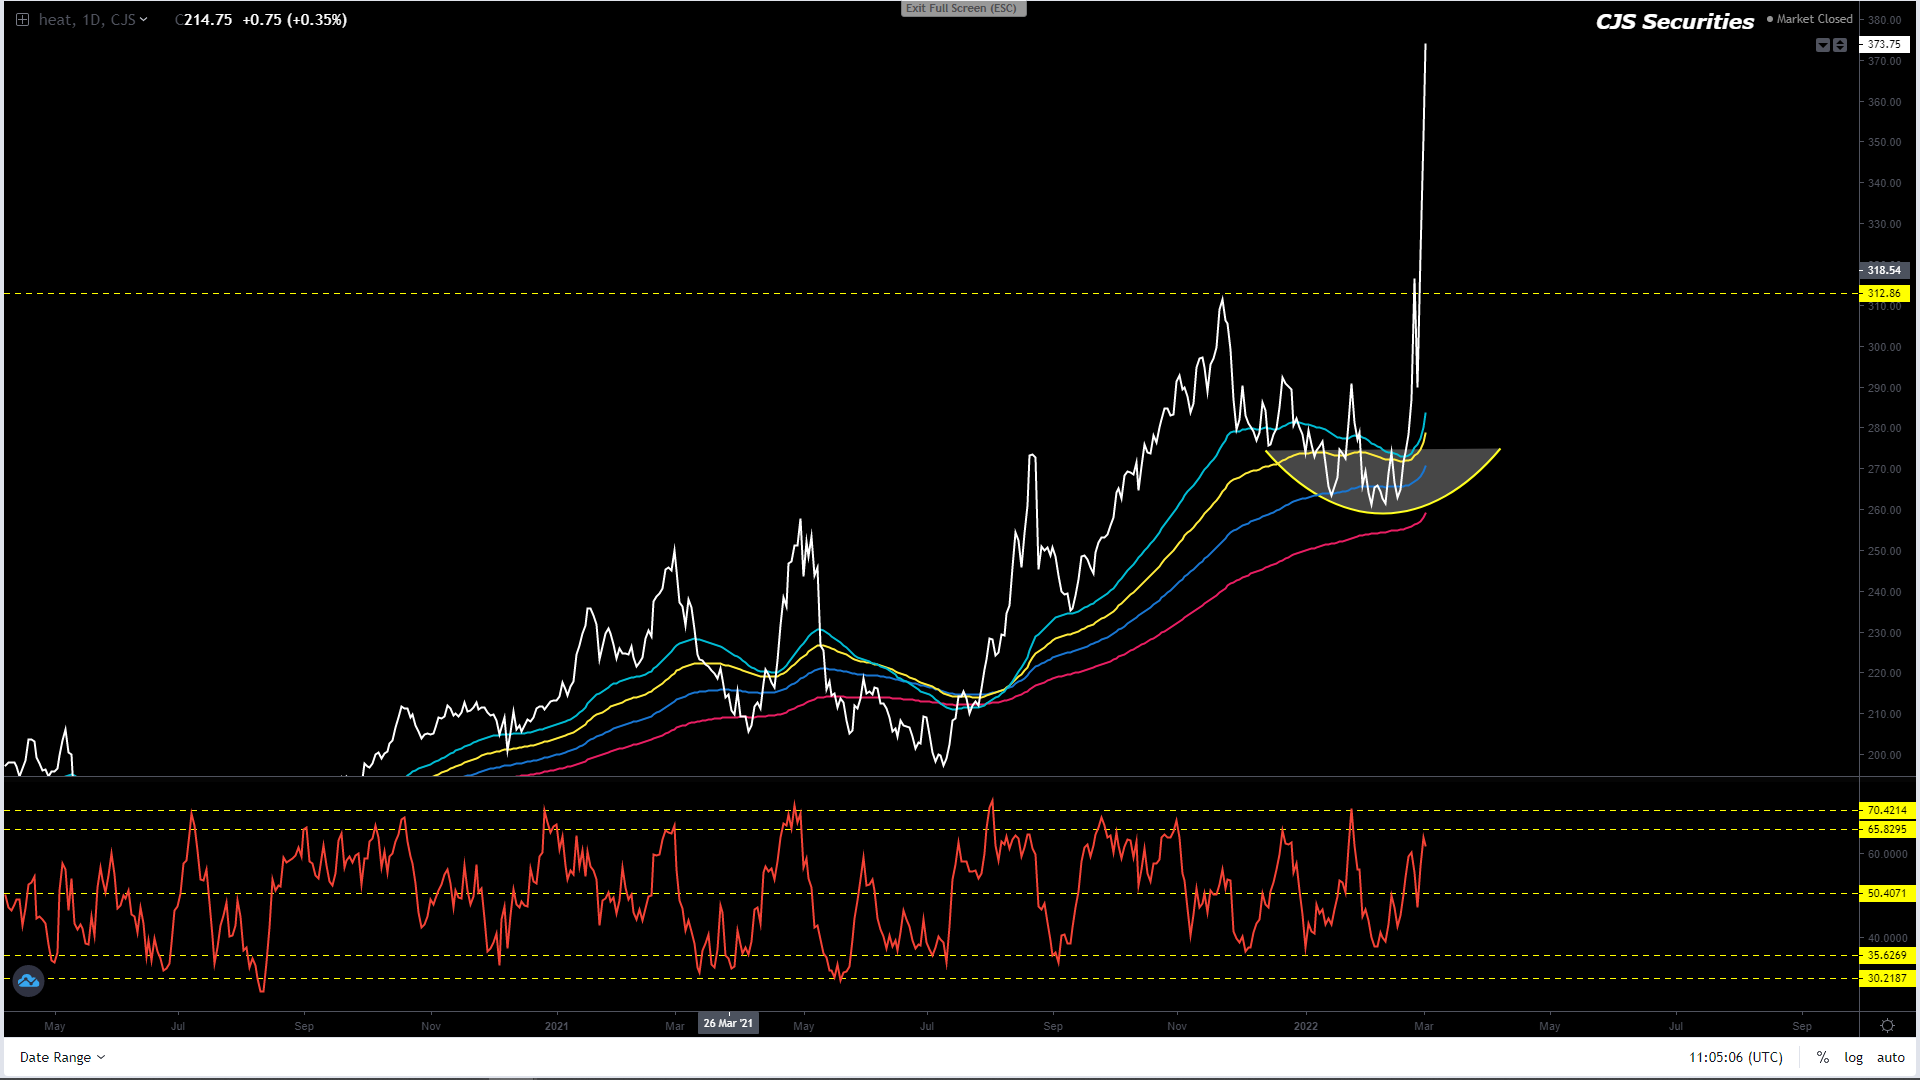
Weekly KC Wheat Continuous Close
Firstly well done to all that had long positions.
I have never felt so bad about being so right, and I will be taking a good few weeks off before retaking any view on these charts
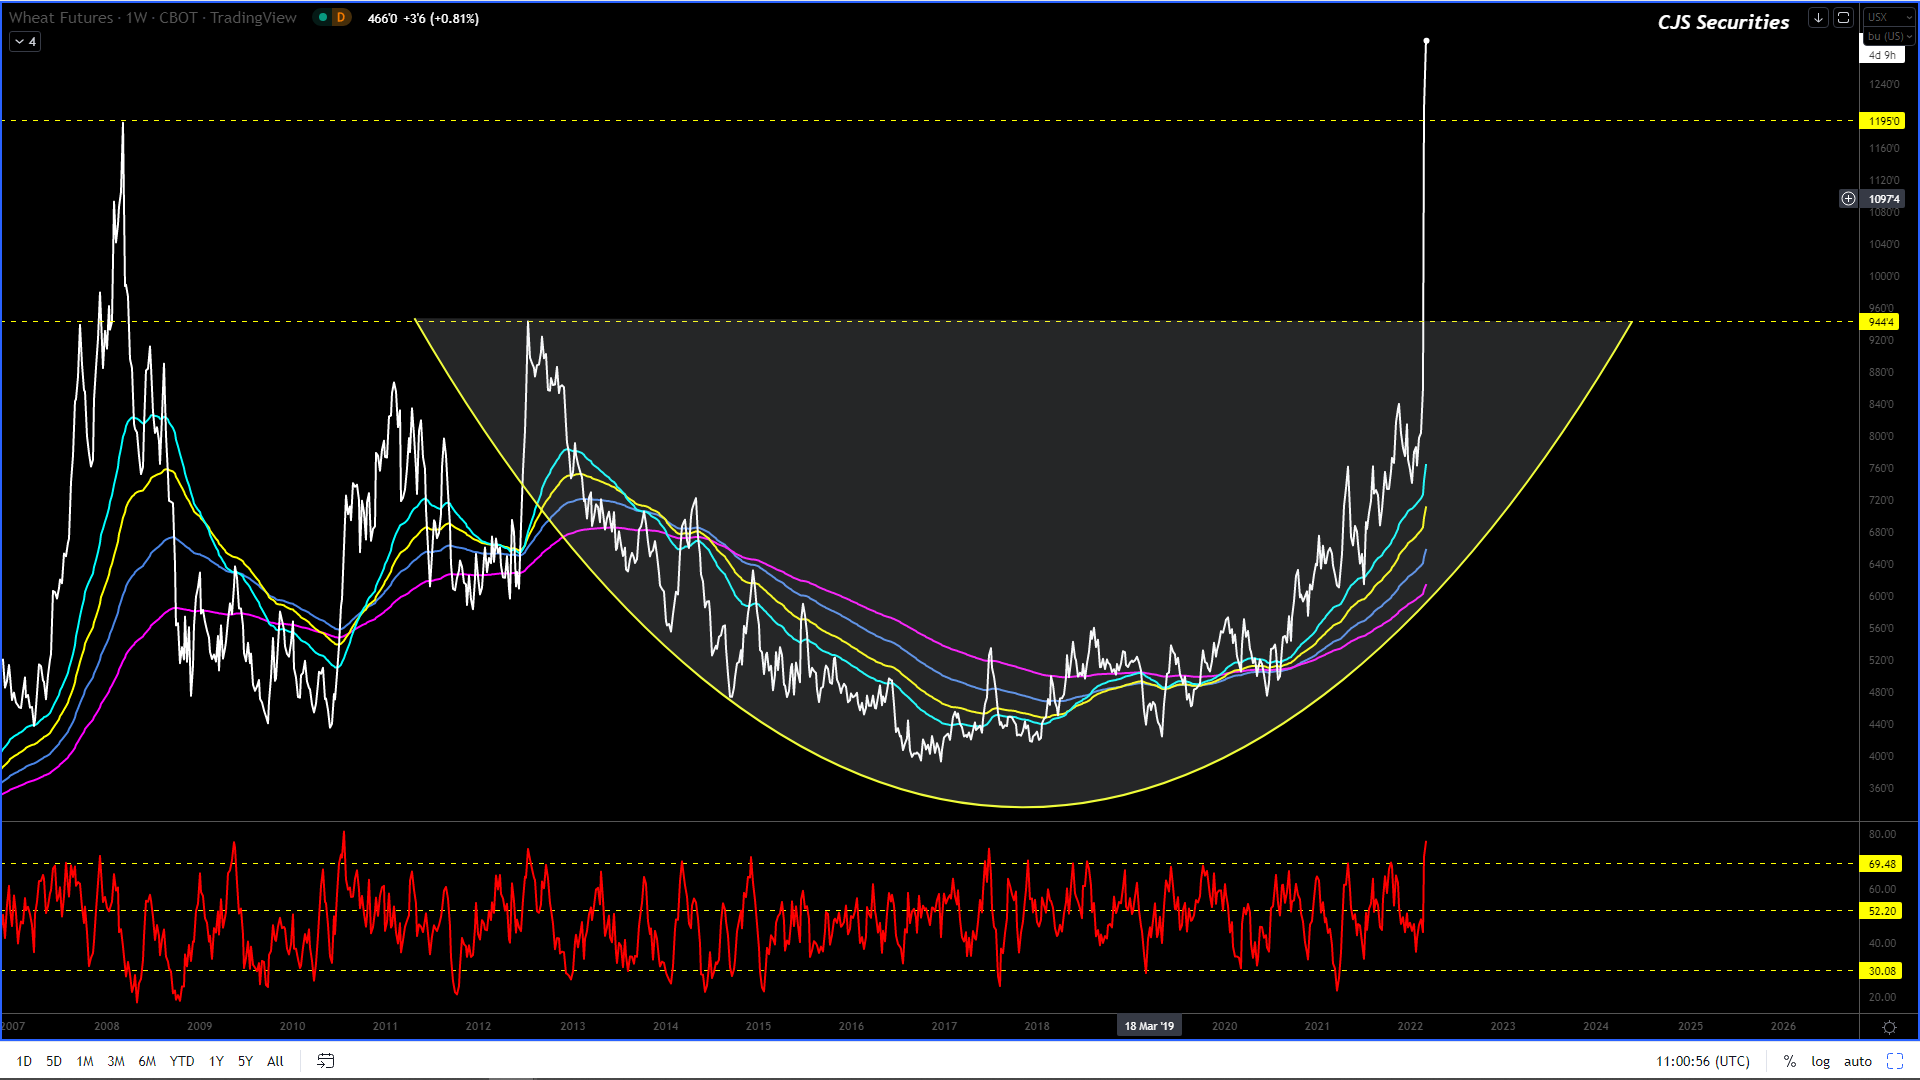
Weekly Chicago SRW Wheat Continuous
Firstly well done to all that had long positions.
I have never felt so bad about being so right, and I will be taking a good few weeks off before retaking any view on these charts.
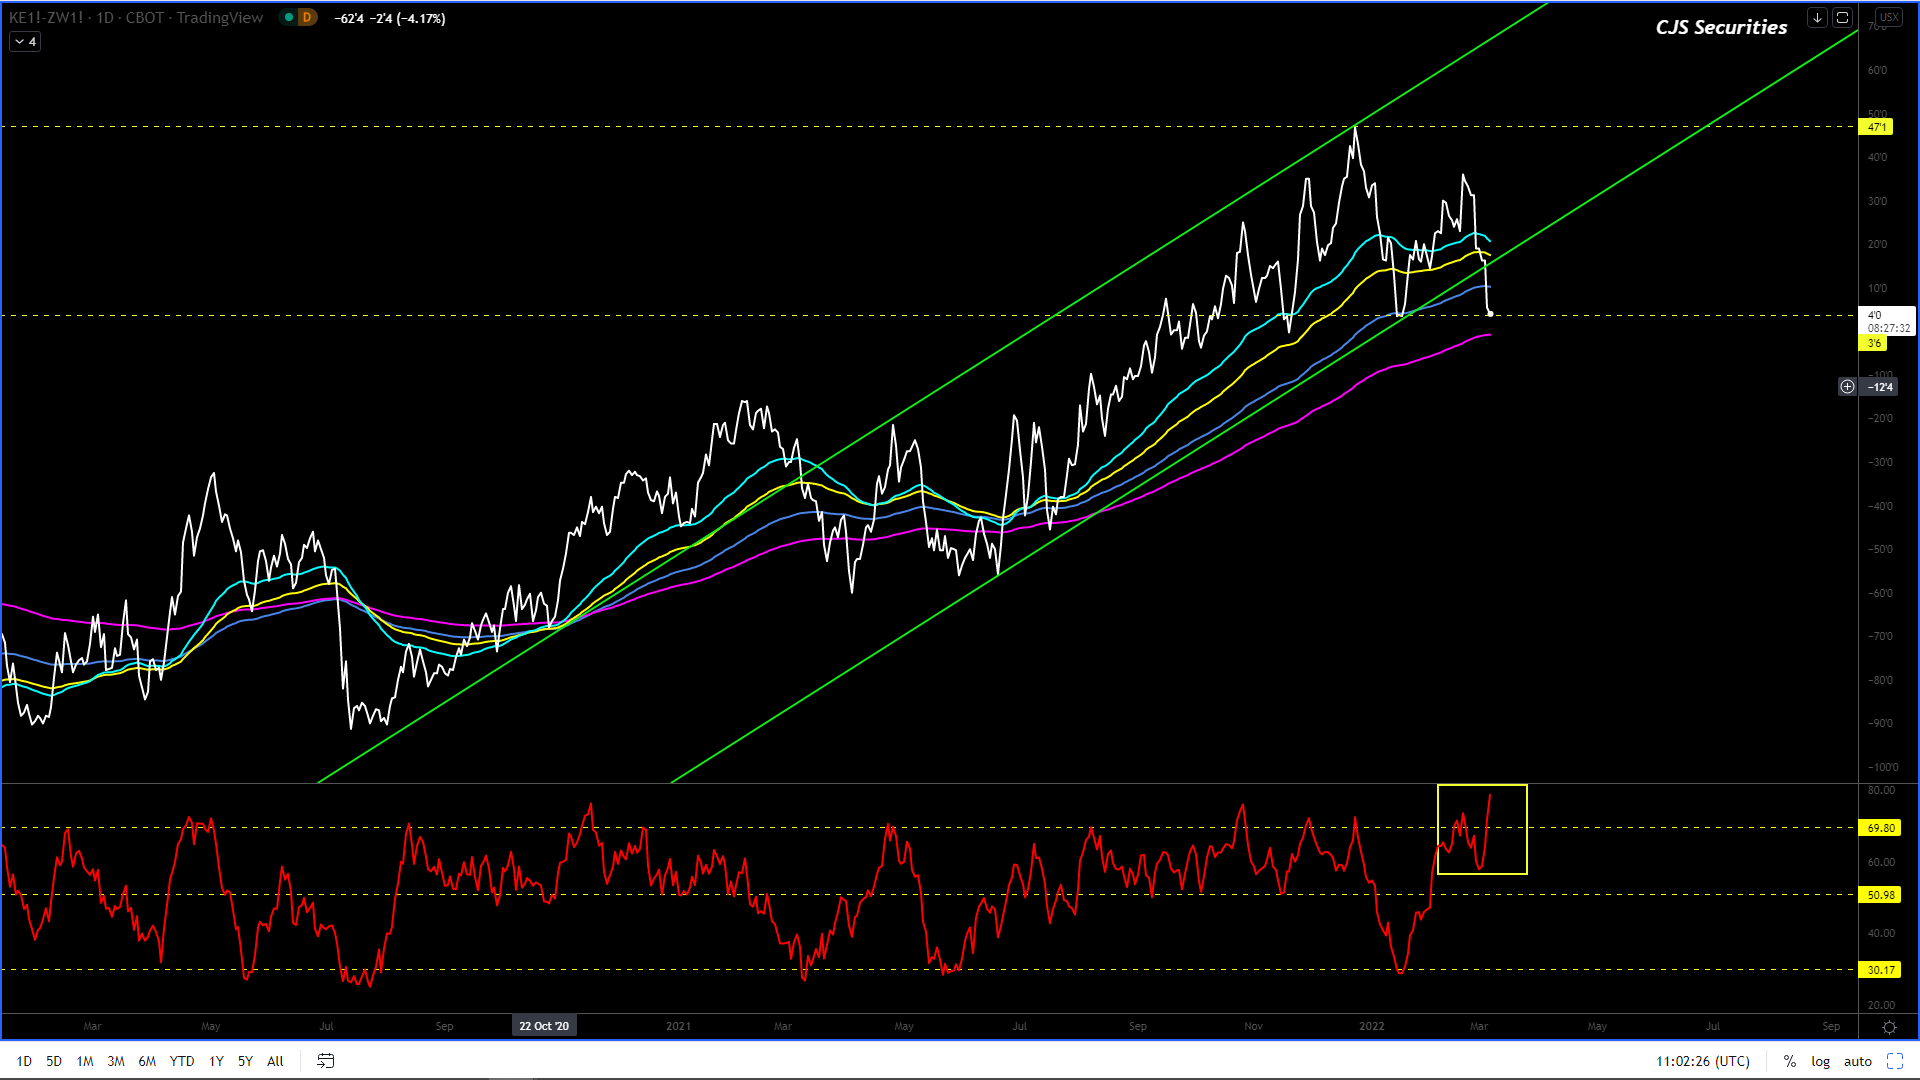
Daily Close KC Wheat v Chicago SRW Continuous Close
We will take profit on the below.
Selling the rally over $0.30 has me sweating and the only thing helping me keep it together right now is that market is grossly overbought. – Great trade
Weekly SAF Wheat Continuous Close
Firstly well done to all that had long positions.
I have never felt so bad about being so right, and I will be taking a good few weeks off before retaking any view on these charts.
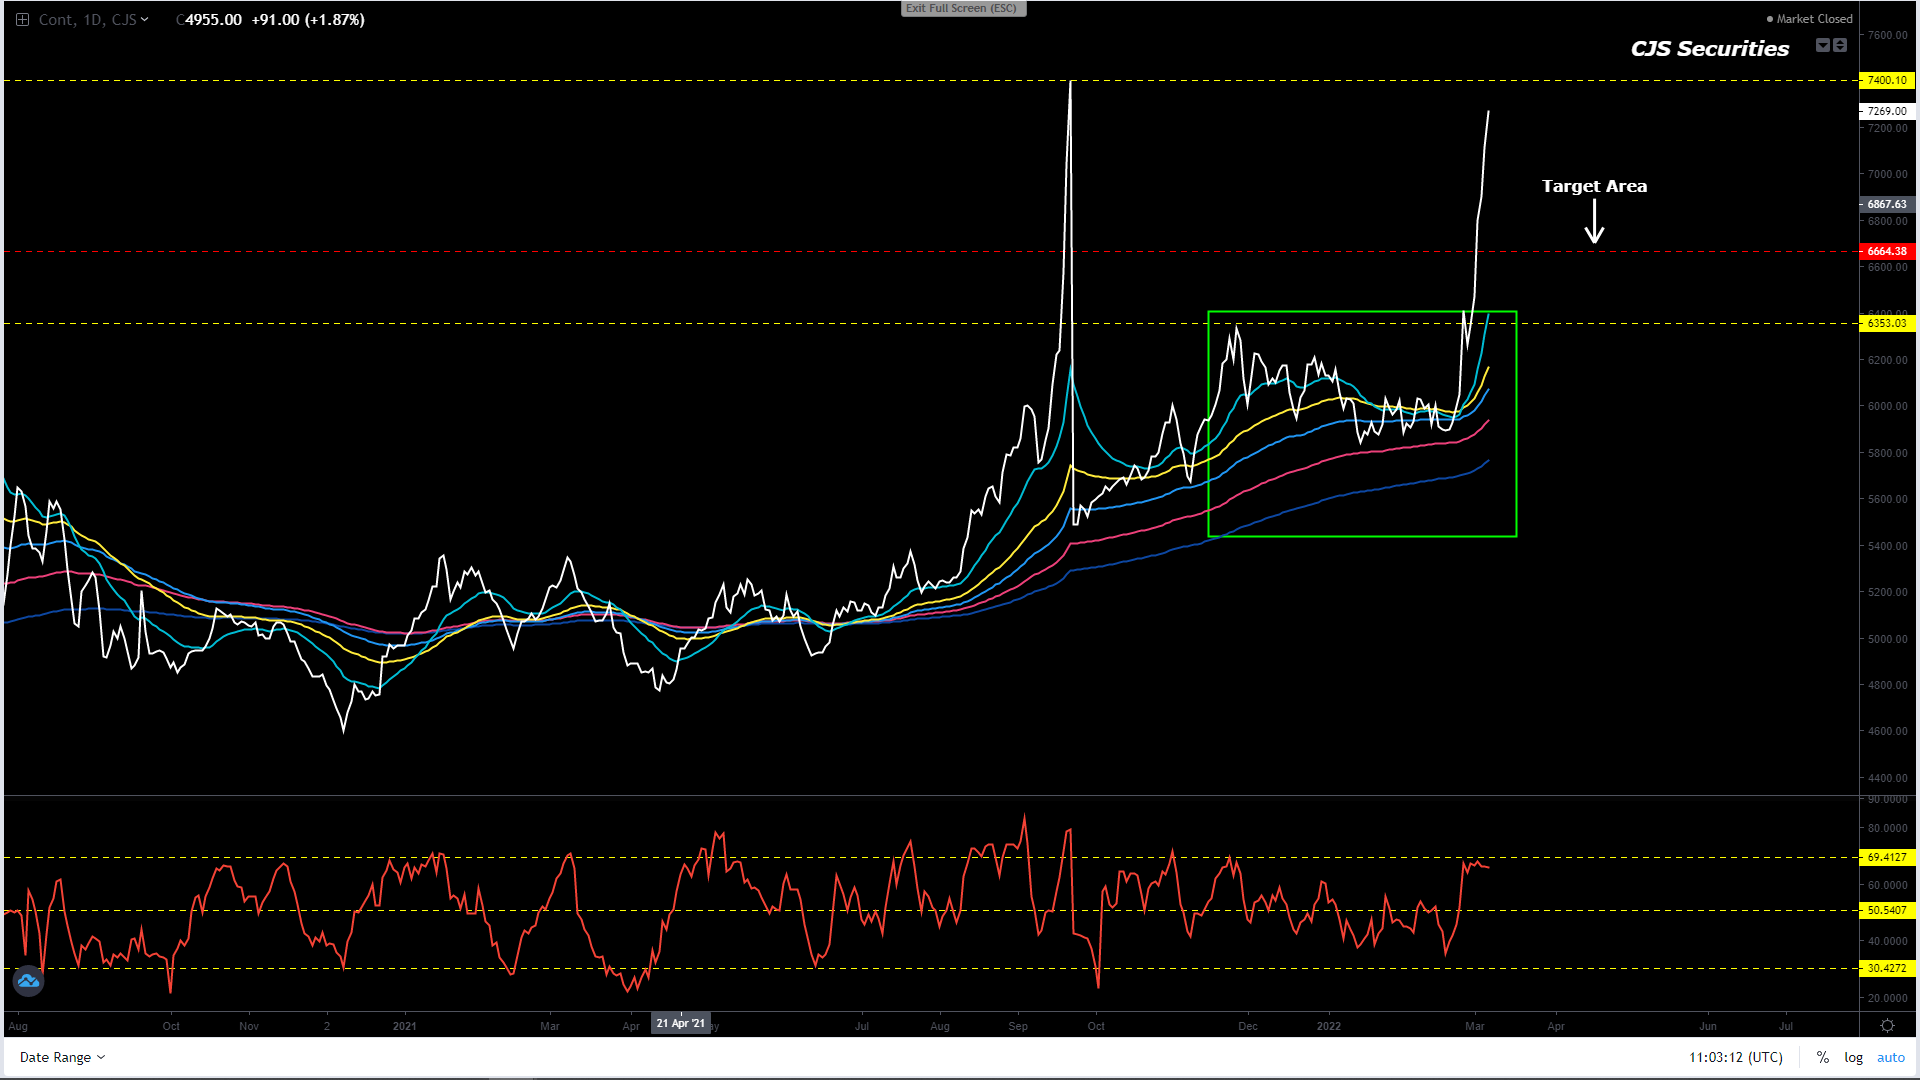
Daily Matif Wheat Continuous Close
We will sell out ASAP.
I am starting to like what I see, and I am now a buyer of this chart with a stop under €260.00.– lucky to have been long.
I have never felt so bad about being so right, and I will be taking a good few weeks off before retaking any view on these charts.
The last time this report was sent, WAR had not yet broken out.
I want to spare a thought for all the people that have been affected and displaced at this time.
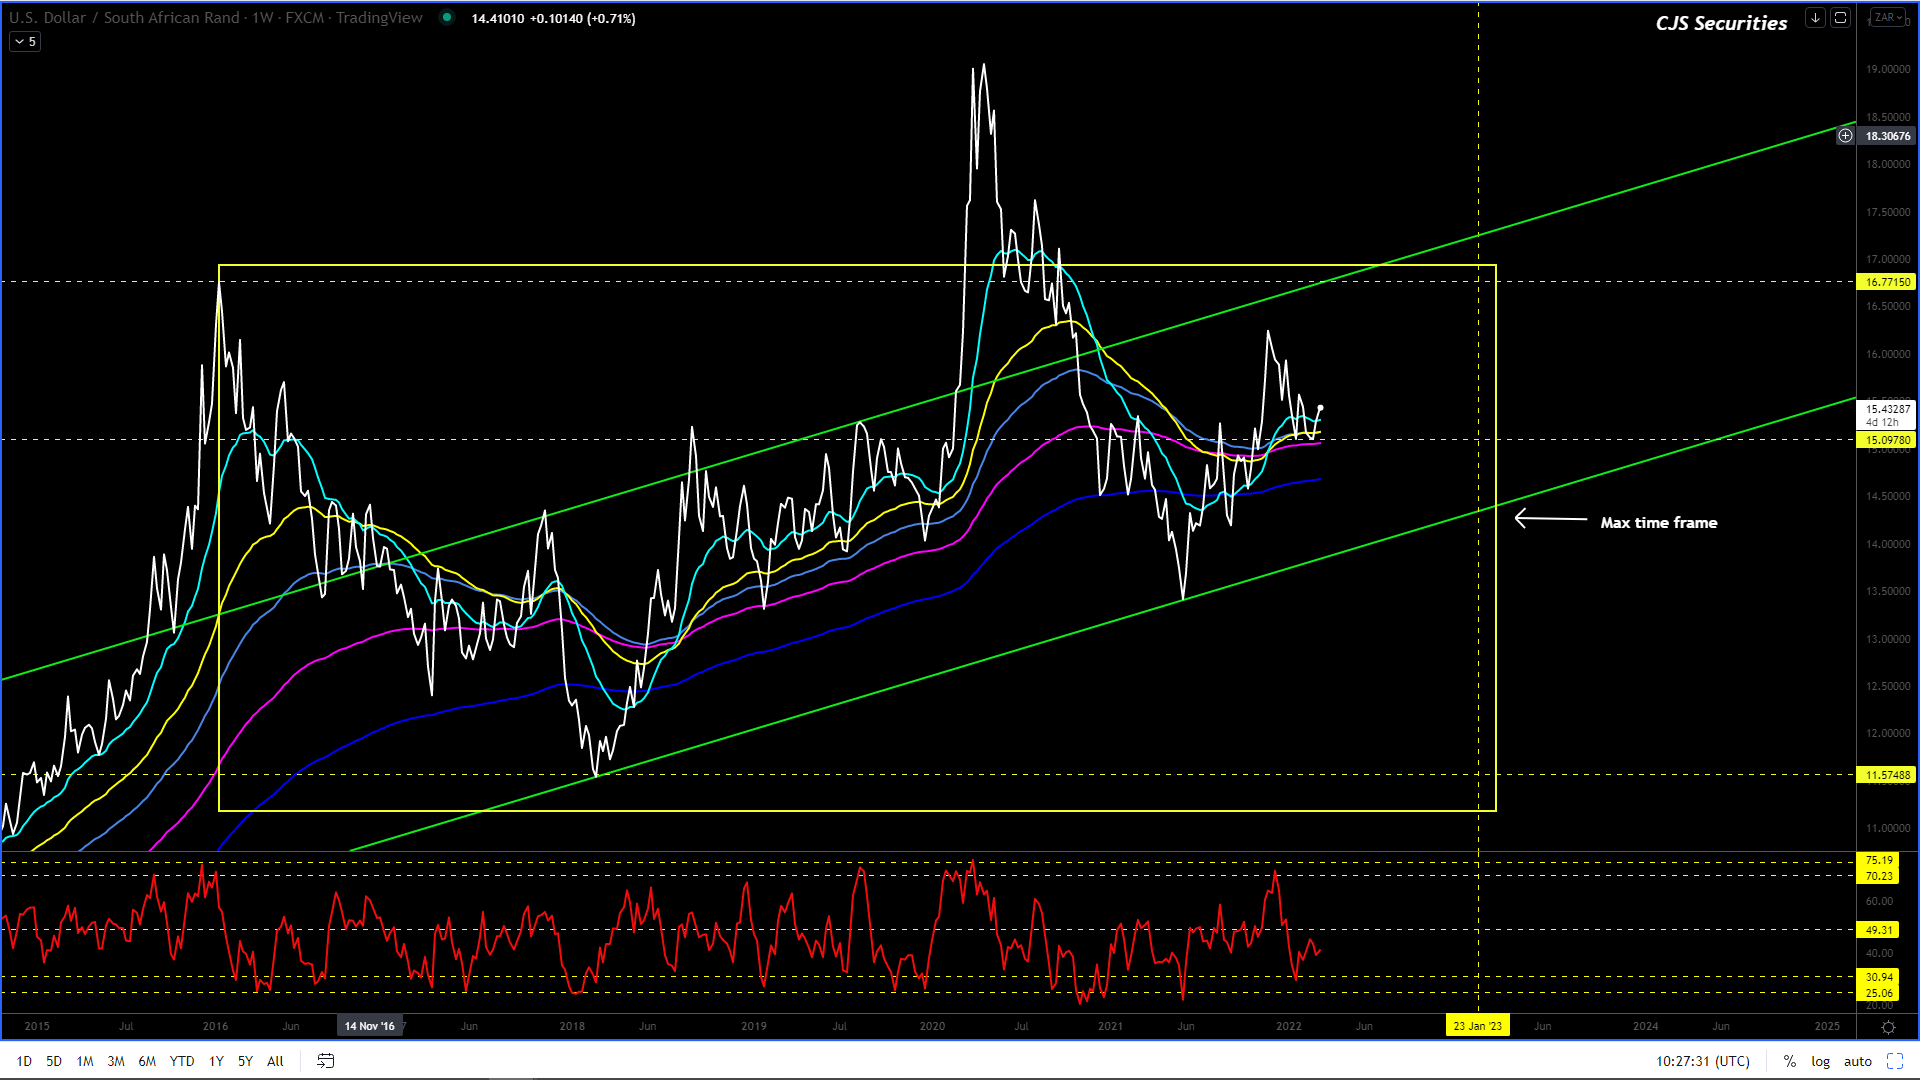
I still see the below taking place over time.
What I see is R11.50 over the next 17 months.
I am convinced that the ZAR is in a multi-year corrective phase vs. the USD and that from today on, all upward spikes on this chart are well worth a short!
This chart could easily have a leg higher and trade toward the R16.77 level in the coming weeks. – I would use this as a USD selling opportunity.
Until then, the range is likely to be R14.88 – R15.50 and I would seriously consider owning the bottom of the range! – hopefully some of you bought the sub R15’s, even as just a ST hedge against war.
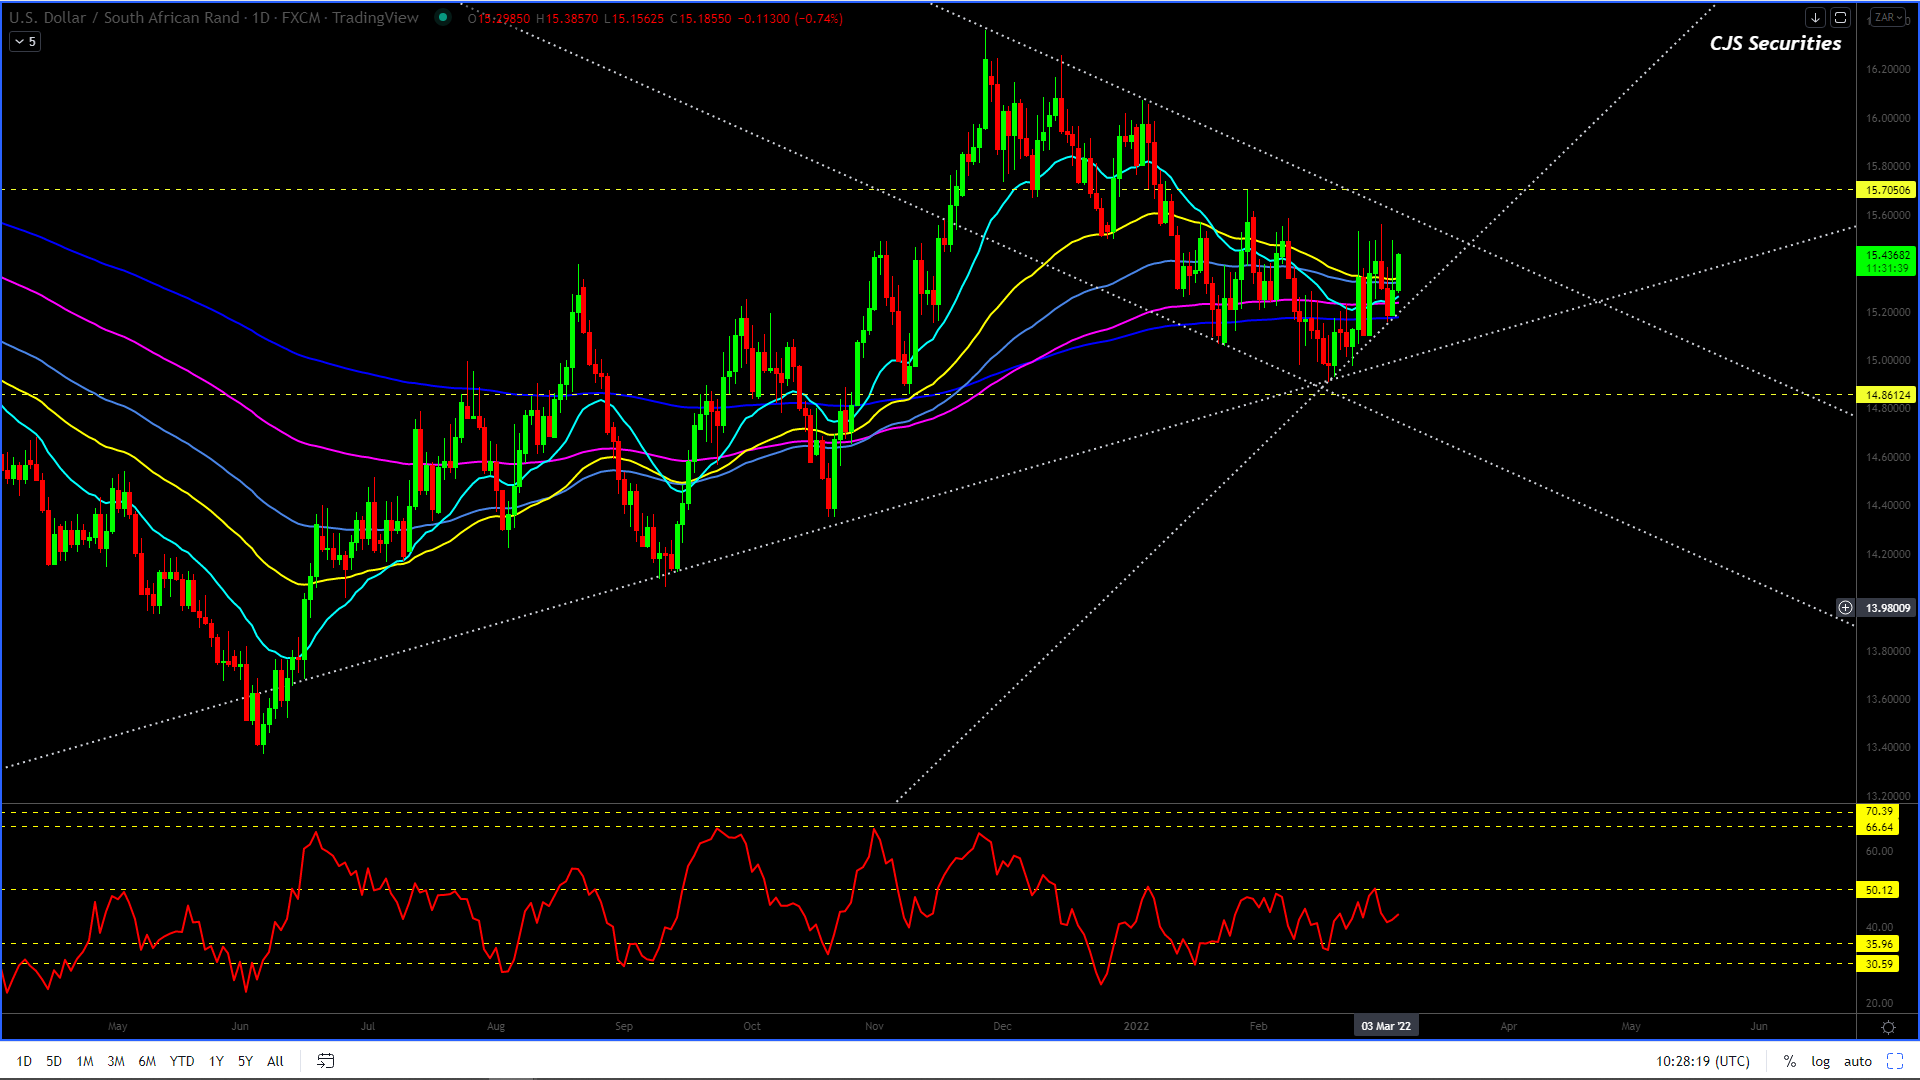
Dollar/Rand Daily Candle
Overall, the chart formation is corrective, needs a leg higher, and fits my weekly view.
I want the last leg higher into the R16’s to complete the chart.
I cannot stress enough how important patience is and keeping your mind clear as emotions are sure to get the better of many this year.
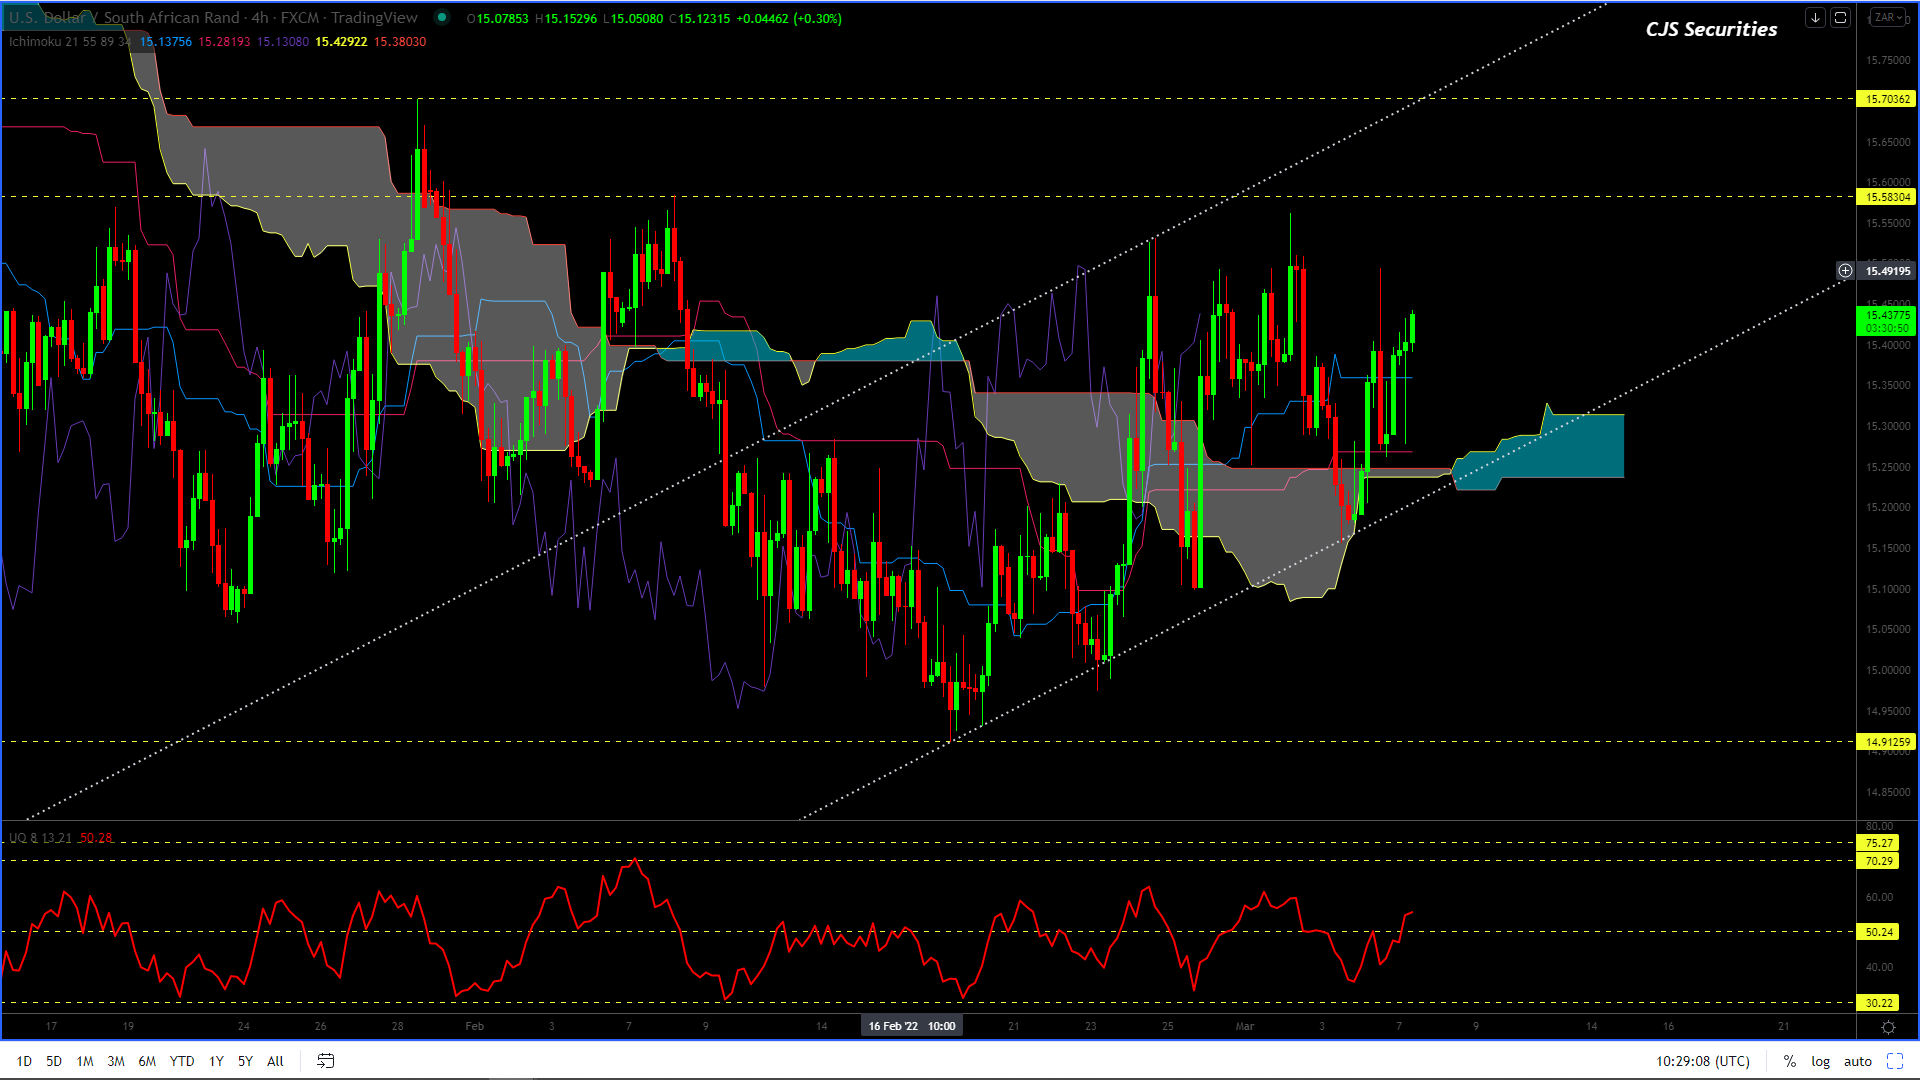
Dollar/Rand 240 min Candle
#No Change in commentary
Currently, there is no decent trade that I can see on an RR basis, as I always require a 3/1 ratio.
However, this chart’s current formation leads me to believe that we will see a trade toward R15.70 and potentially higher.
So, I have decided to get long and stay long until either R15.70 or until I am stopped out through R15.00!– long at R15.22
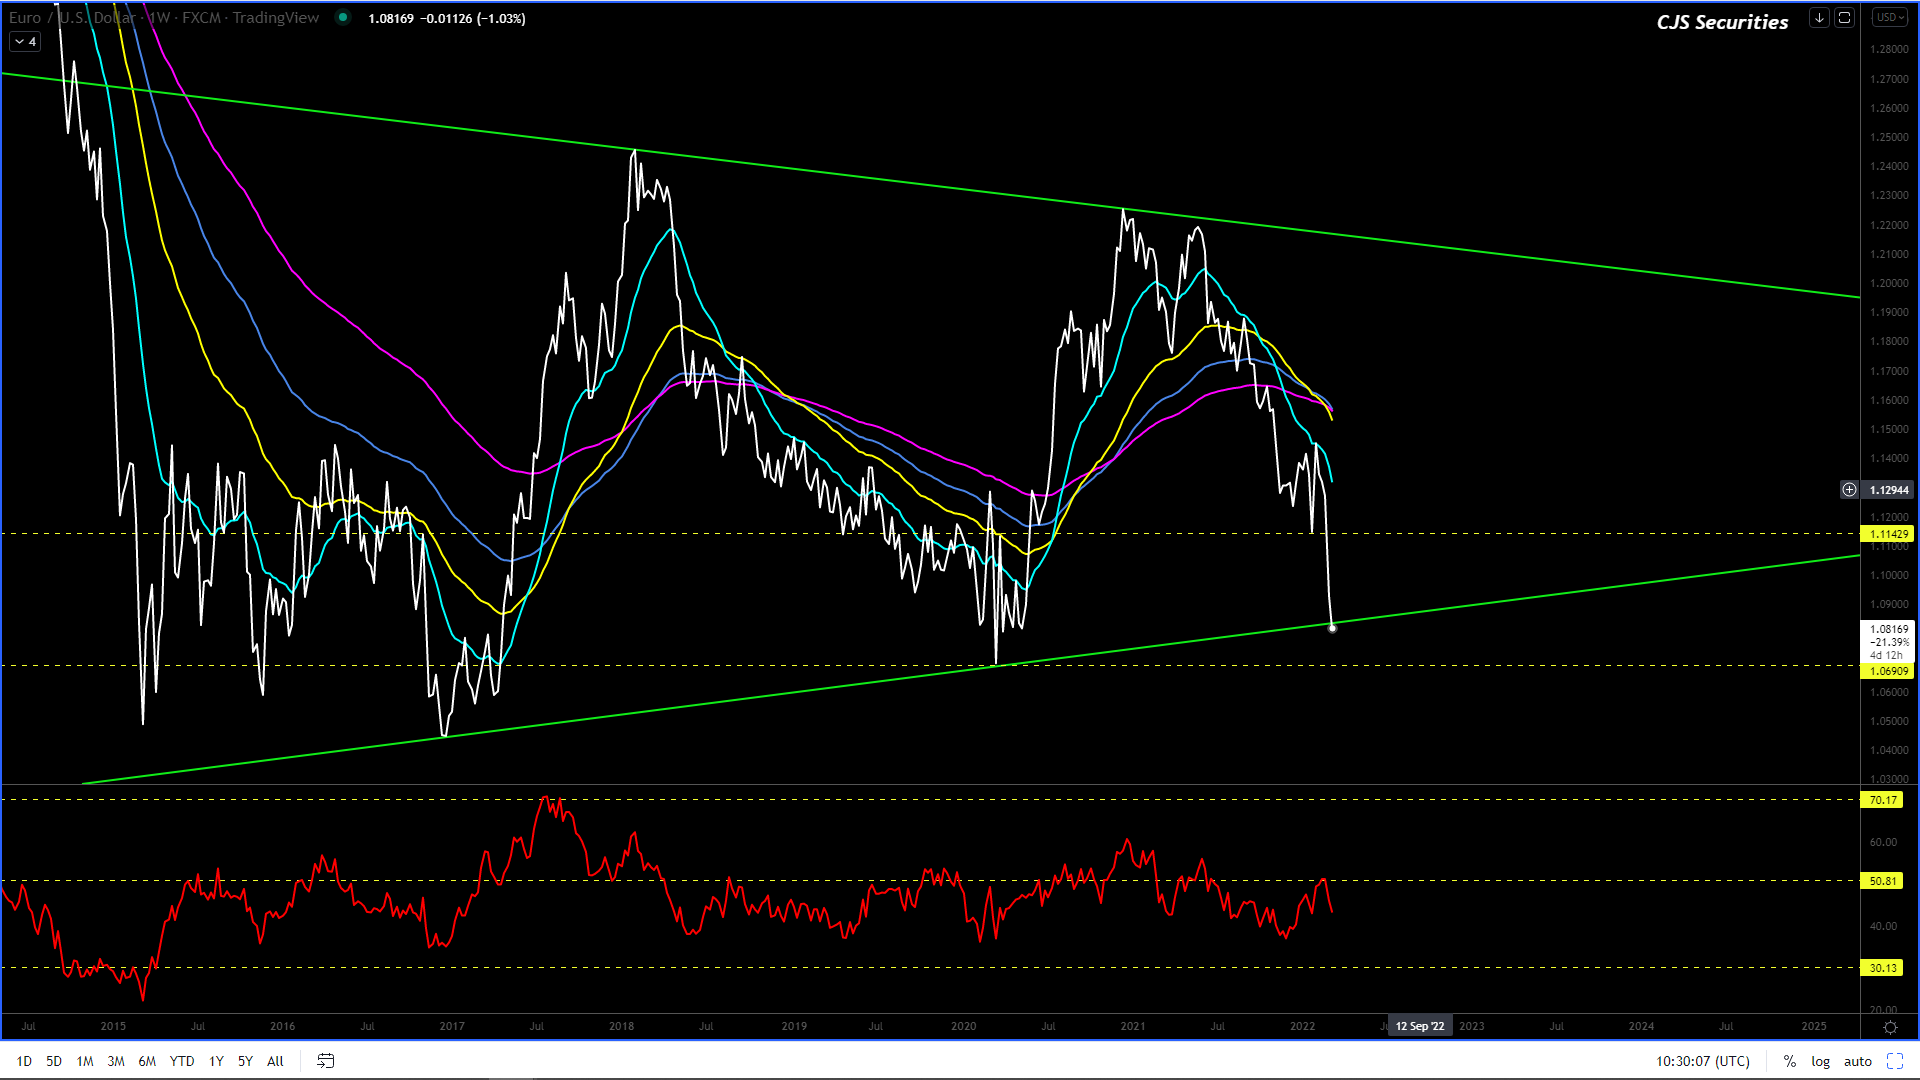
Euro/USD Weekly Close
All bets are off.
The Black Swan that is WAR has taken over, and I will need this chart to play out over the next few weeks before remotely thinking about taking a view.
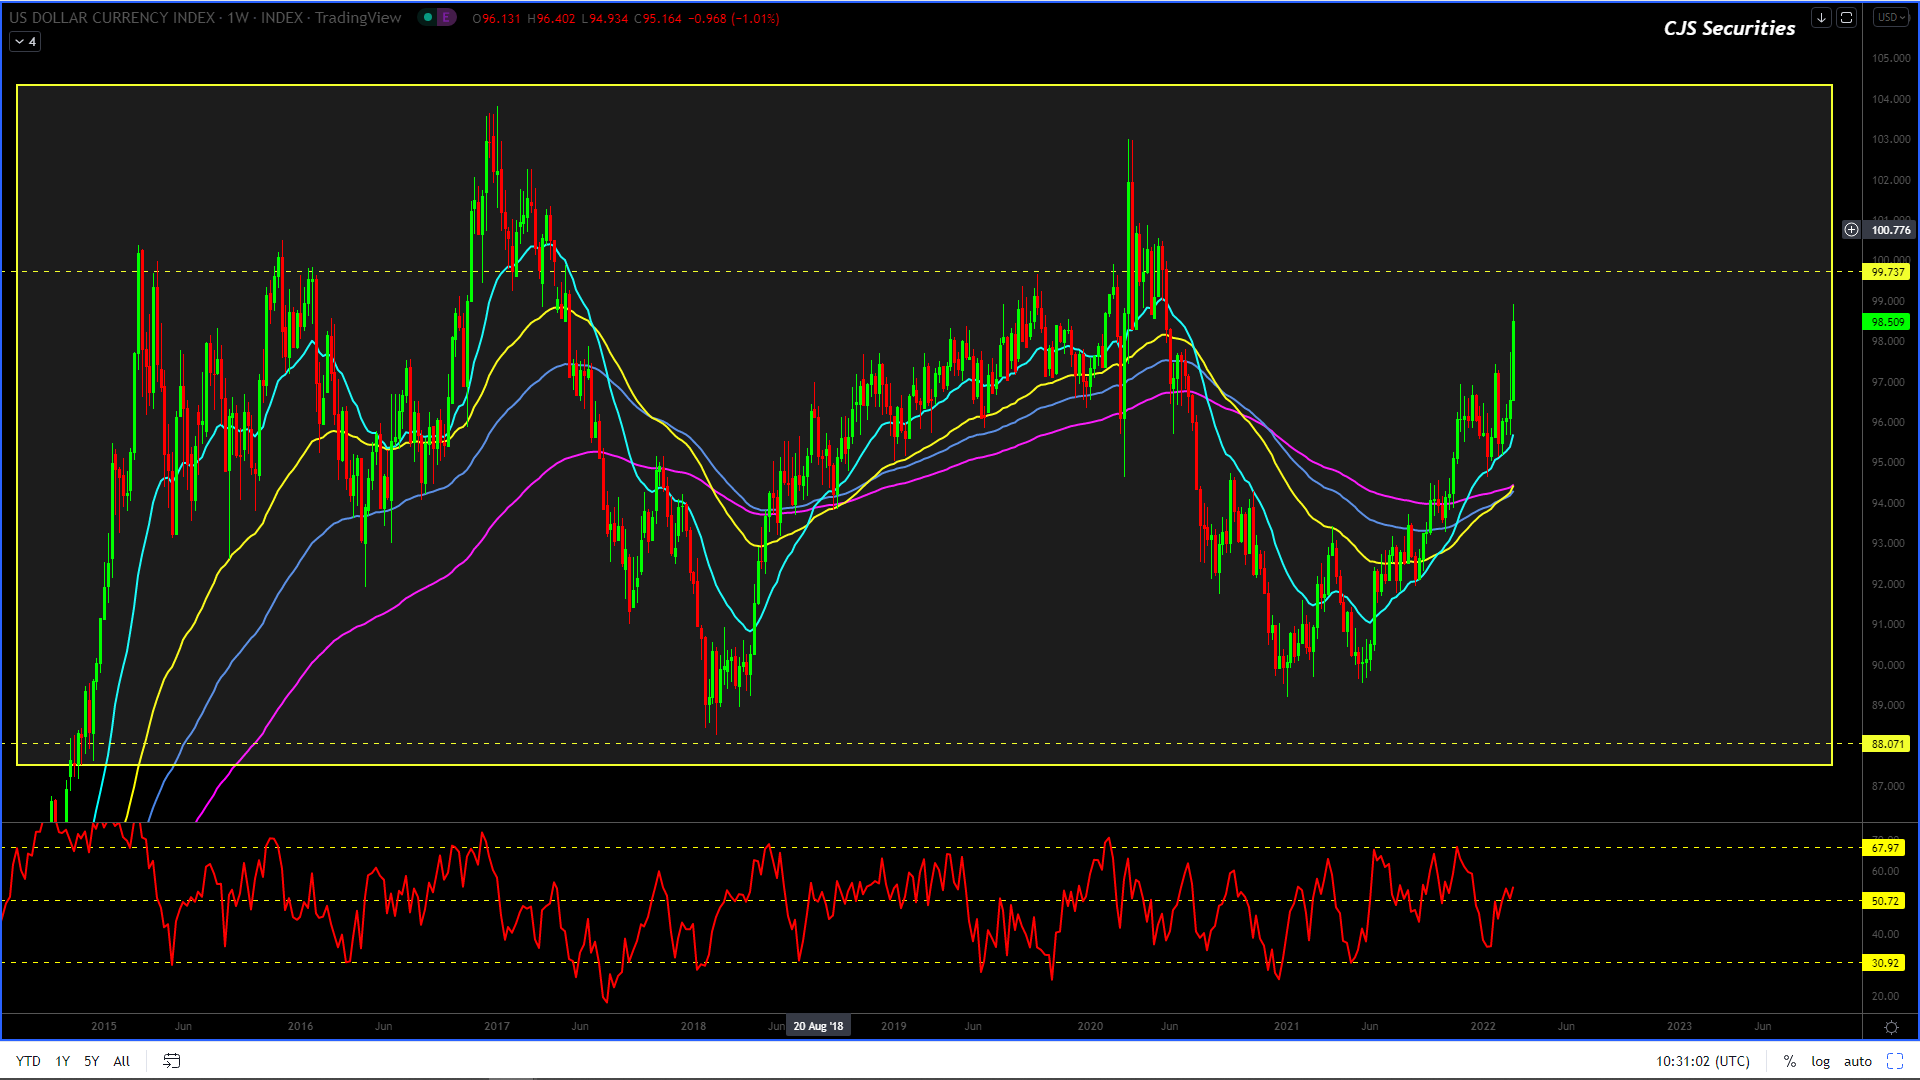
US Dollar Index Weekly Candle
So much for the chart’s upside momentum failing.
With the Black Swan of WAR taking over, I am very unsure of where to from here, and hence I would advise staying out.
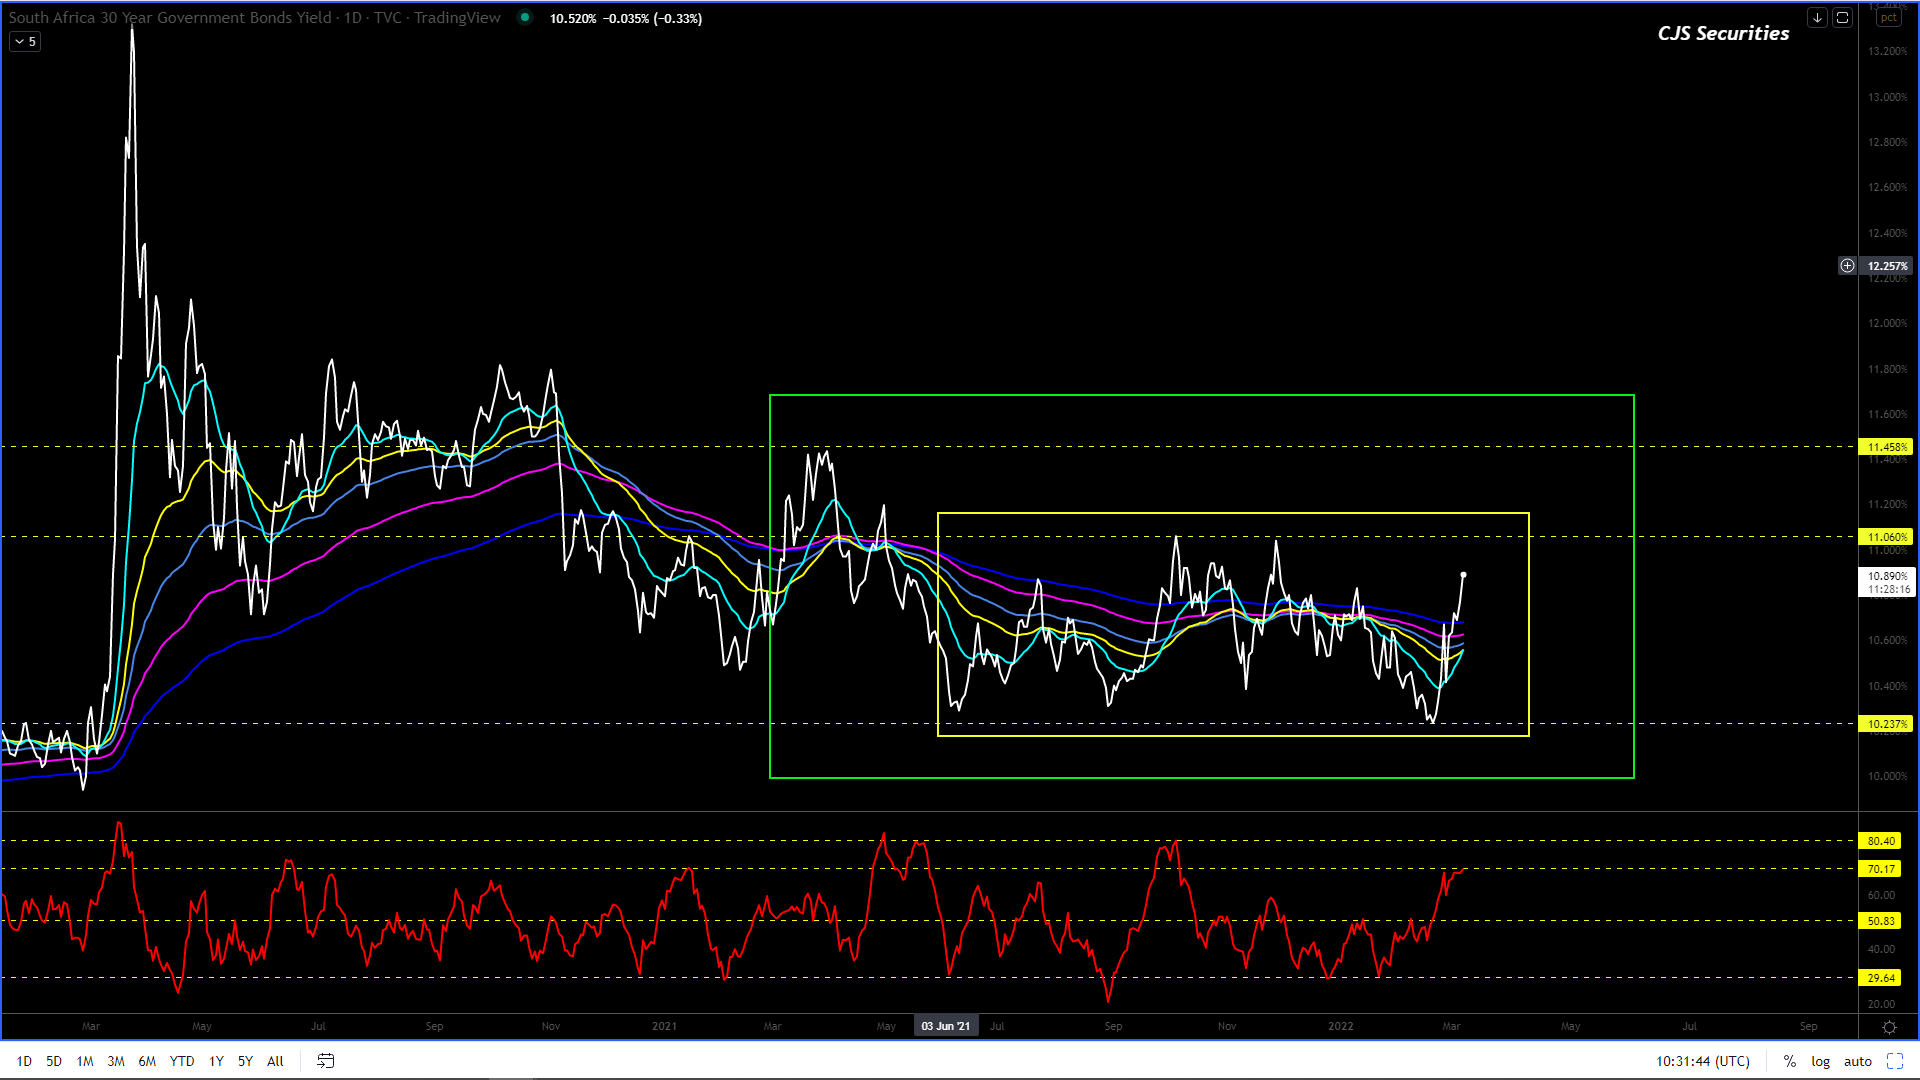
SA Government Bond 30 Year Yield Daily Close
#No Change in commentary
The chart has made a solid base around the 10.30% level.
The chart remains range-bound but we feel the move higher toward the top of the range at 11.40% is on the cards before looking to start a severe leg lower to sub 9.00%.