The chart’s failure to capitulate has me starting to wonder, along with the formation, if it’s not experiencing a “running correction”, should this be the case we will be in a for a good few weeks of high volatility, followed by a serious rally that should print $20.00 and higher.
I feel its difficult being long this chart up here and hence why I am happy to be square, but going short is not an option!
240 Min CBOT July 22 Soybean Candle Chart
As with the weekly chart I am wondering based on the detailed 240 min formation if it’s not experiencing a “running correction”, should this be the case we will be in a for a good few weeks of high volatility, followed by a serious rally that should print $20.00 and higher.
I feel it’s difficult being long this chart up here and hence why I am happy to be square, but going short is not an option!
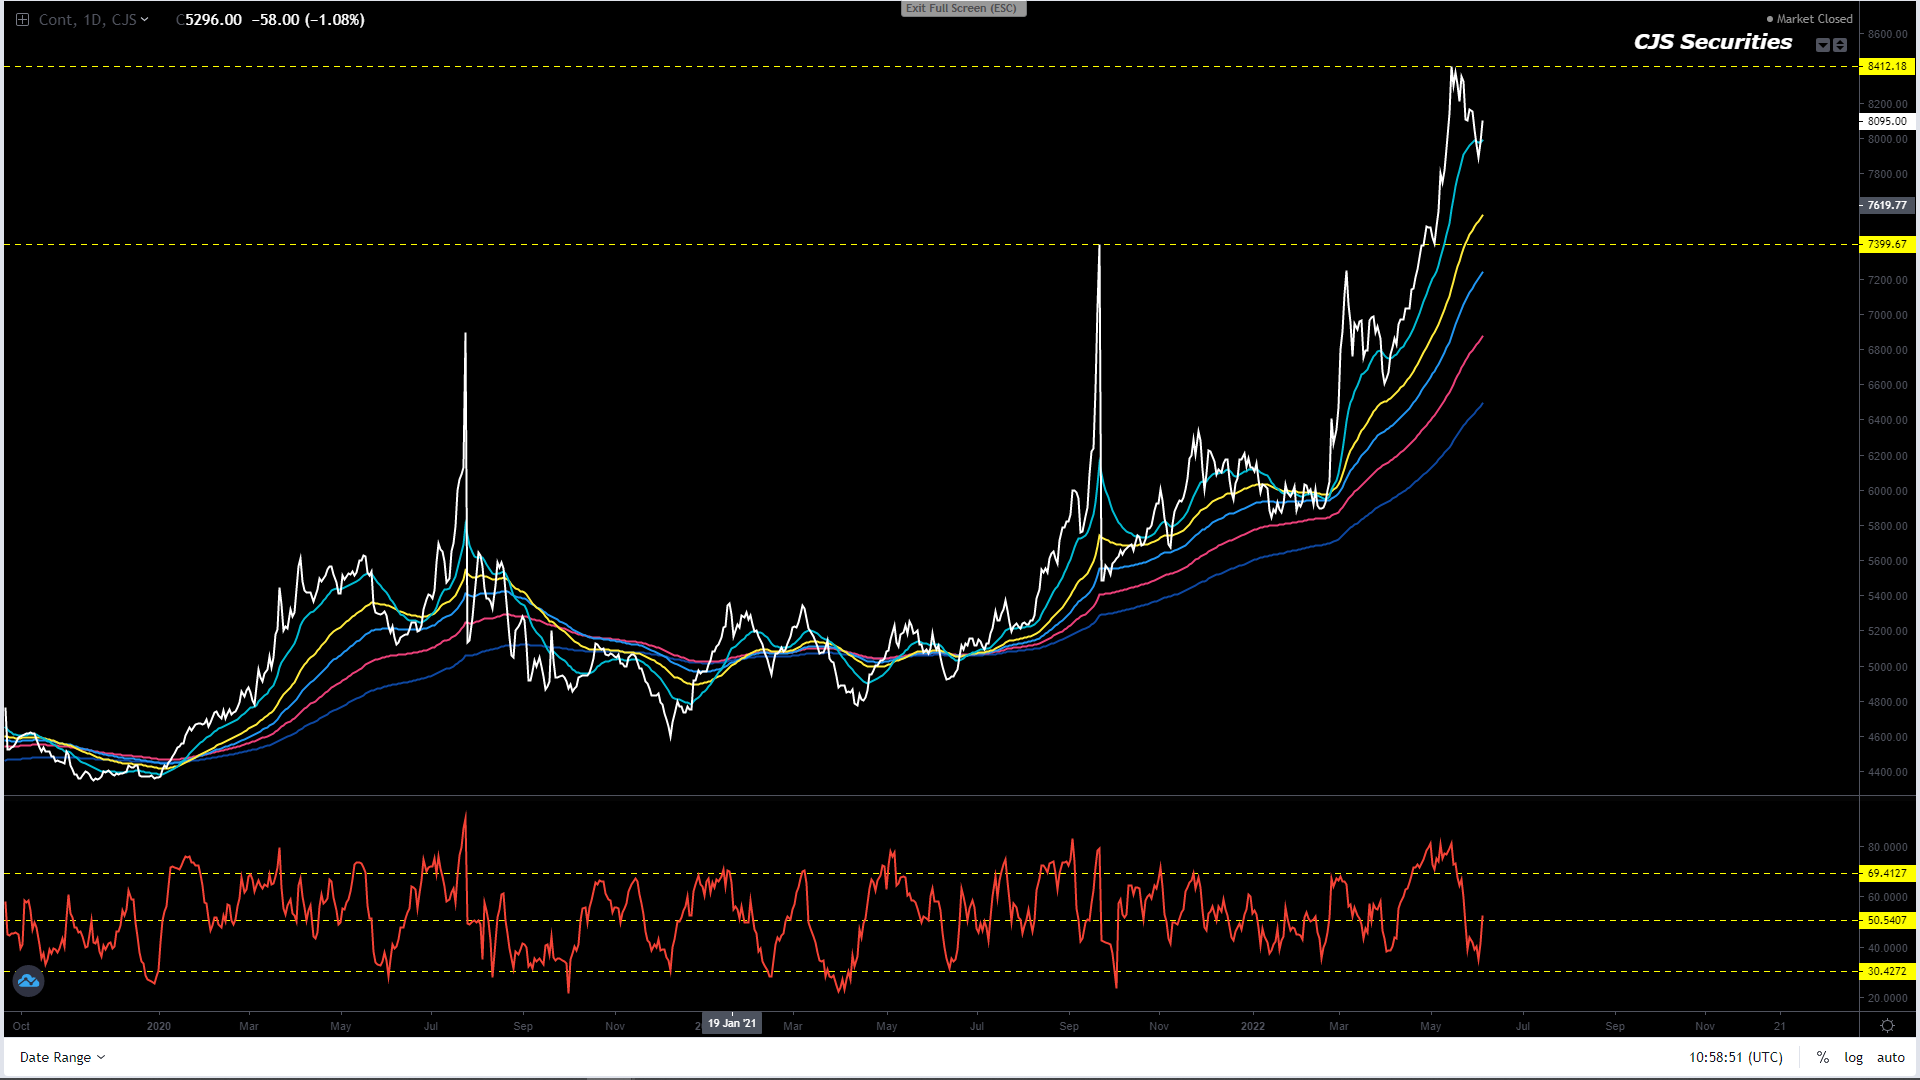
Board Crush Continuous Daily Close
I am not normally a bottom picker, but sometimes the opportunity is just too great to pass up. – we are long at $0.88 and looking at taking profit at $1.05.
This is one of those times and I will buy this chart at best and scale down to $0.85. – nice one so far!
Oil Share Continuous Daily Close
We have missed our buying opportunity, but for those that are long I am expecting new highs!
Weekly SAF Soy Continuous Close
#No Change in Commentary
There remains no reason to sell this chart but a pullback appears to be well on the cards. – as we are currently experiencing.
We are waiting for buying opportunities R400 – R600 lower.
Weekly SAF Suns Continuous Close
#No Change in Commentary
Technically I am now waiting to sell a rally R300 – R600 higher!
R11 400 – R11 700in the July 2022 contract.
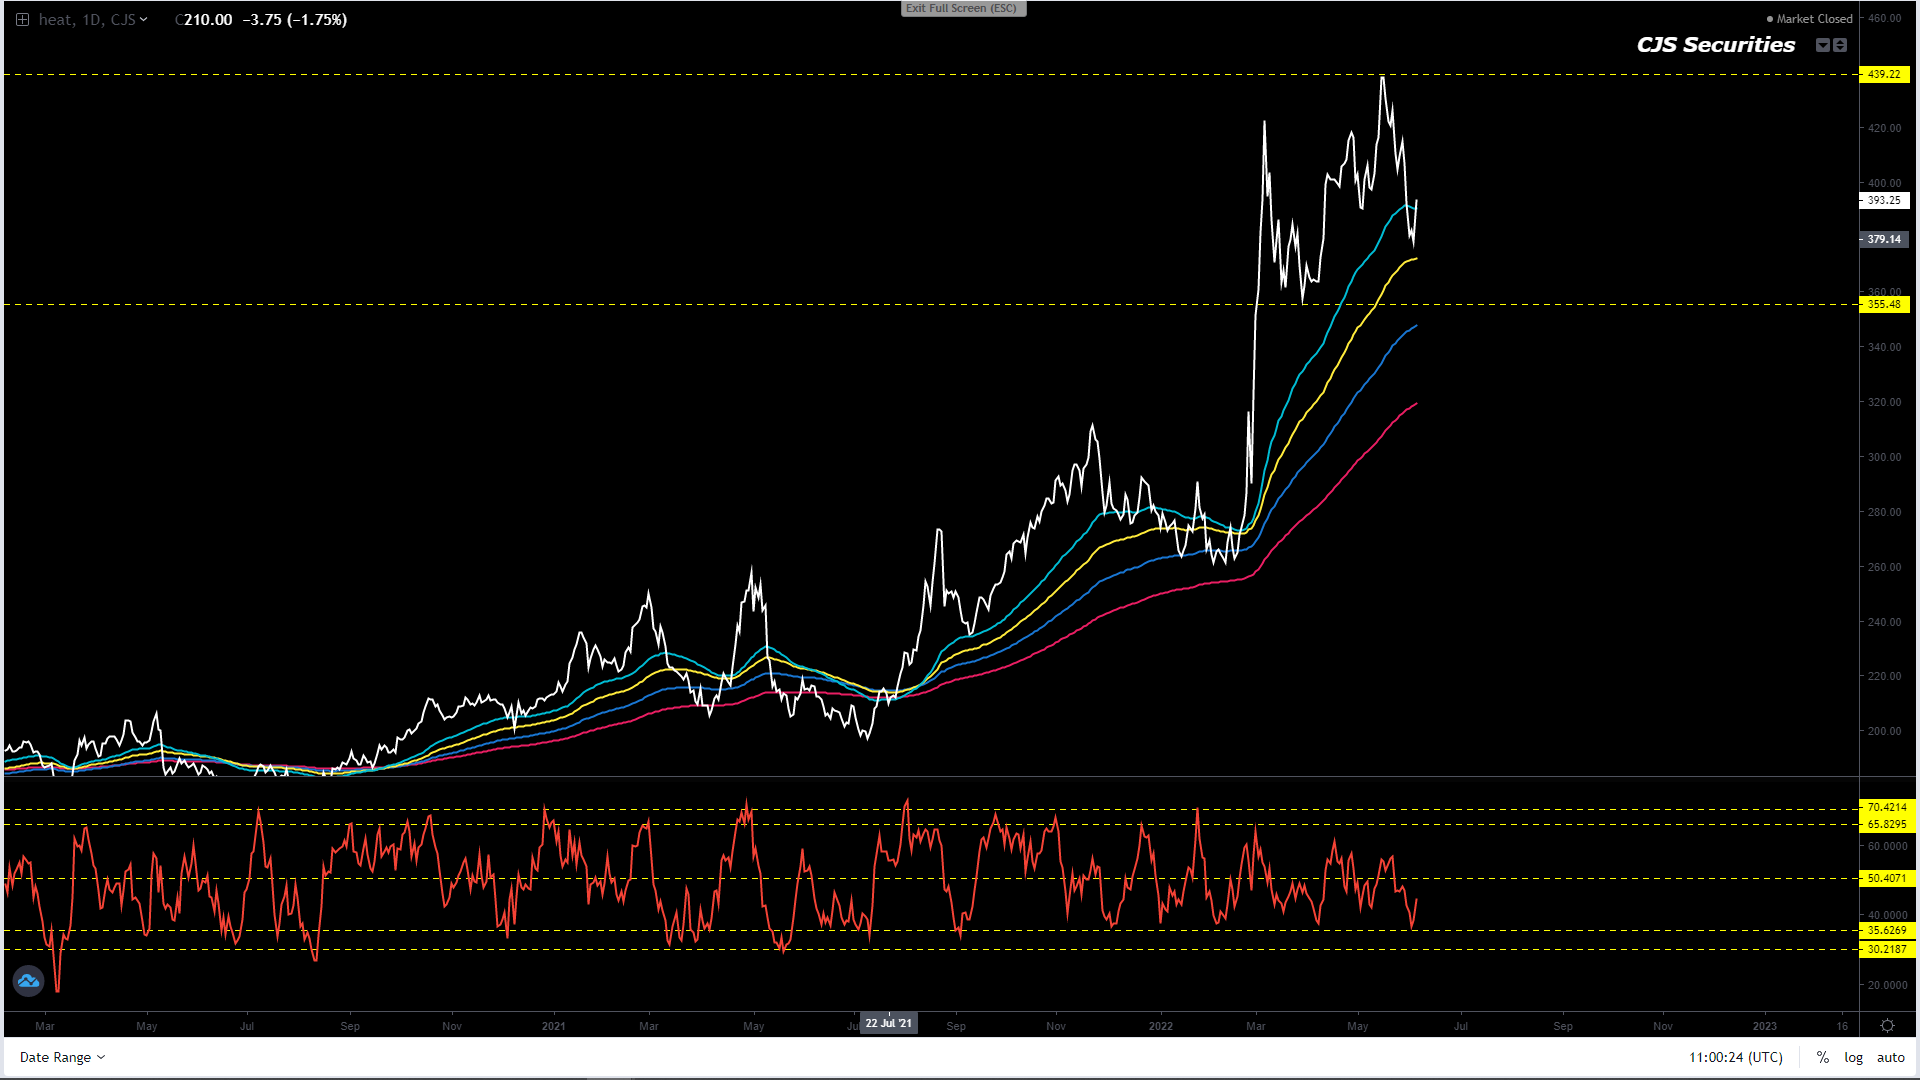
Weekly CBOT Soy Oil Continuous Close
Although I would allow the market to play out for a good few weeks, the current formation is pointing to new highs.
We are however, very happy to wait after making a massive profit being long and are now looking at playing the market from the short side.
Patience is a virtue!
Weekly CBOT SBM Continuous Close
This
chart is wild and I would stay out for at least another 2 weeks while allowing
the chart to play out.
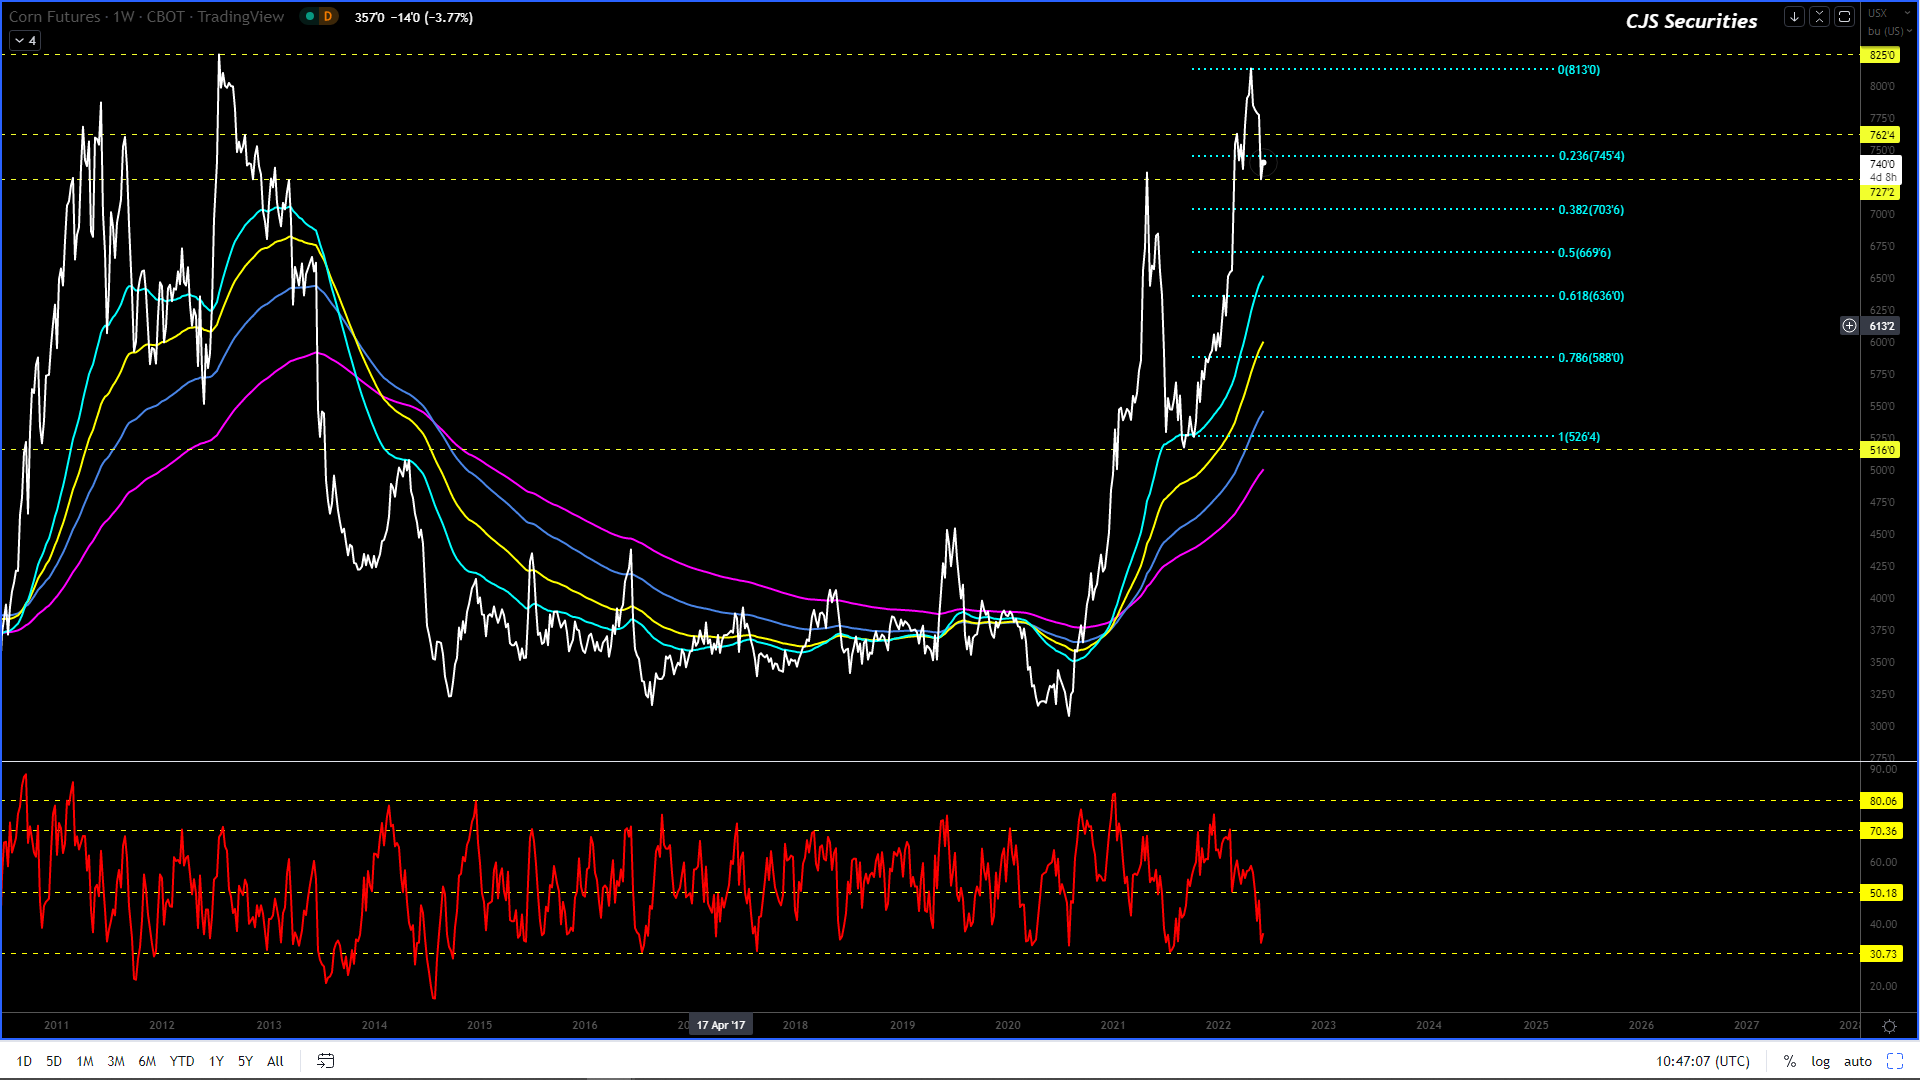
The below looks to be playing out nicely right now, BUT for this chart to print the $7.00 level, it would now need to kick all the back to $7.90.
BEWARE headline risk as there should be more than usual.
After doing some seriously LT tech research, this is the very 1st chart I have seen that has an 11.08 extension and its with this in mind that I feel we will have a multi week correction that eventually comes and prints the low $7.00 levels again.
I remain bullish in the greater scheme of things and a pullback of this nature would be seen as a magnificent buying opportunity.
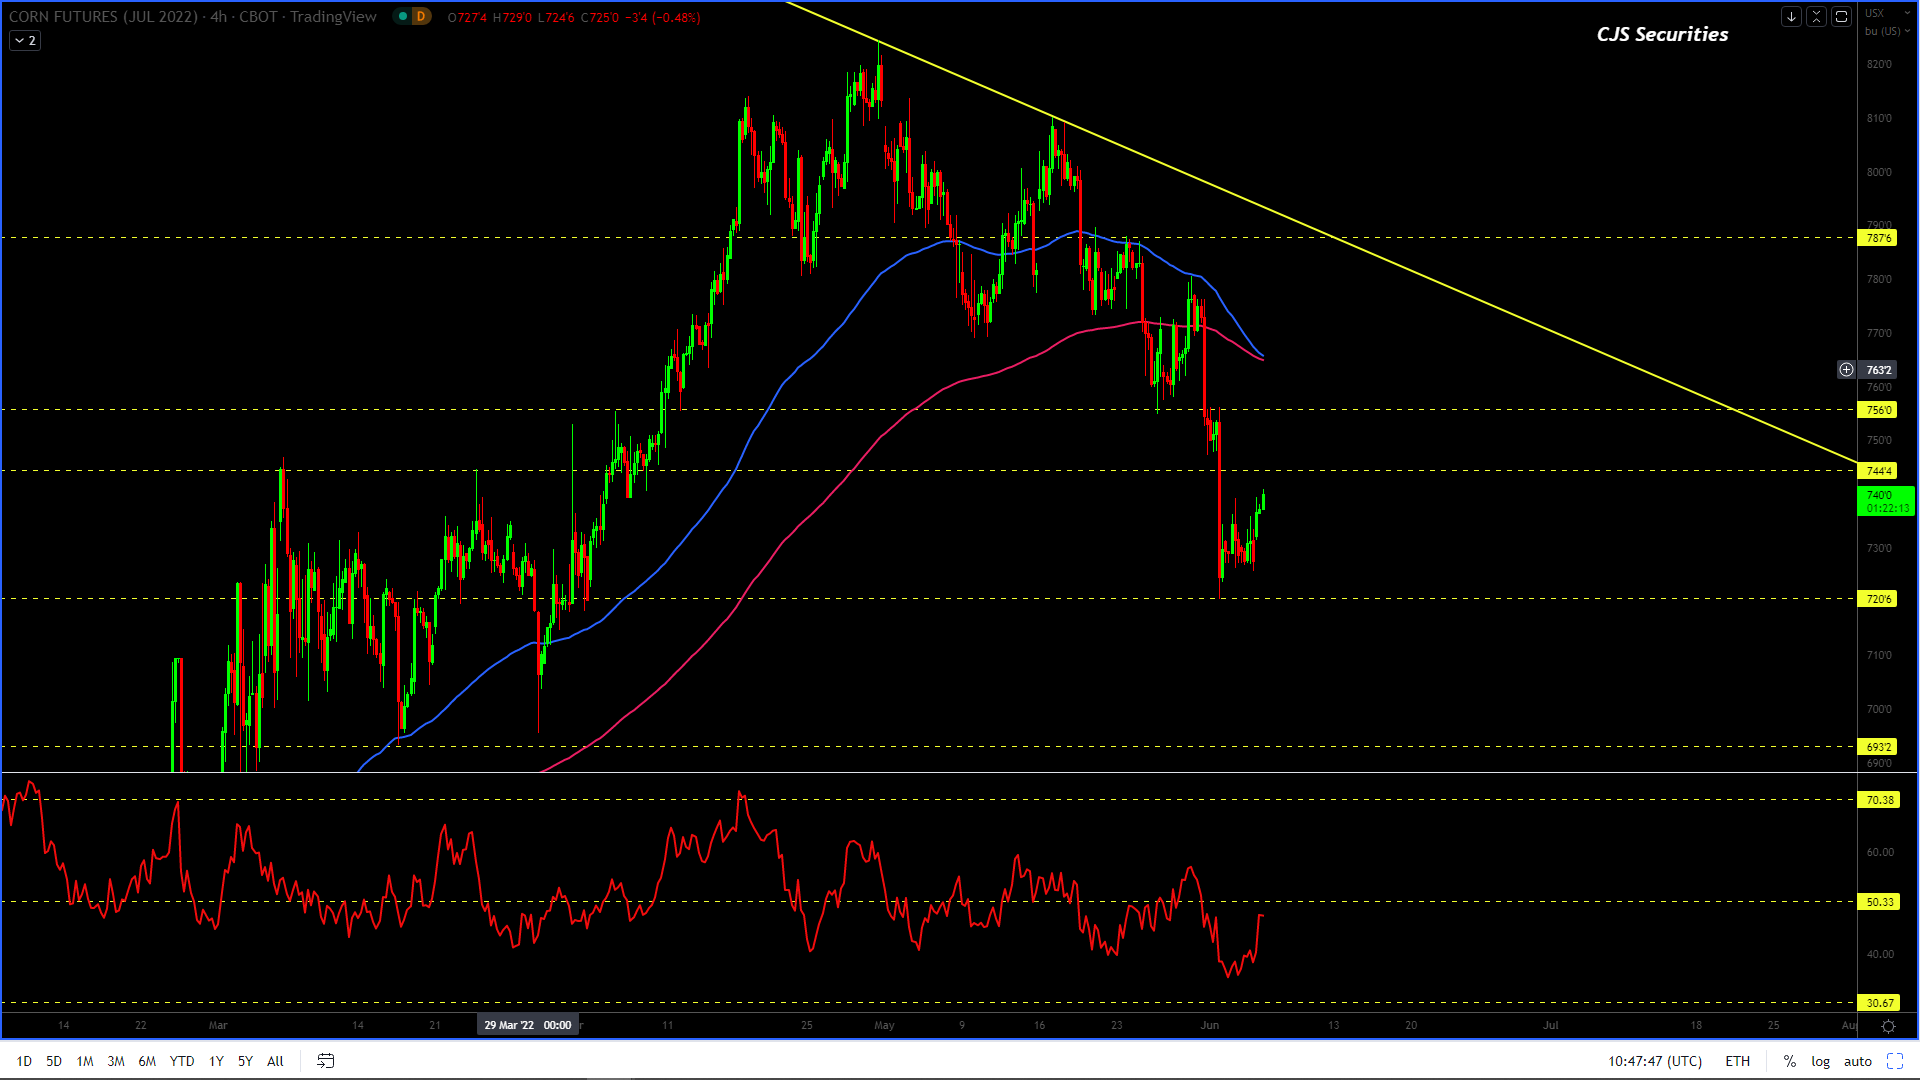
240 Min July 22 Corn Candle Chart Close
The chart went through the $7.50’s like a hot knife through butter.
Based on the current formation this chart either moves to $7.44 and makes its last leg lower or just moves hard north from here with targets at $7.90.
Because of the above view I would only look to hold onto positions for $0.30 and no more as volatility is here to stay in a very big way.
Weekly WM Continuous Close
After experiencing over a R250 correction, I can now say that a rally in this chart would constitute a selling opportunity.
For the producers that sold into strength congratulations and for those that have not, beware harvest pressure is coming and scoreboard pressure will be worse because once we hit R4100 all you will be able to think of is the R700 you left on the table. I would still use strength to price!
Weekly YM Continuous Close
After experiencing over a R250 correction, I can now say that a rally in this chart would constitute a selling opportunity.
For the producers that sold into strength congratulations and for those that have not, beware harvest pressure is coming and scoreboard pressure will be worse because once we hit R4200 all you will be able to think of is the R600 you left on the table. I would still use strength to price!
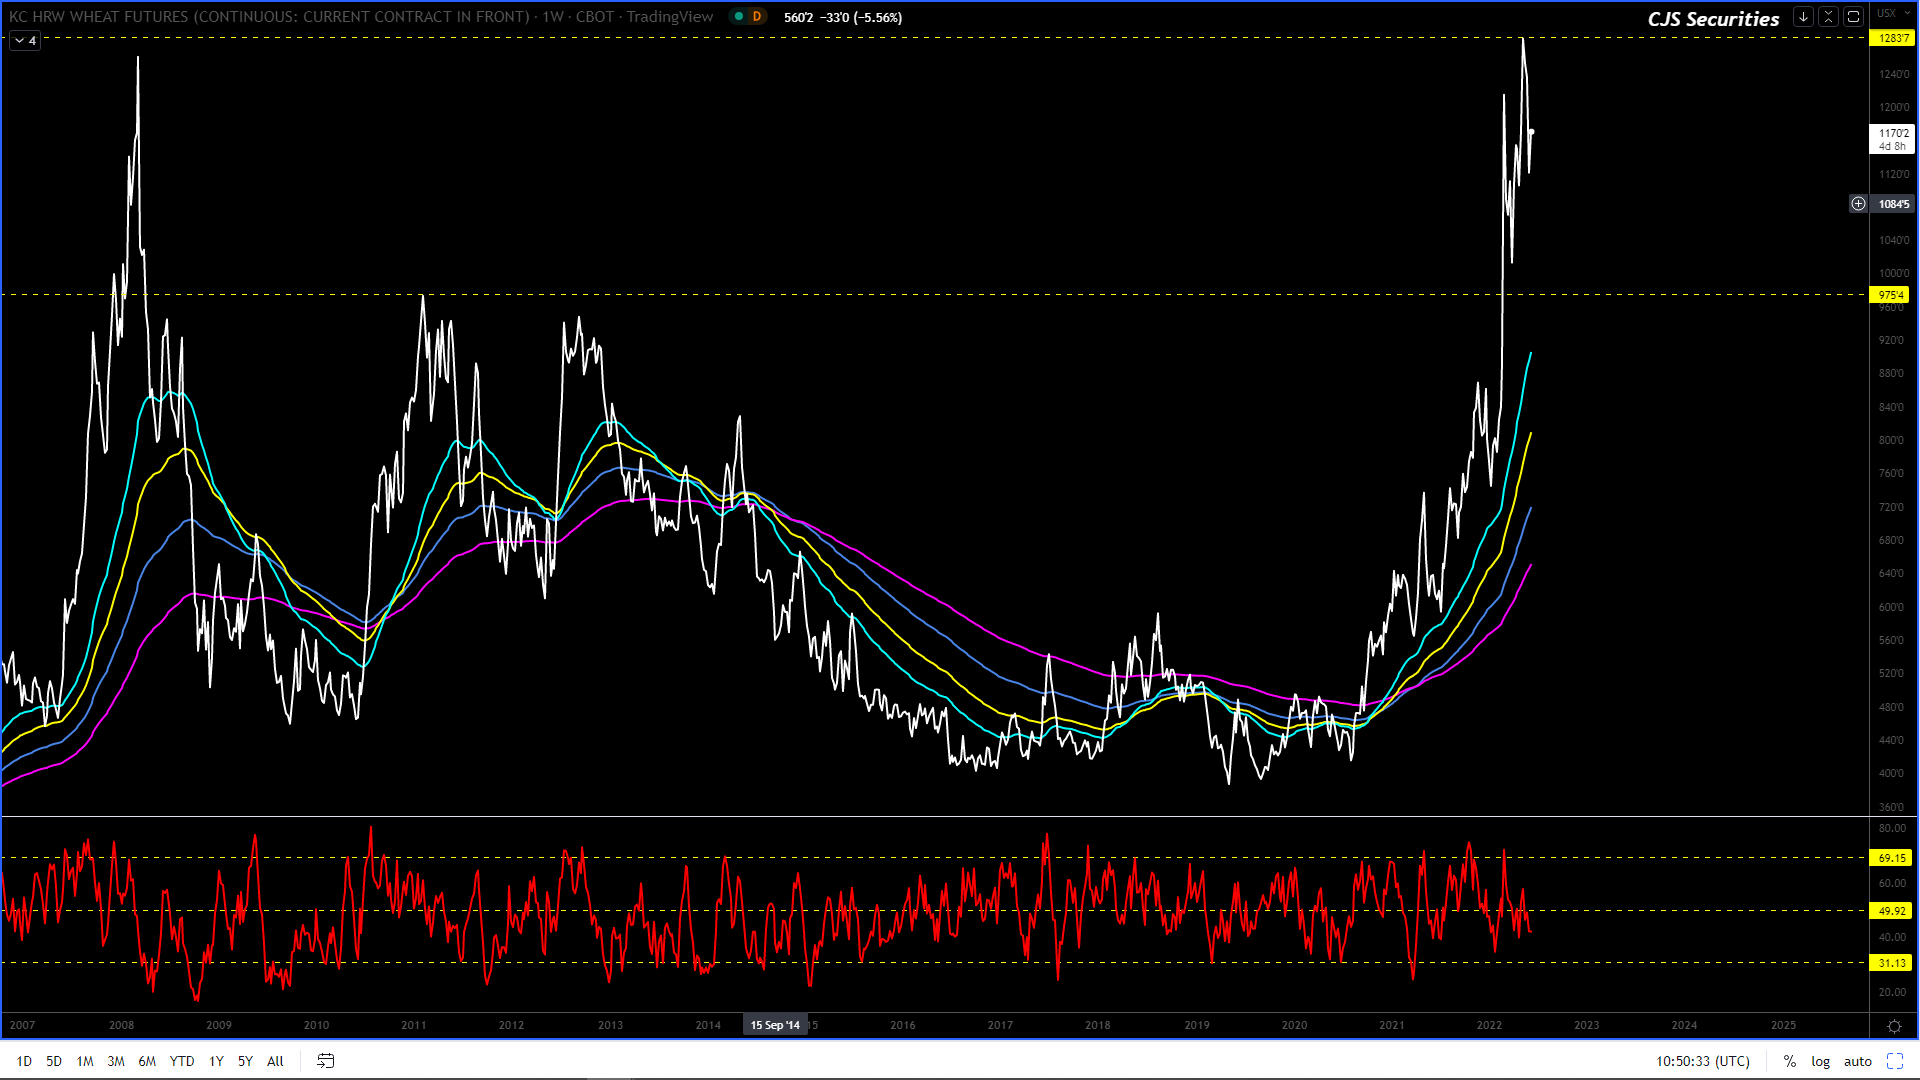
Weekly KC Wheat Continuous Close
I would advise sitting out until further notice as the risk of a deep pullback is very high.
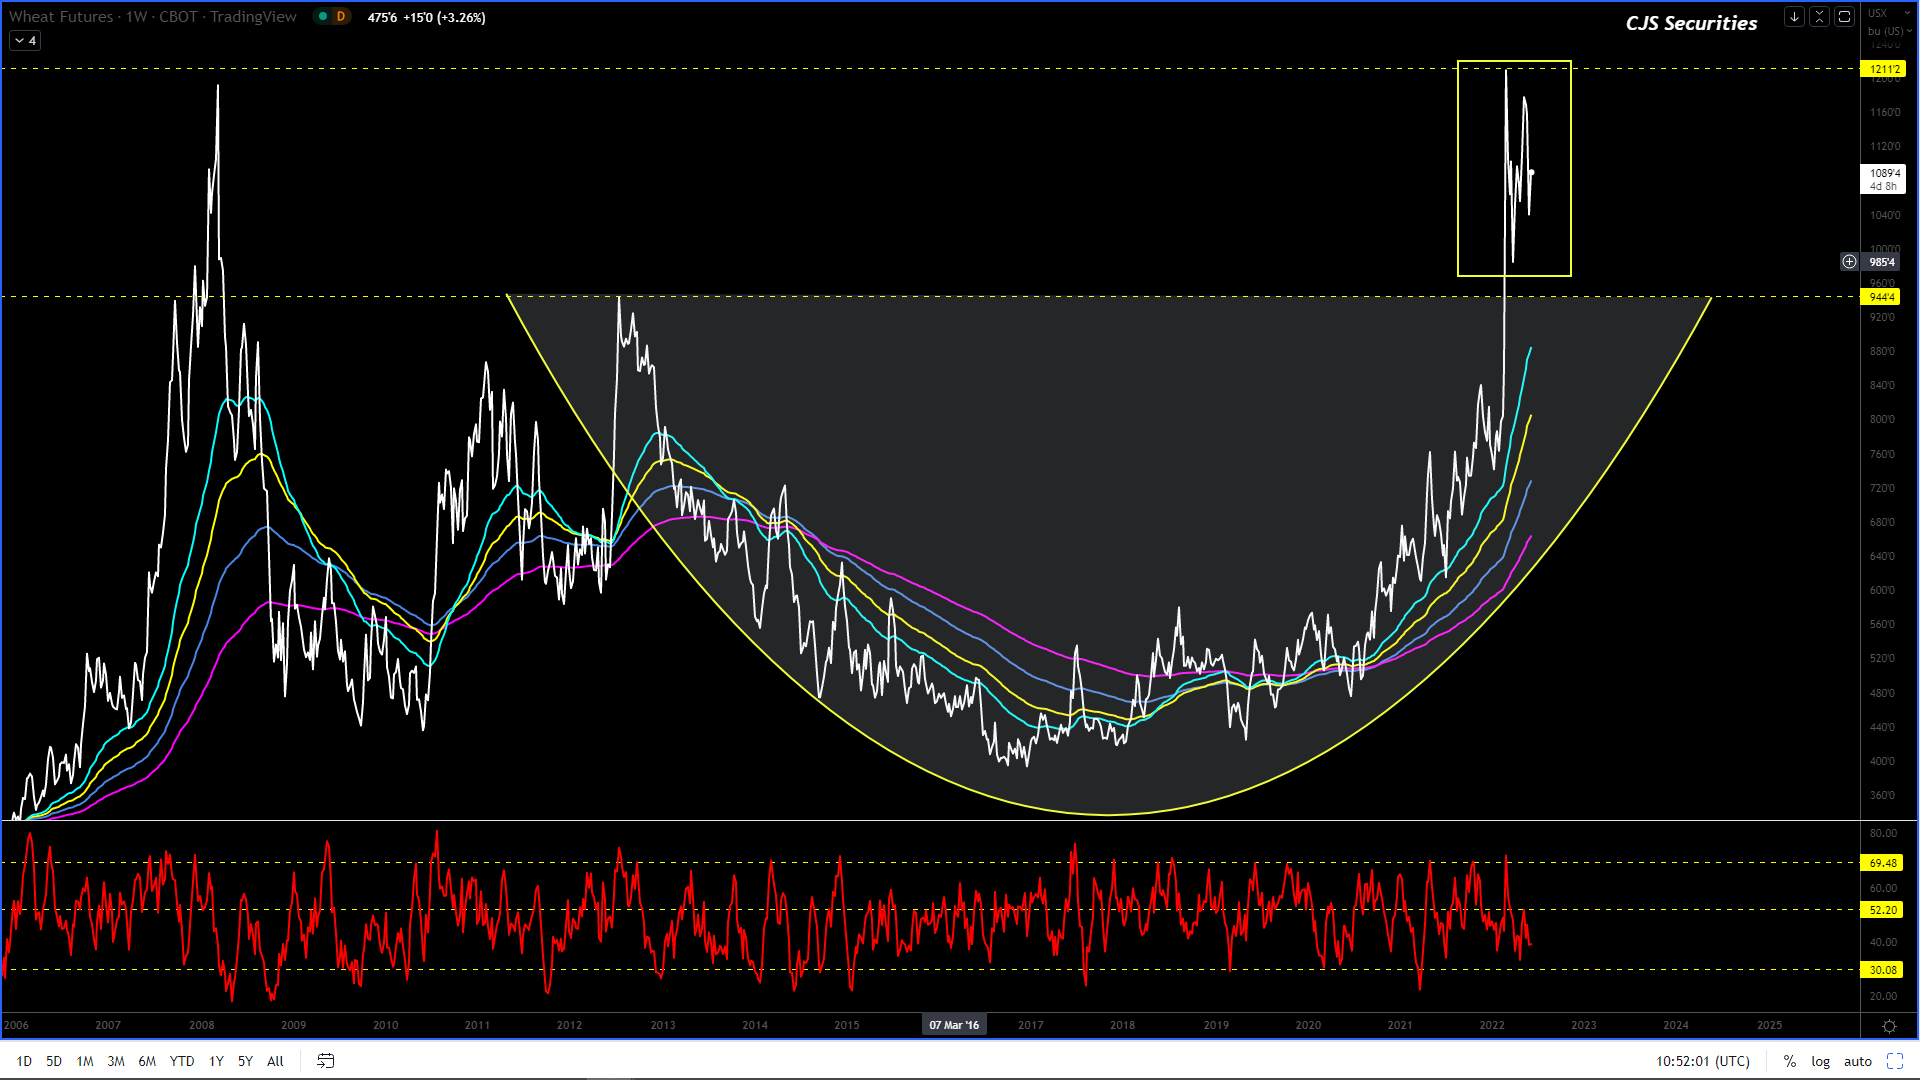
Weekly Chicago SRW Wheat Continuous
I would take profit on all longs and go square as the risk of a deep pullback is pretty high.
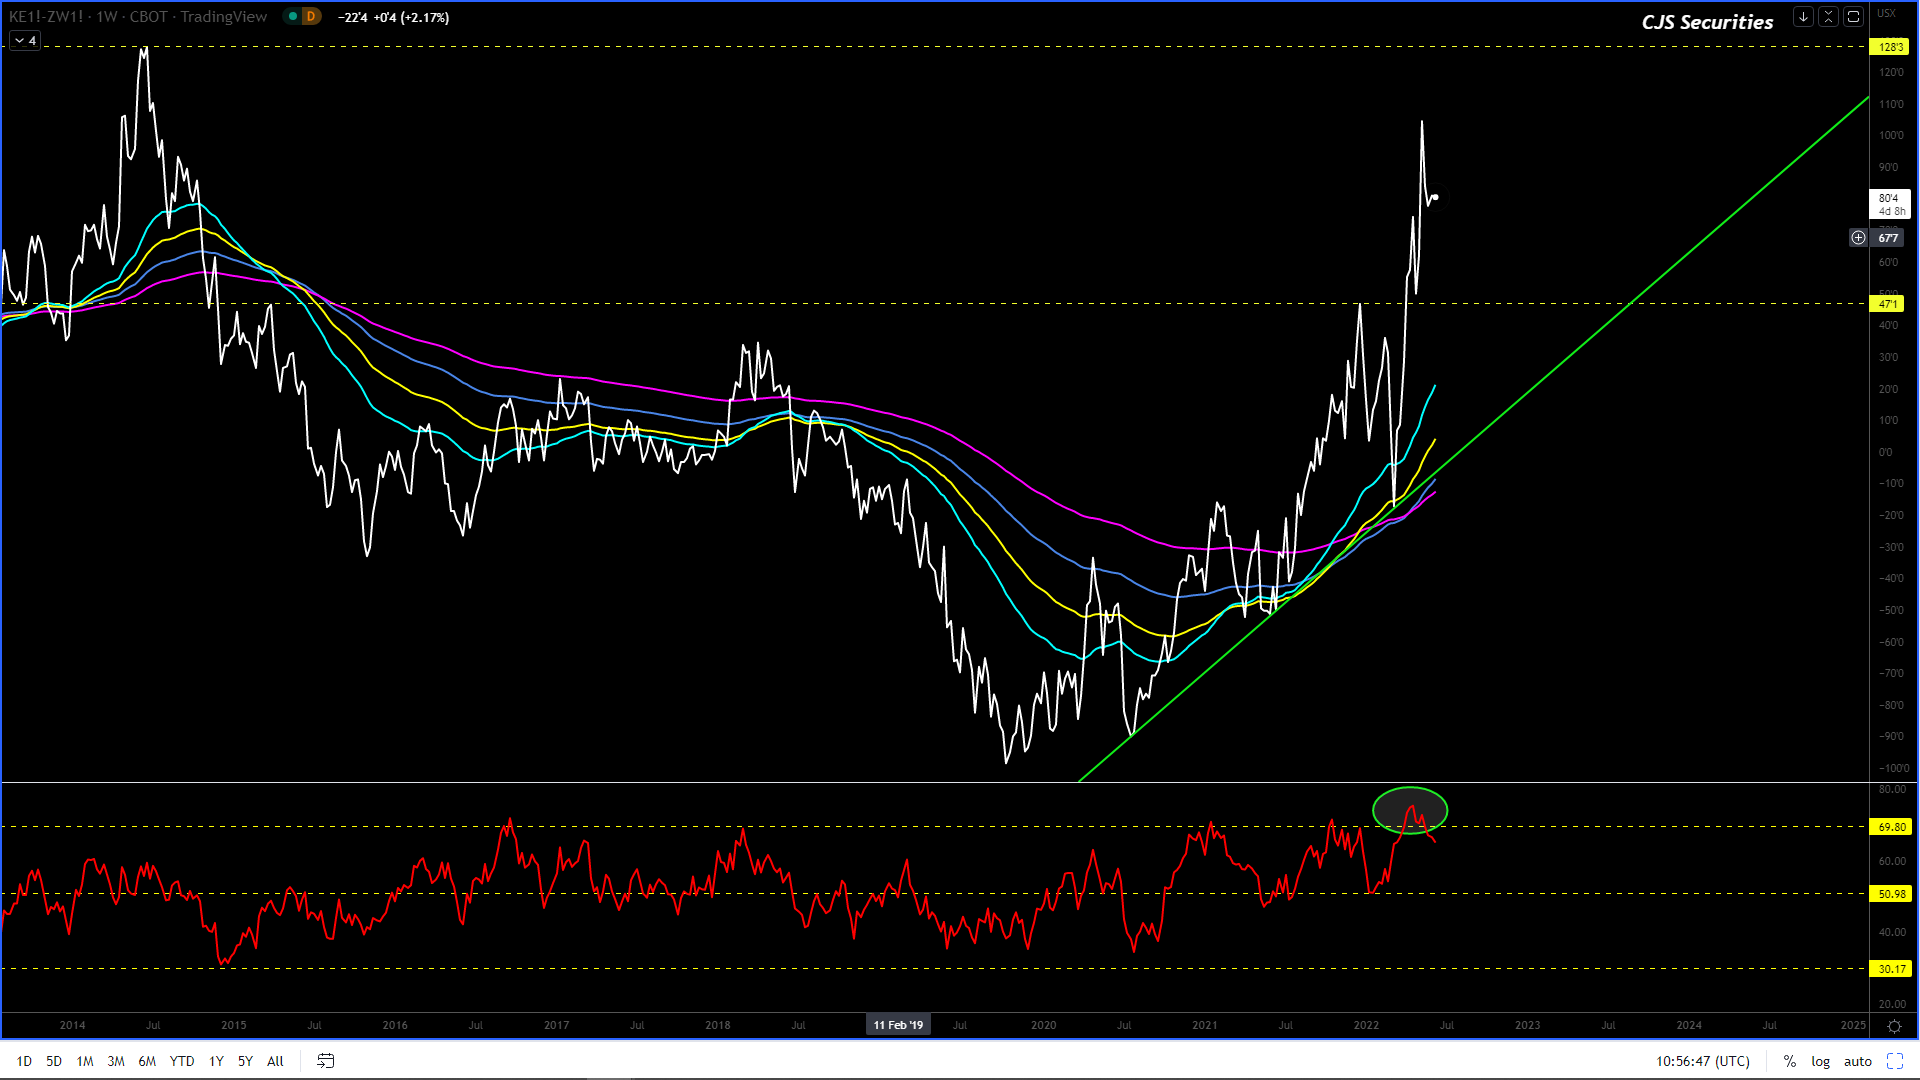
Weekly Close KC Wheat v Chicago SRW Continuous Close
I want to buy this chart at $0.60!
Patience is a virtue!
Weekly SAF Wheat Continuous Close
I am now super keen to buy this chart right here, right now scale down to R7850!
Daily Matif Wheat Continuous Close
I would take profits on
all longs and go square and only look at buying 15%lower!
Firstly it appears that “Dollar Gate” has had zero effect on the ZAR and in fact seems to be positive, but as the saying goes “bad news does not matter, until its matters and then it really matters”!
I still believe we are busy with a correction and at current levels and down to R15.16 there is massive support.
However, volatility has been massive and just to put it into perspective, three Monday’s ago the price was R16.34 and today we are at R15.34.
This correction will have a range of R15.40 – R16.30, which is massive but I would want to own the bottom of the range. – and will buy all the way down to R15.12.
I still see the below taking place over time, with these comments having been posted here for many weeks!
What I see is R11.50 over the next 17 months.
I am convinced that the ZAR is in a multi-year corrective phase vs. the USD and that from today on, all upward spikes on this chart are well worth a short!
This chart could easily have a leg higher and trade toward the R16.77 level in the coming weeks. – I would use this as a USD selling opportunity.
I am happy to be long the Dollar down to the R14.40’s. – this view is playing out brilliantly and we would only take profit at R16.44!
Dollar/Rand Daily Candle
This chart is now very much in a corrective phase.
The chart has now completed more than a 50% retracement and has now printed the 144 Day EMA, this along with the 233 Day EMA at R15.24 will provide massive support in the coming days.
I remain an advocate of buying the dips and a move back into the R15.40’s would be a great buying opportunity. – we would need to buy down to R15.24 now.
The last leg higher that I have been waiting for, and the one we are currently in, could see the chart trade as high as R17.29.
Dollar/Rand 240 min Candle
We remain long at R15.41 and long against the carry that hurts as much as it is irritating.
But as the saying goes “in for a penny in for a pound” (let us hope it does not cost us pounds) we will need to buy more scale down as our overall view across time frames remains that the chart is correcting before looking to go higher.
We would still look at exiting longs over R16.44.
Euro/USD Weekly Close
#No Change in Commentary
This chart’s support has held and although I feel there is a kick in it, I am not convinced the downside is over.
Hence I will be looking to sell a rally over $1.0750!
US Dollar Index Weekly Candle
#No Change in Commentary
The chart is now coming off the highs and this will only be a consolidation until it rallies again.
This chart needs another leg higher once this correction is over.
SA Government Bond 30 Year Yield Daily Close
#No Change in Commentary
After a massive rally we have had a really good pullback, I still however fancy this chart to print over 11.40% in the coming months.
US Government Bond 30 Year Yield Weekly Close
#No
Change in Commentary
This chart is in a
corrective phase and will have another leg higher.