CJS Securities

Categories
Uncategorized

Quick Fire Corn Update

Quick Fire: Corn Update
23 August 2022

Daily Candle in USD

It’s been a long road to get back to $6.41 for the MT low at $5.62.

Based on the chart’s current formation, there is every possibility that we can experience a 61.8% retracement and print $6.80.

With the above in mind, I would like to go on the record as saying that I would fade a rally and that I am not super bullish overall.

My reasons are:

  •  We have struggled to get up here with all the bad news.
  • We have SAM yet to plant.
  • Has China already stockpiled with a war on the horizon?
  • Will China purchase more Brazilian corn?
  • How long can global prices stay high with inflation running rampant?
  • The US farmer has much to price even at 170 BPA.
  • Why would commercials go super long here and not continue hand to mouth?
  • How much upside is there for funds to build a new long position here, and who would they eventually sell to?

Good Luck to all. It’s rough out there!

Daily Candle in ZAR

This chart is Spot ZAR (in cents) over US Corn in USD.

The pricing is not exact as it does not account for the carry, but it is close enough.

The current formation looks similar to USD Corn and has another R200 potential upside.

Overall I would look at R4600 being the upside of the range and I would be selling into strength with my downside targets being R800 lower.

Remember the ZAR and US Corn hardly ever work in unison and I feel this time will be no different.

Happy Hunting. 

Categories
Uncategorized

Quick Fire Dollar / Rand Update

Quick Fire Dollar / Rand Update
22 August 2022

Weekly Close

It’s been a long three weeks, with volatility being the order of the day and the ZAR trading on its steam, and frankly, I have had no objective view, hence my reluctance to post anything.  

Please keep the last few weeks in the memory bank when reading the below commentary.

As most of you will know, I have been bearish on the ZAR and looking for upside targets from R17.50 – R18.30.

This was predominantly why I was confused, as I felt the chart could be done.

Based on this last move, I am convinced that we will see the last leg higher and although I have R18.30 as an upside target, please note that the ZAR has a propensity to overshoot in both directions.

Once this last leg up has been completed, my LT view that we see the ZAR strengthen is still very much on the cards.

The carry is your friend, never forget. 
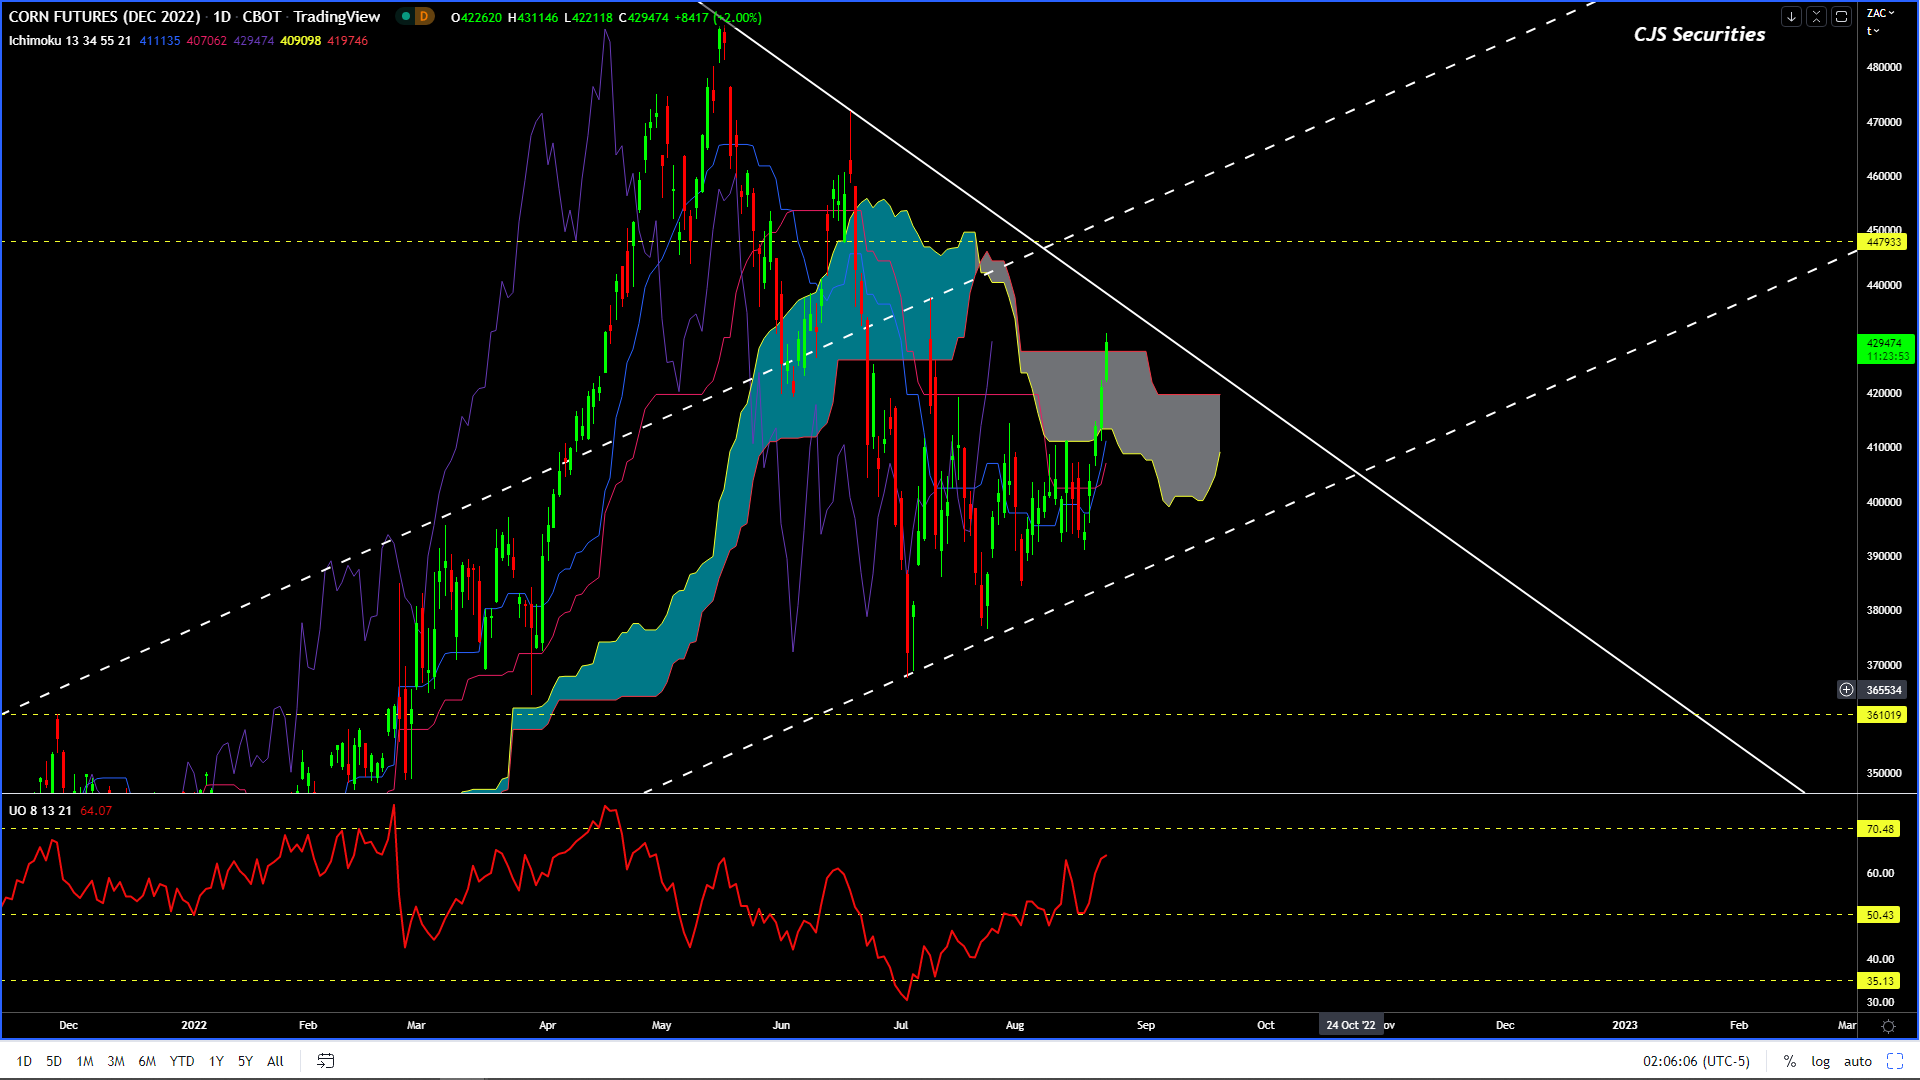
Daily Candle

This chart is looking great and complements the Weekly Close perfectly.

Please note that a week in trading could be a lifetime and especially so when it comes to the Dollar / Rand with Weekly targets around R17.65 and daily targets that could trade as high as R18.70.

The Daily oscillator is well on its way, plus the general formation has me bullish on the USD in the ST.

My general feeling is that the DXY has a leg higher and the Euro a leg lower and that USD strength will persist for a few weeks.

Good luck out there, and remember, trade the market, do not marry it!