Congratulations to all who held onto their long positions and have made an inordinate amount of money.
I am happy that we have been correct regarding being long, but considering this has all transpired due to WAR leaves me with a hollow feeling.
Please spare a thought for all those affected by this WAR.
I will not be taking a view for a few weeks or until the dust settles.
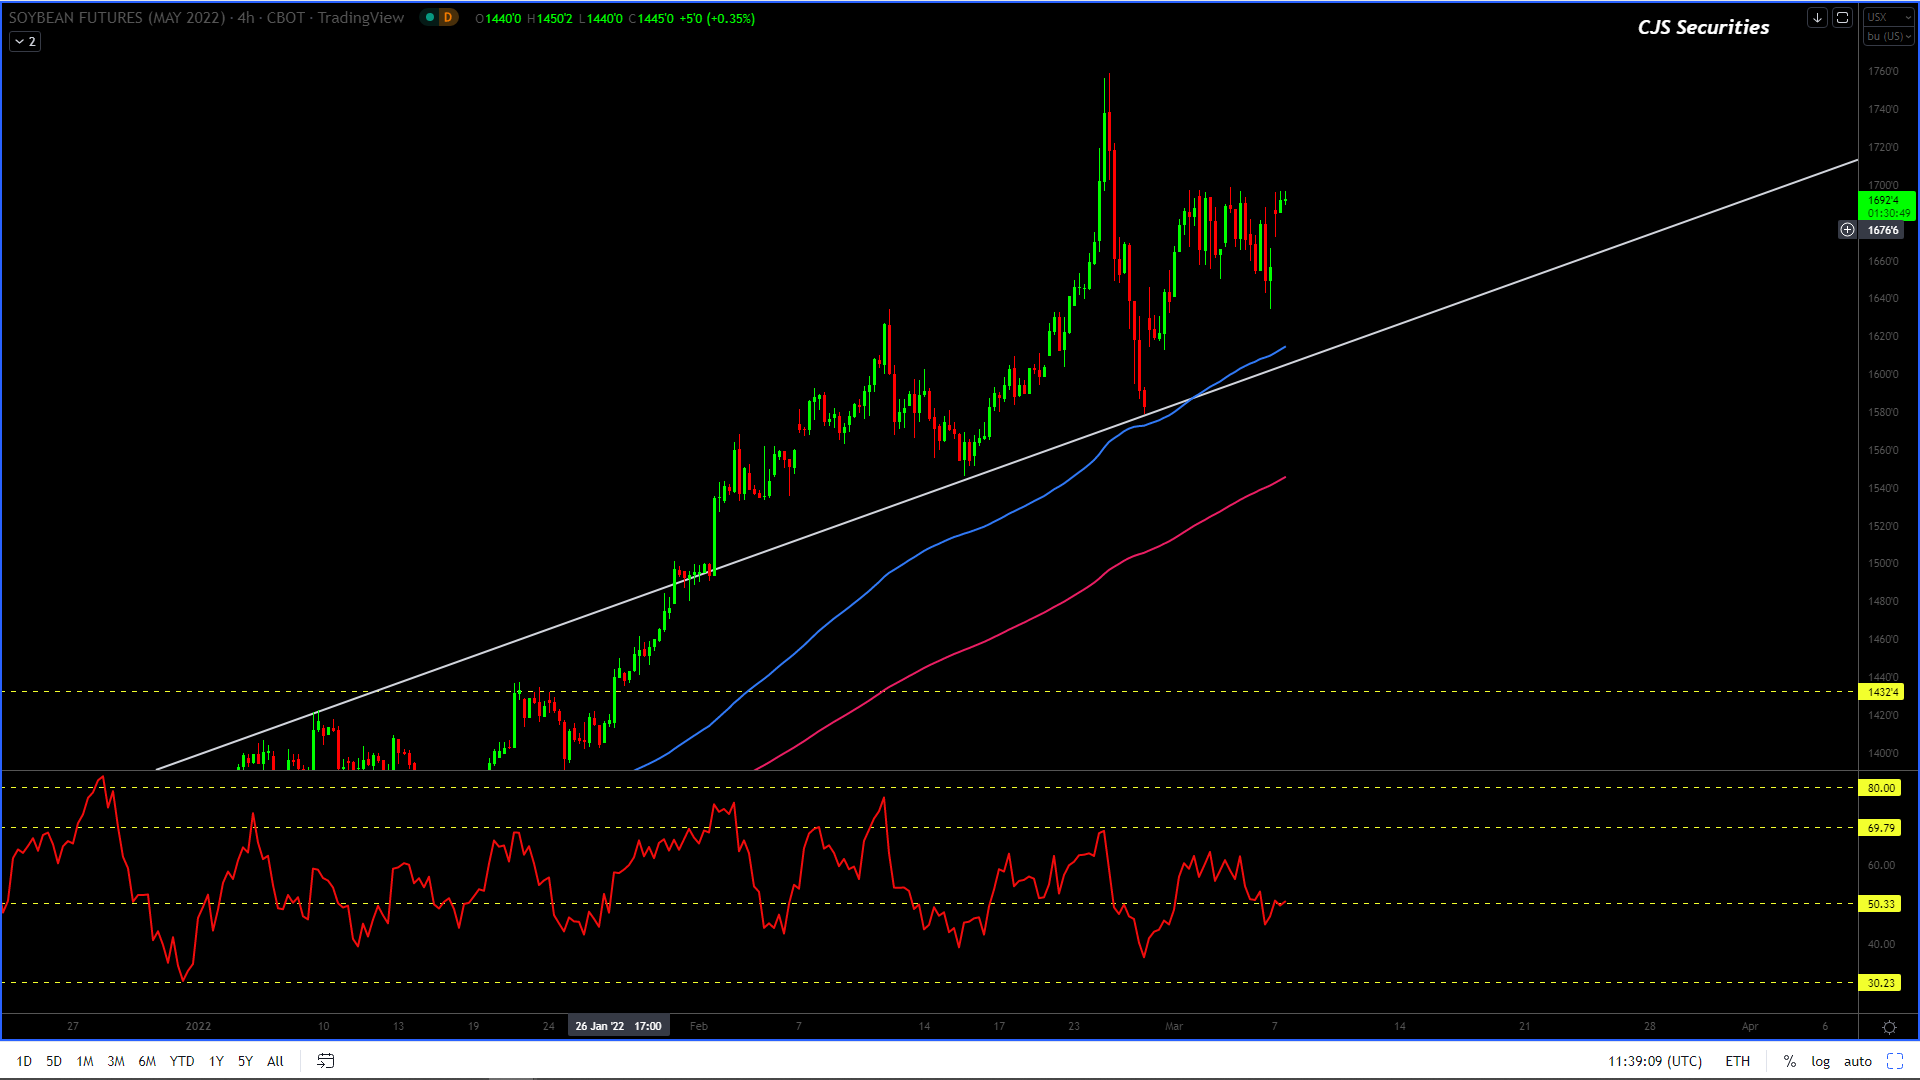
240 Min CBOT January 22 Soybean Candle Chart
The
Black Swan of WAR has ended many careers by its sound, and looking at this
chart, all I can say is that another leg up from here seems to be on the cards.
I
do not have the stomach to put on a trade though.
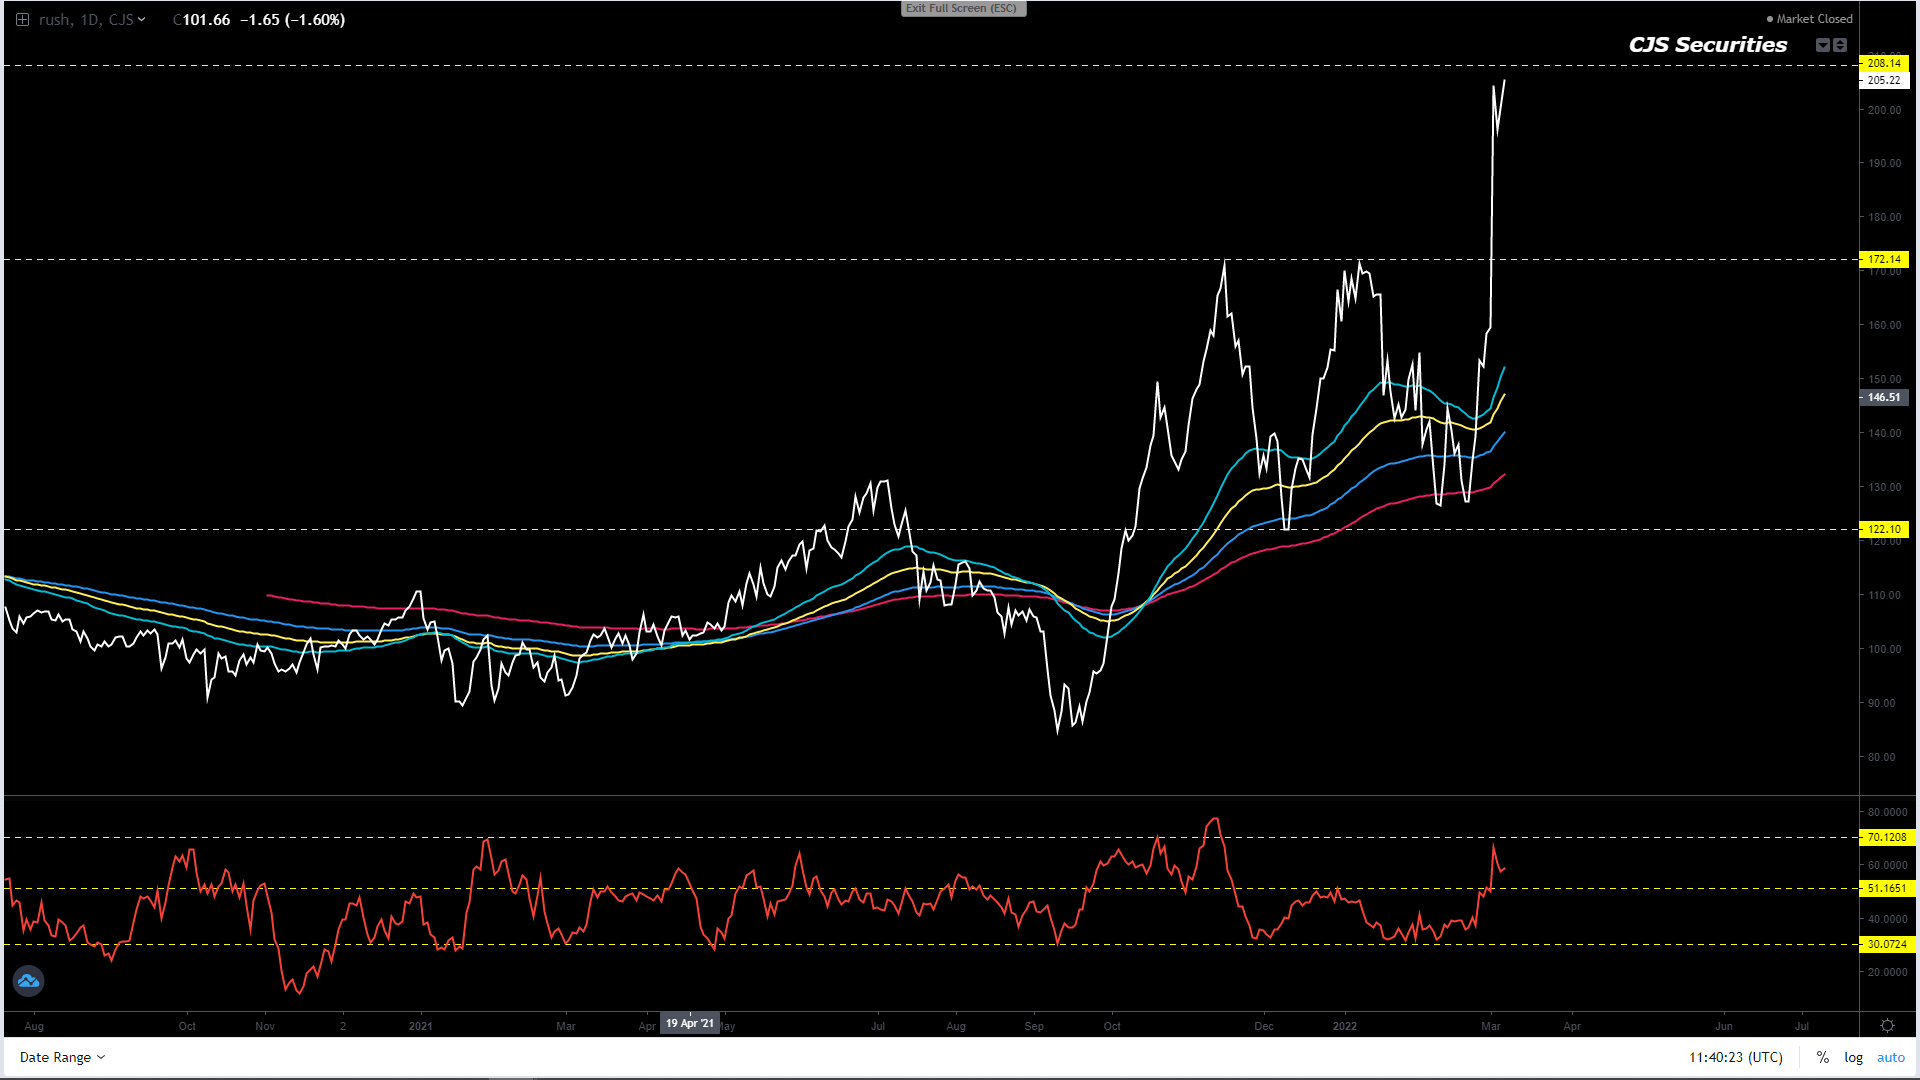
Board Crush Continuous Daily Close
There is nothing much to do here, and I am still happy to sit out.
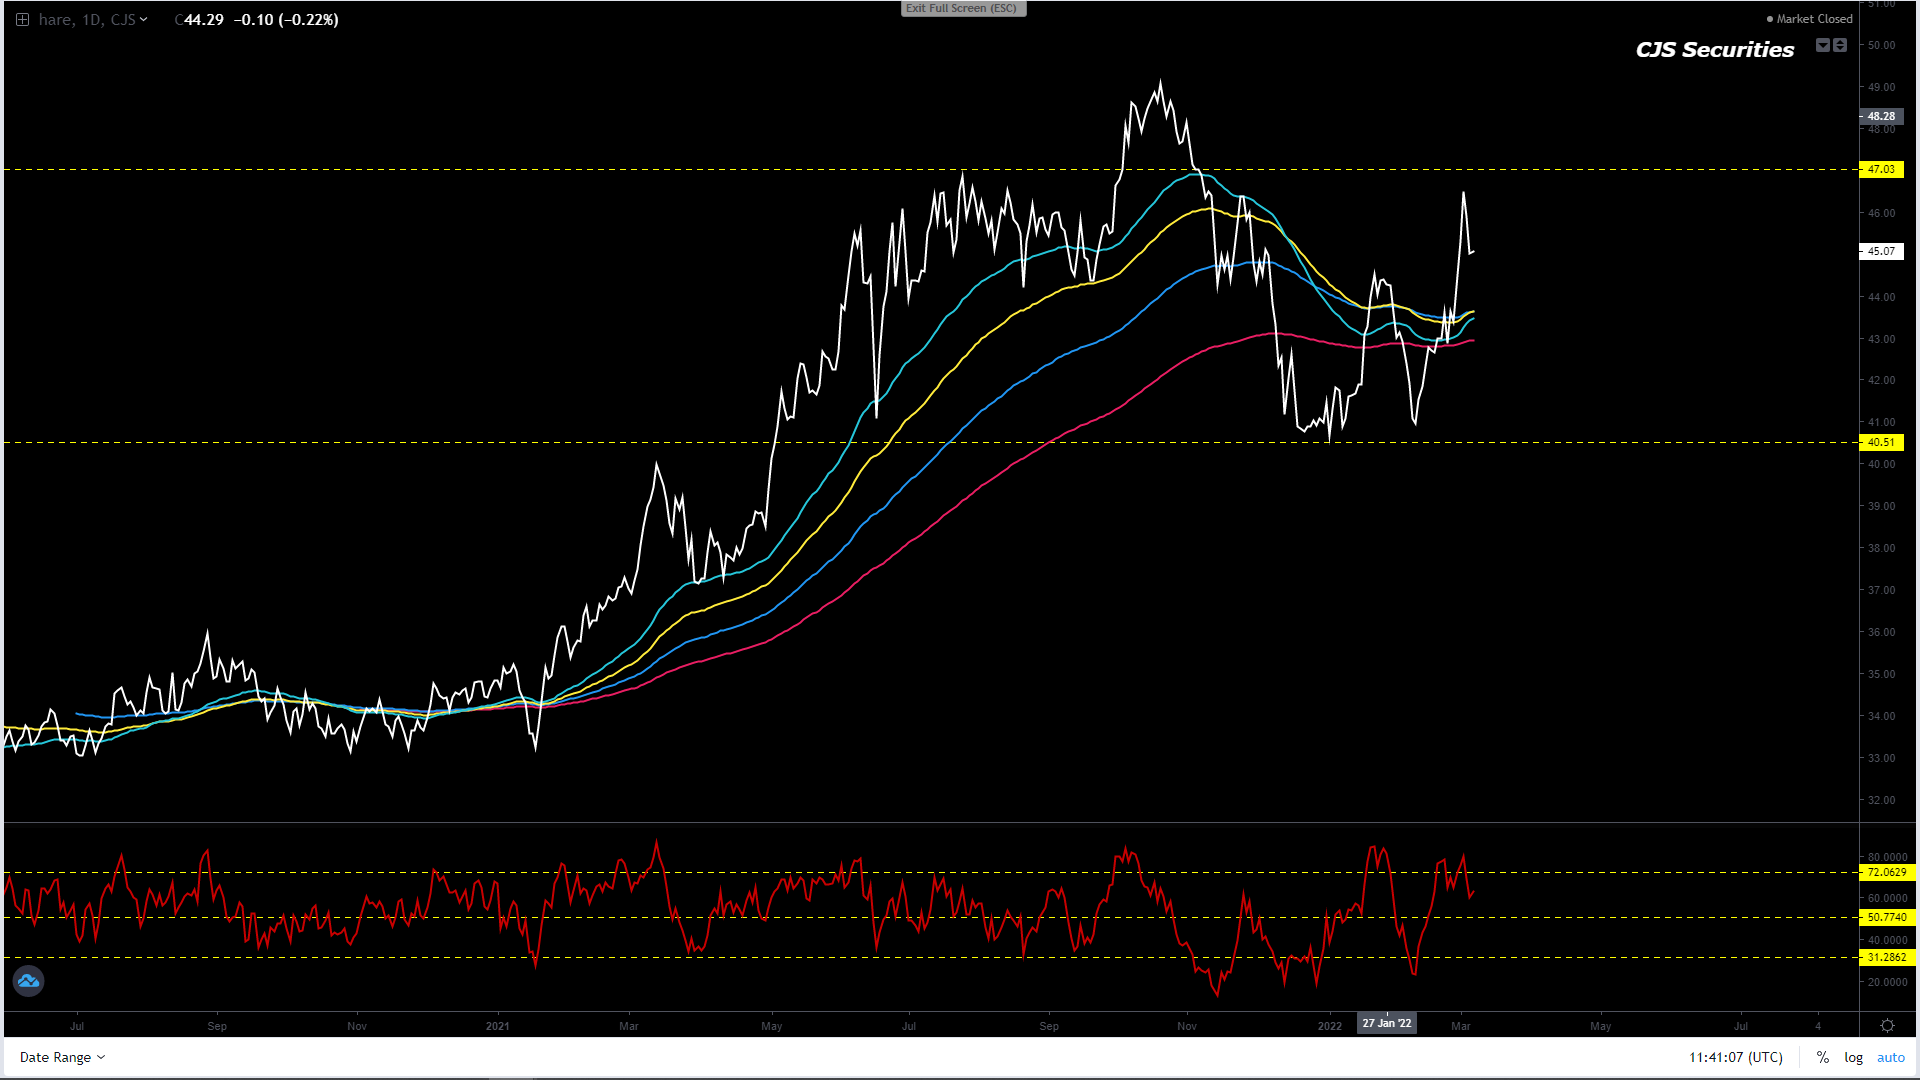
Oil Share Continuous Daily Close
We will be taking profit ASAP.
We have not been stopped on the below view but will put in a stop under 40% as this chart is now highly overbought!
“After kicking off extremely oversold levels and making a new MT low, the chart remains at oversold levels and another leg lower to 42% will get me long. – lets see how this plays out.”
Weekly SAF Soy Continuous Close
Well done to those who were long, although again, I am only sorry this move has come because of WAR.
Now is the time to sit back and wait for the next opportunity as it’s not every day that you will make R500 + on a trade
Weekly SAF Suns Continuous Close
I have had this chart wrong, and WAR’s Black Swan could quickly still drive it higher.
However, I would stay out unless one has to as a turn could happen anytime.
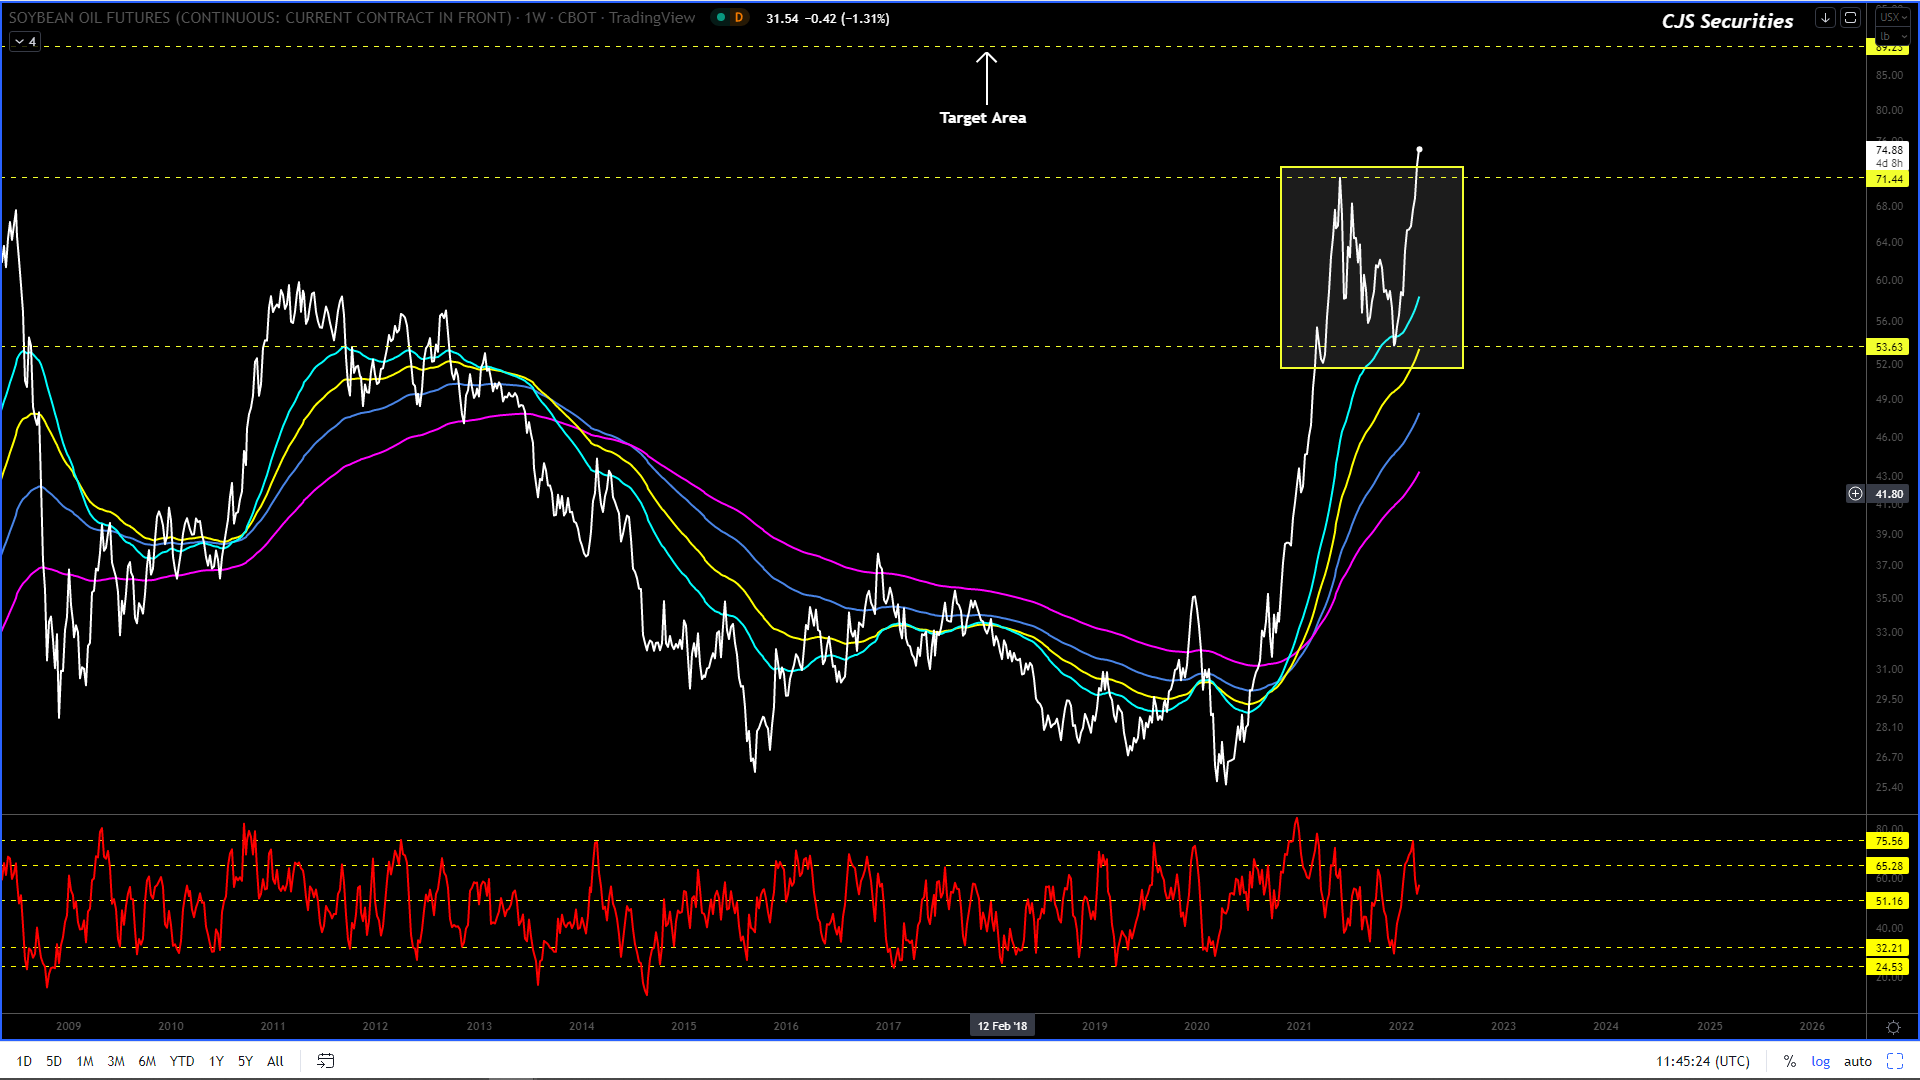
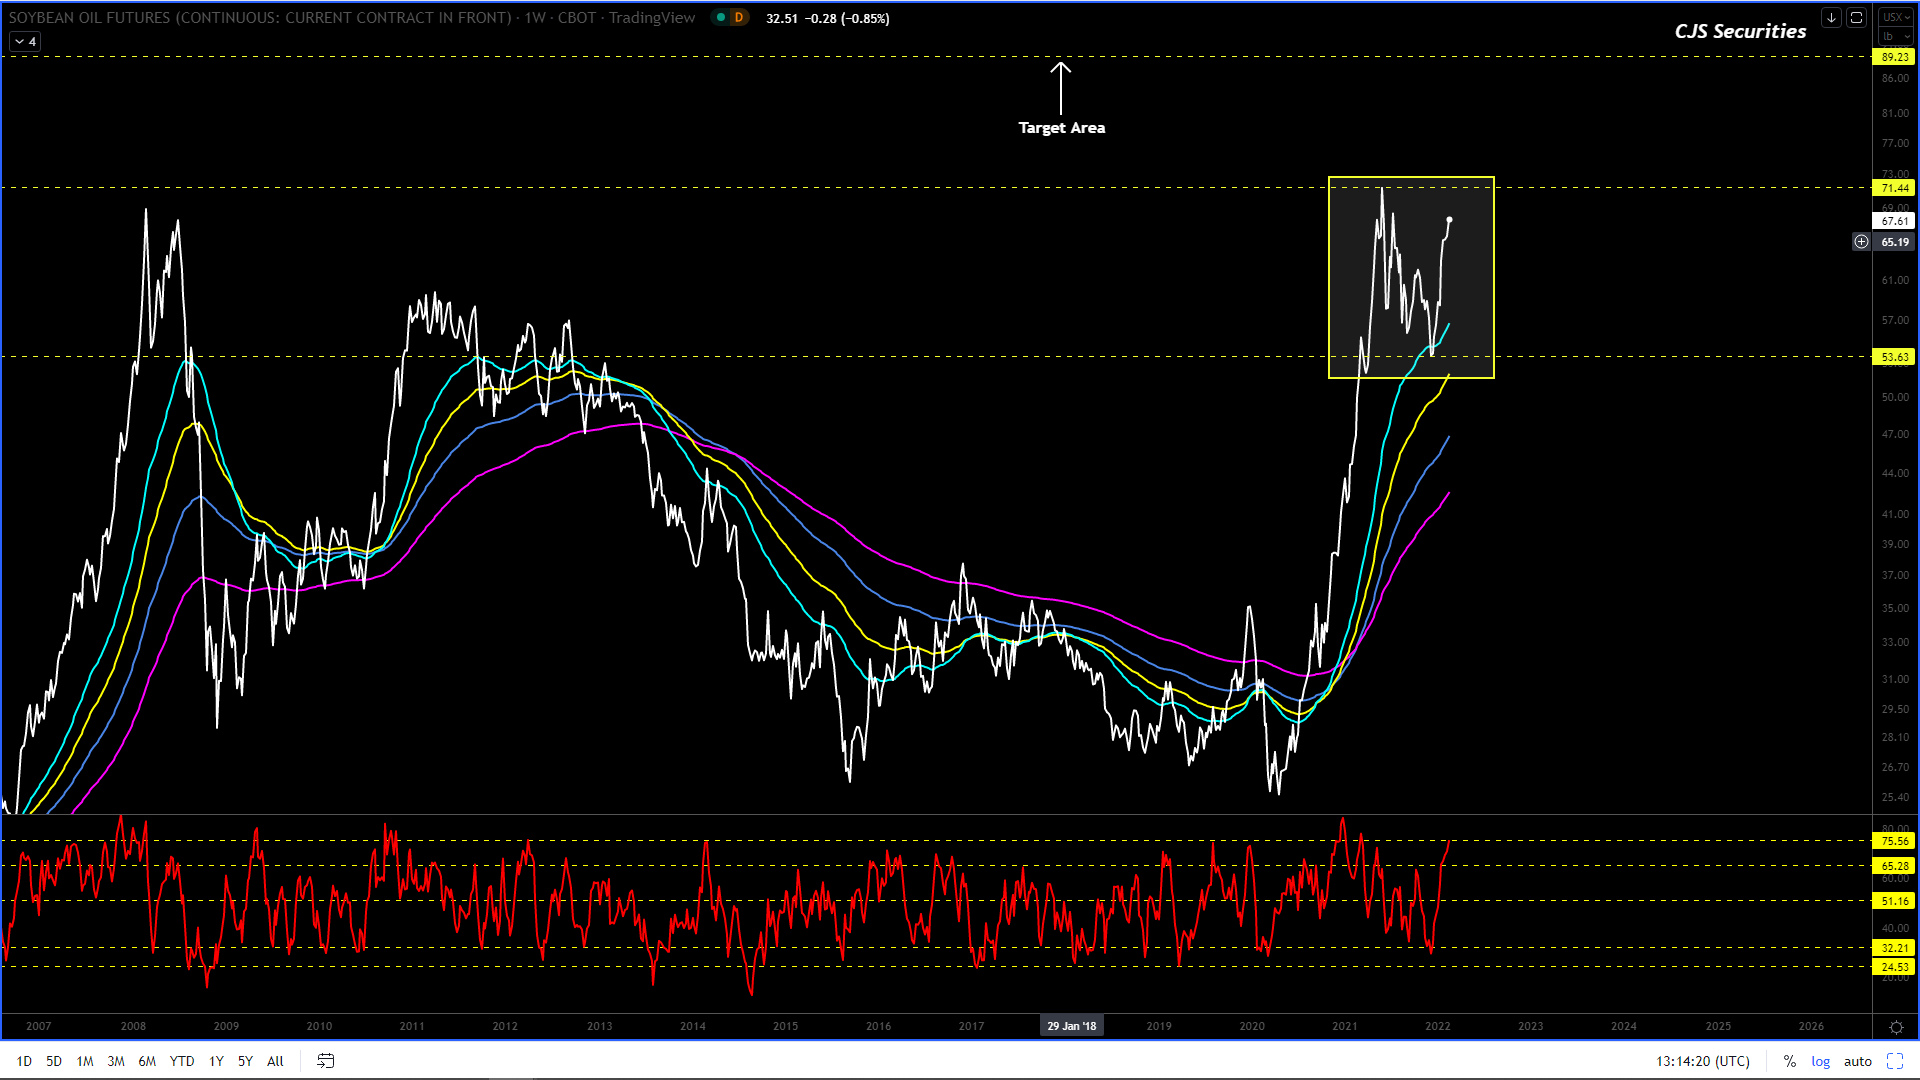
Weekly CBOT Soy Oil Continuous Close
The below has not changed, and we are riding this one into the sunsetas we are winning! – (unfortunately, this is playing out due to WAR)
I seem to have this wrong and although we are long, this chart is now grossly oversold on a weekly basis and we need to dig deep and buy more scale down with a stop under $0.52 as the rally is coming, even if its only a kick!
I feel the correction is done (it had another leg lower), and all the pullbacks from here are buying opportunities with upside targets between $0.85 -$0.89! – the correction was obviously not done.
I almost feel that we don’t have enough cash to get as long as we should, buy at best and scale down, this is budget making stuff with a sprinkling of retirement!!!! – hope we don’t go broke before retiring.
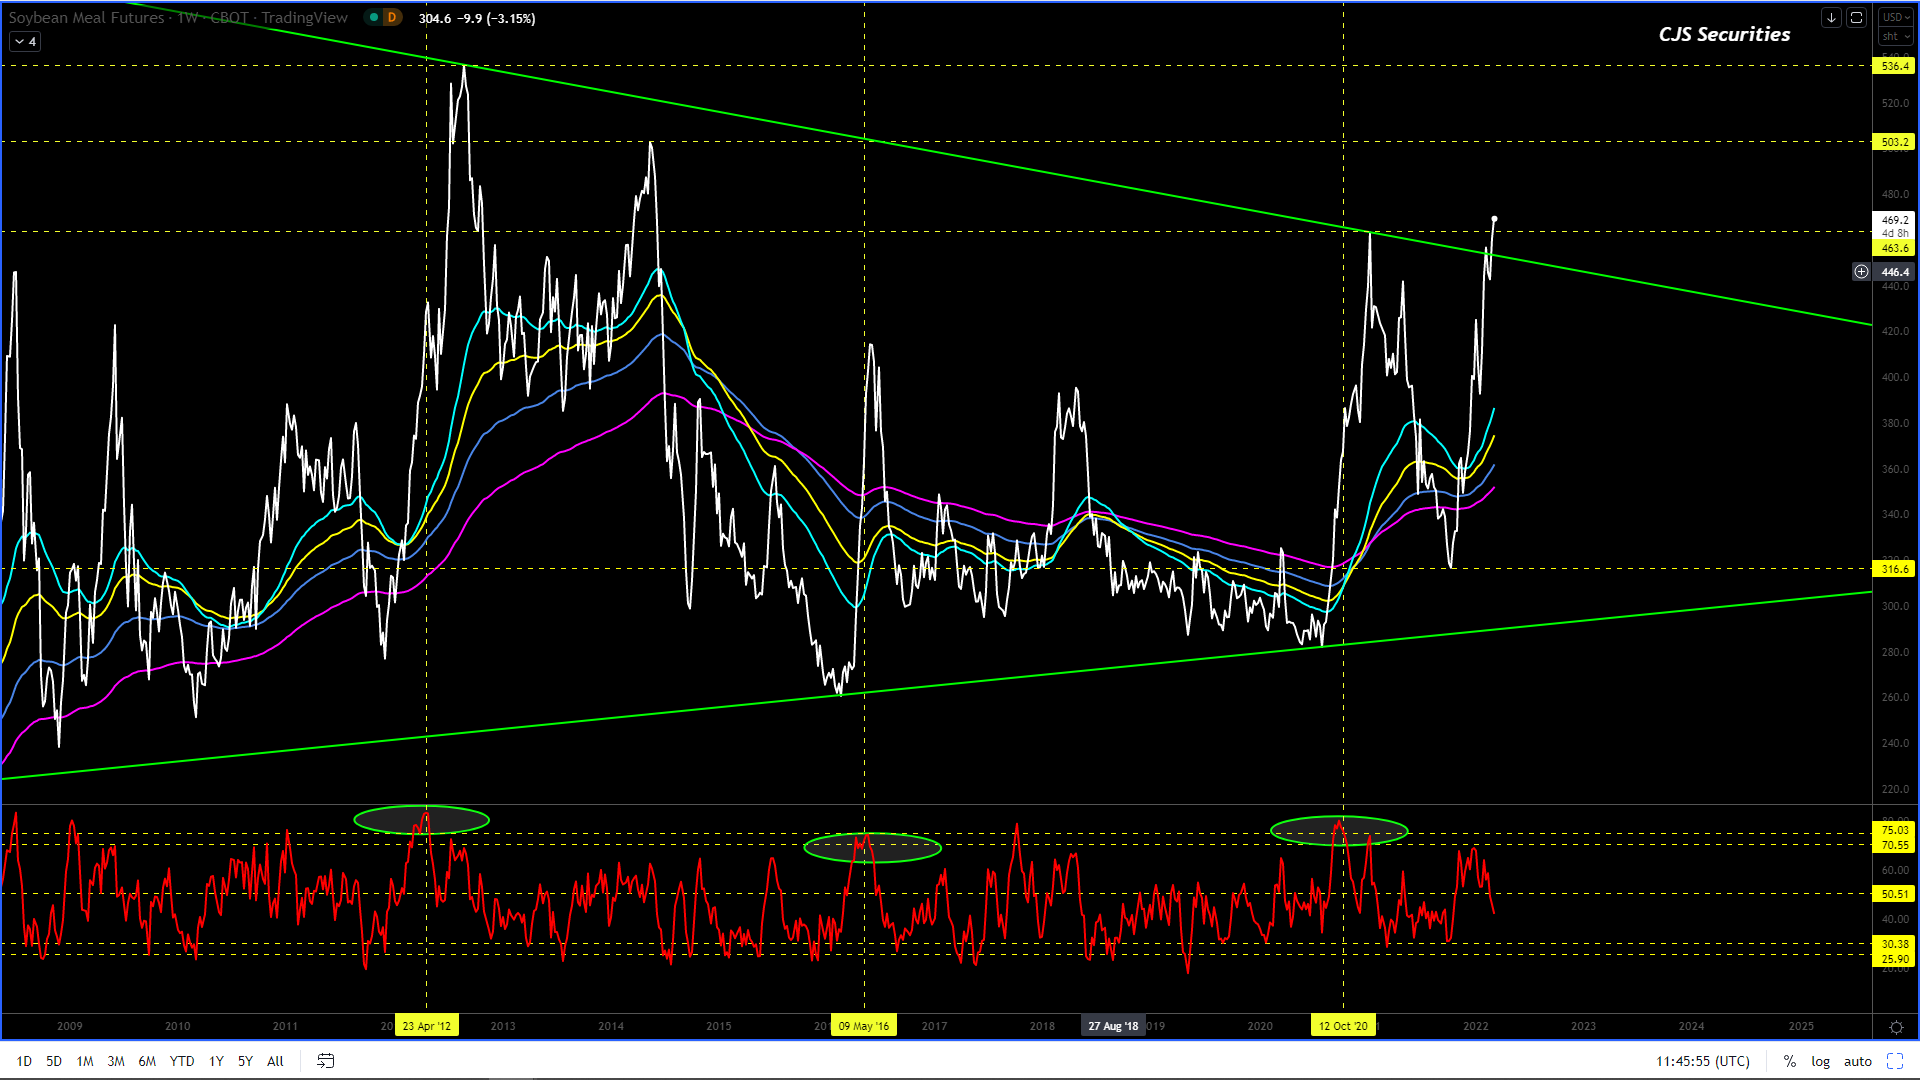
Weekly CBOT SBM Continuous Close
Nothing
has changed on the weekly chart, but we are happy to stay out until further
notice.
This
chart, however, could quickly rally from here!
I was wrong on a mammoth scale, and the Black Swan of WAR seems to have ended many a player.
Being wrong is nothing compared to what the people being affected by this war are experiencing, so with that in mind, let us hope for everyone’s sake this conflict ends soon.
I am not willing to make a call on any of these charts.
240 Min March 22 Corn Candle Chart Close
Again thank goodness for stop losses.
Technically this chart is now so 50/50, and hence I am happy to sit out until the dust has settled.
Weekly WM Continuous Close
Another chart I have had utterly wrong due to the Black Swan of WAR.
I have no strong views other than to urge producers to price as anything can happen.
Weekly YM Continuous Close
Another chart I have had entirely wrong due to the Black Swan of WAR.
I have no strong views other than to urge producers to price as anything can happen.
Weekly KC Wheat Continuous Close
Firstly well done to all that had long positions.
I have never felt so bad about being so right, and I will be taking a good few weeks off before retaking any view on these charts
Weekly Chicago SRW Wheat Continuous
Firstly well done to all that had long positions.
I have never felt so bad about being so right, and I will be taking a good few weeks off before retaking any view on these charts.
Daily Close KC Wheat v Chicago SRW Continuous Close
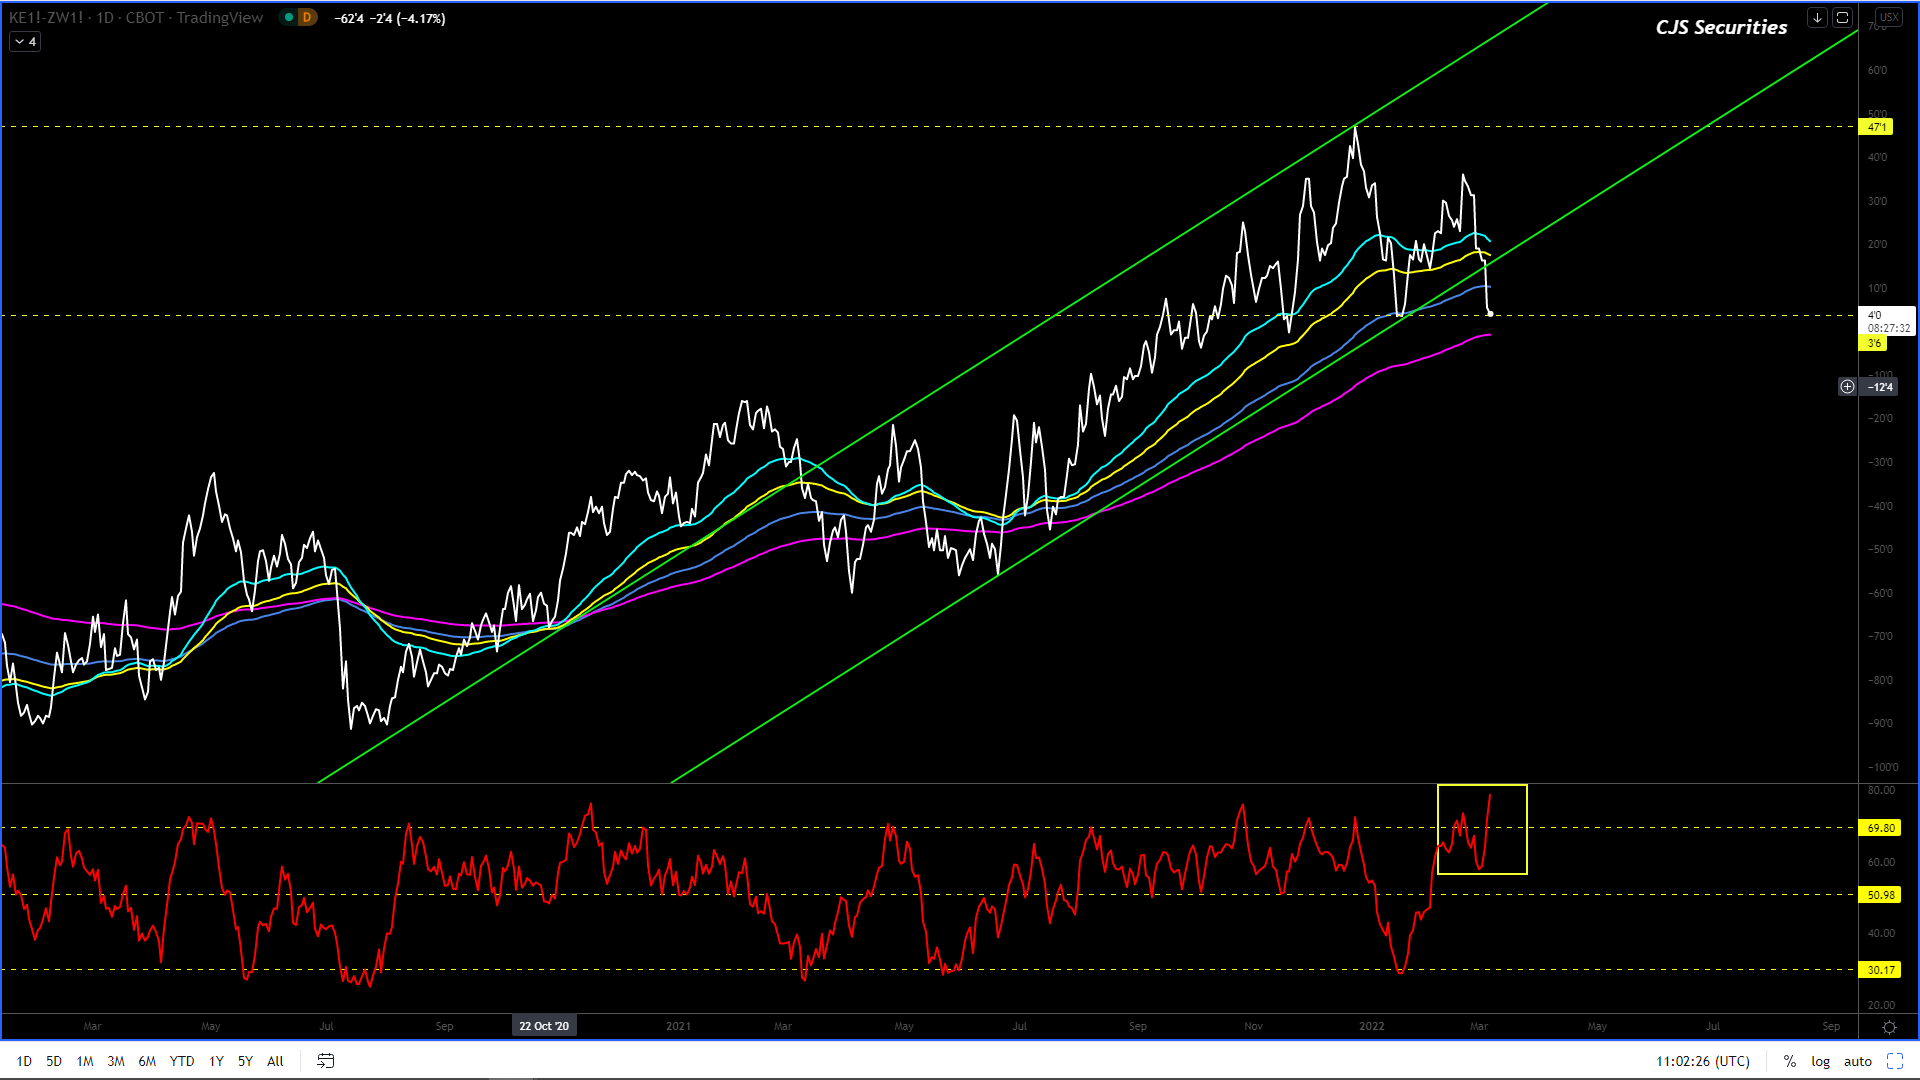
We will take profit on the below.
Selling the rally over $0.30 has me sweating and the only thing helping me keep it together right now is that market is grossly overbought. – Great trade
Weekly SAF Wheat Continuous Close
Firstly well done to all that had long positions.
I have never felt so bad about being so right, and I will be taking a good few weeks off before retaking any view on these charts.
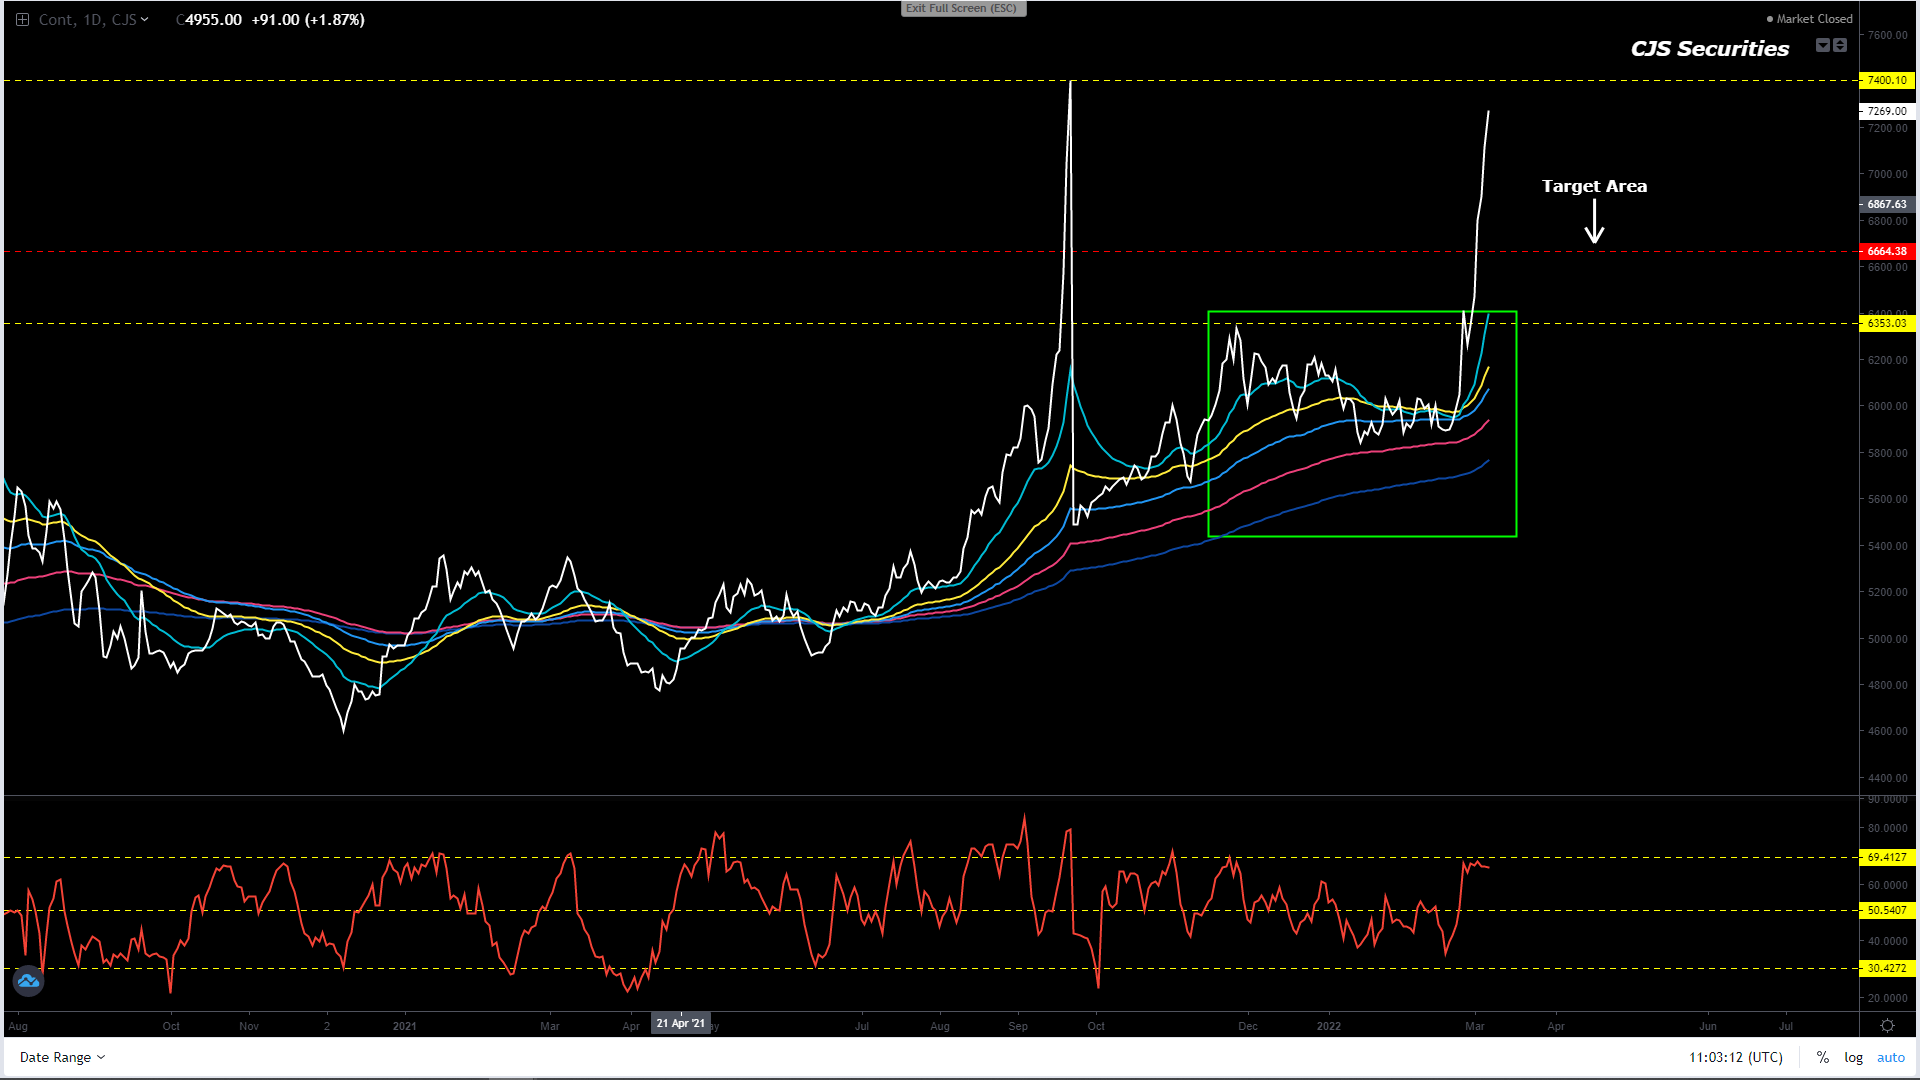
Daily Matif Wheat Continuous Close
We will sell out ASAP.
I am starting to like what I see, and I am now a buyer of this chart with a stop under €260.00.– lucky to have been long.
I have never felt so bad about being so right, and I will be taking a good few weeks off before retaking any view on these charts.
The last time this report was sent, WAR had not yet broken out.
I want to spare a thought for all the people that have been affected and displaced at this time.
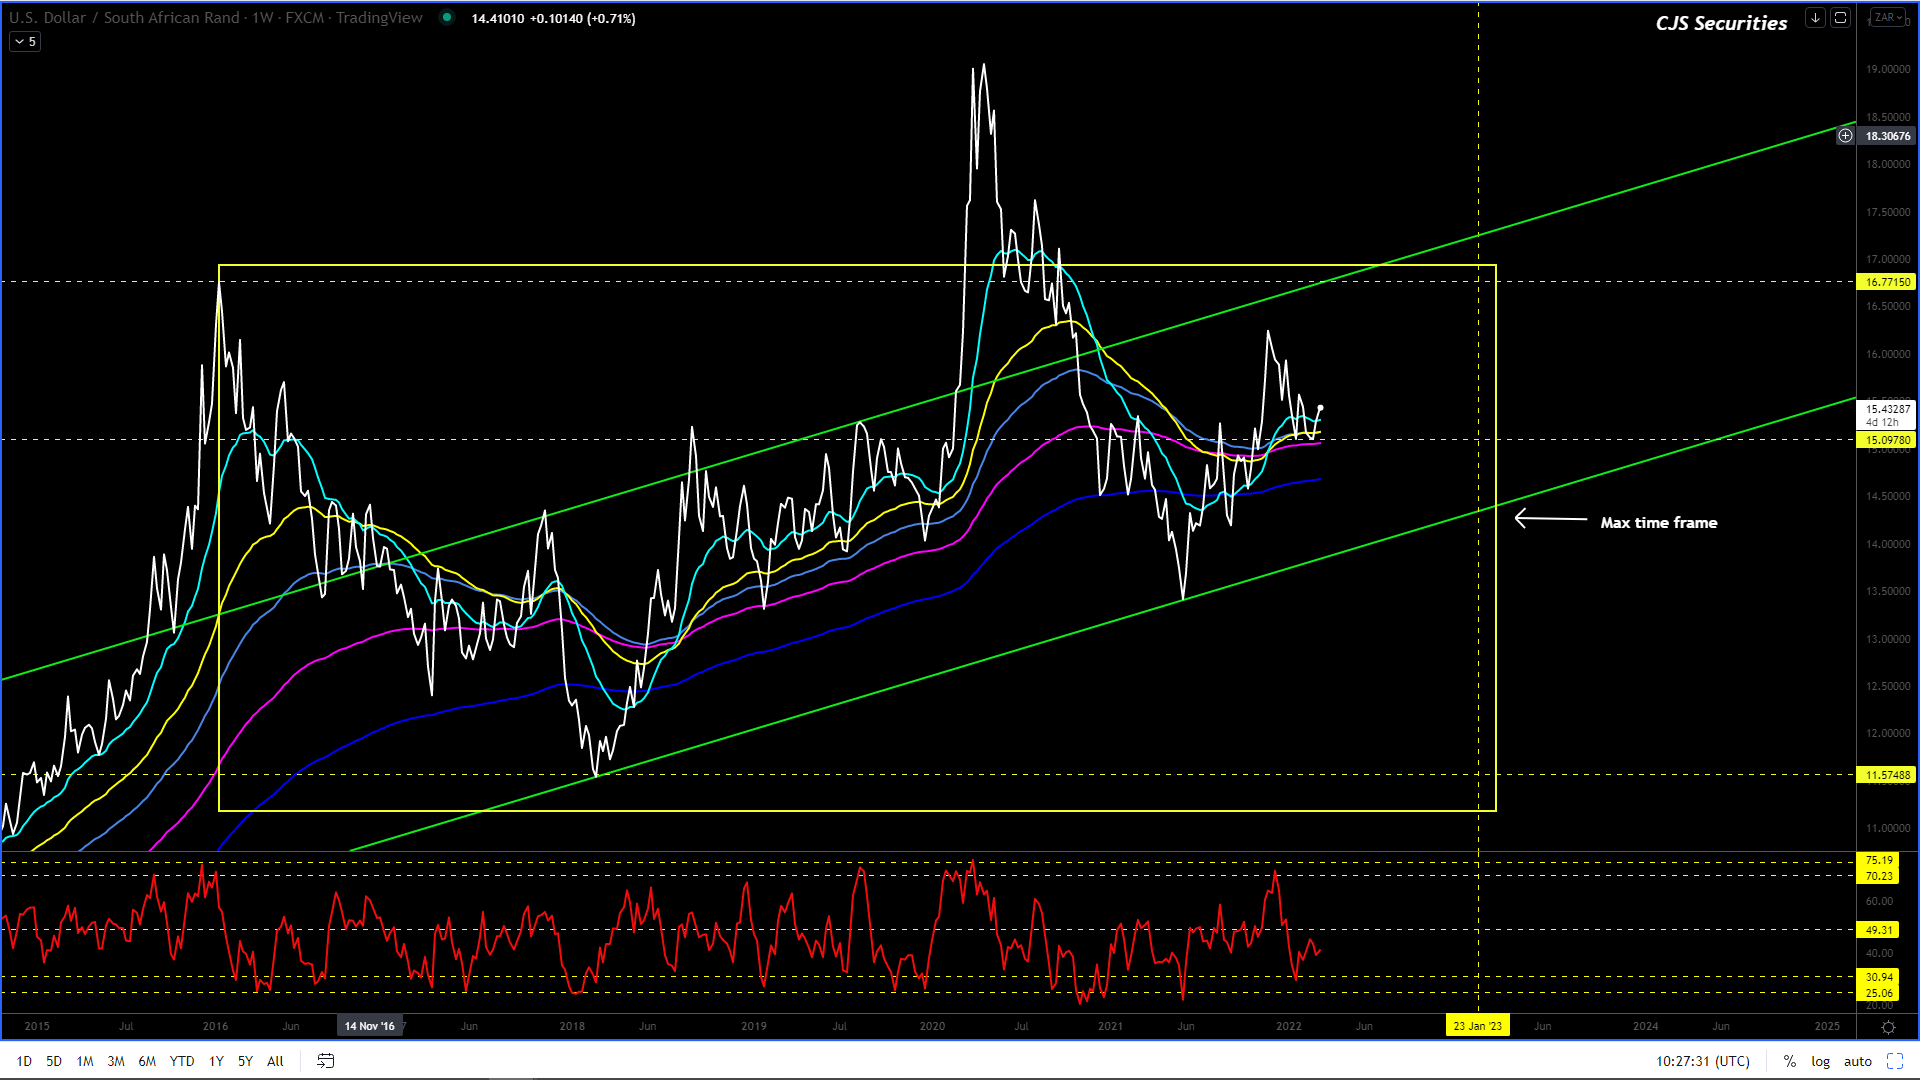
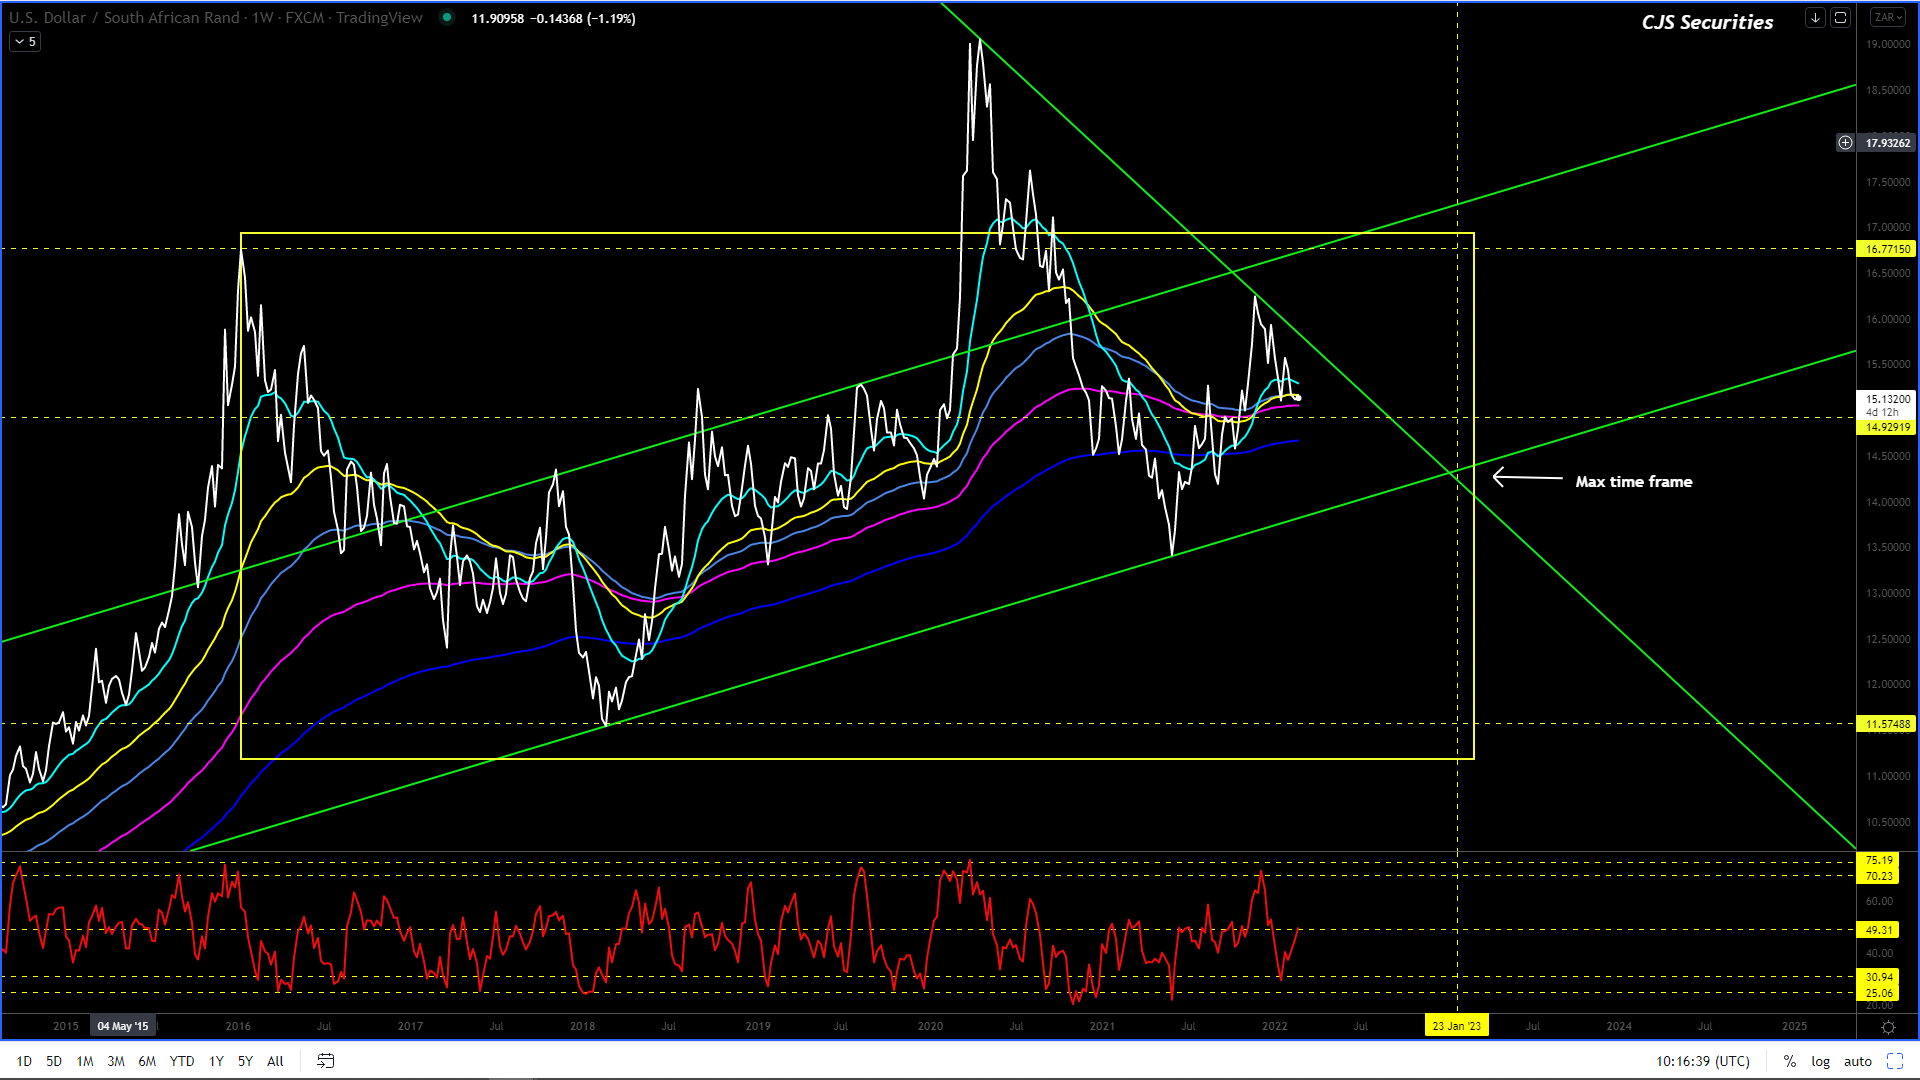
I still see the below taking place over time.
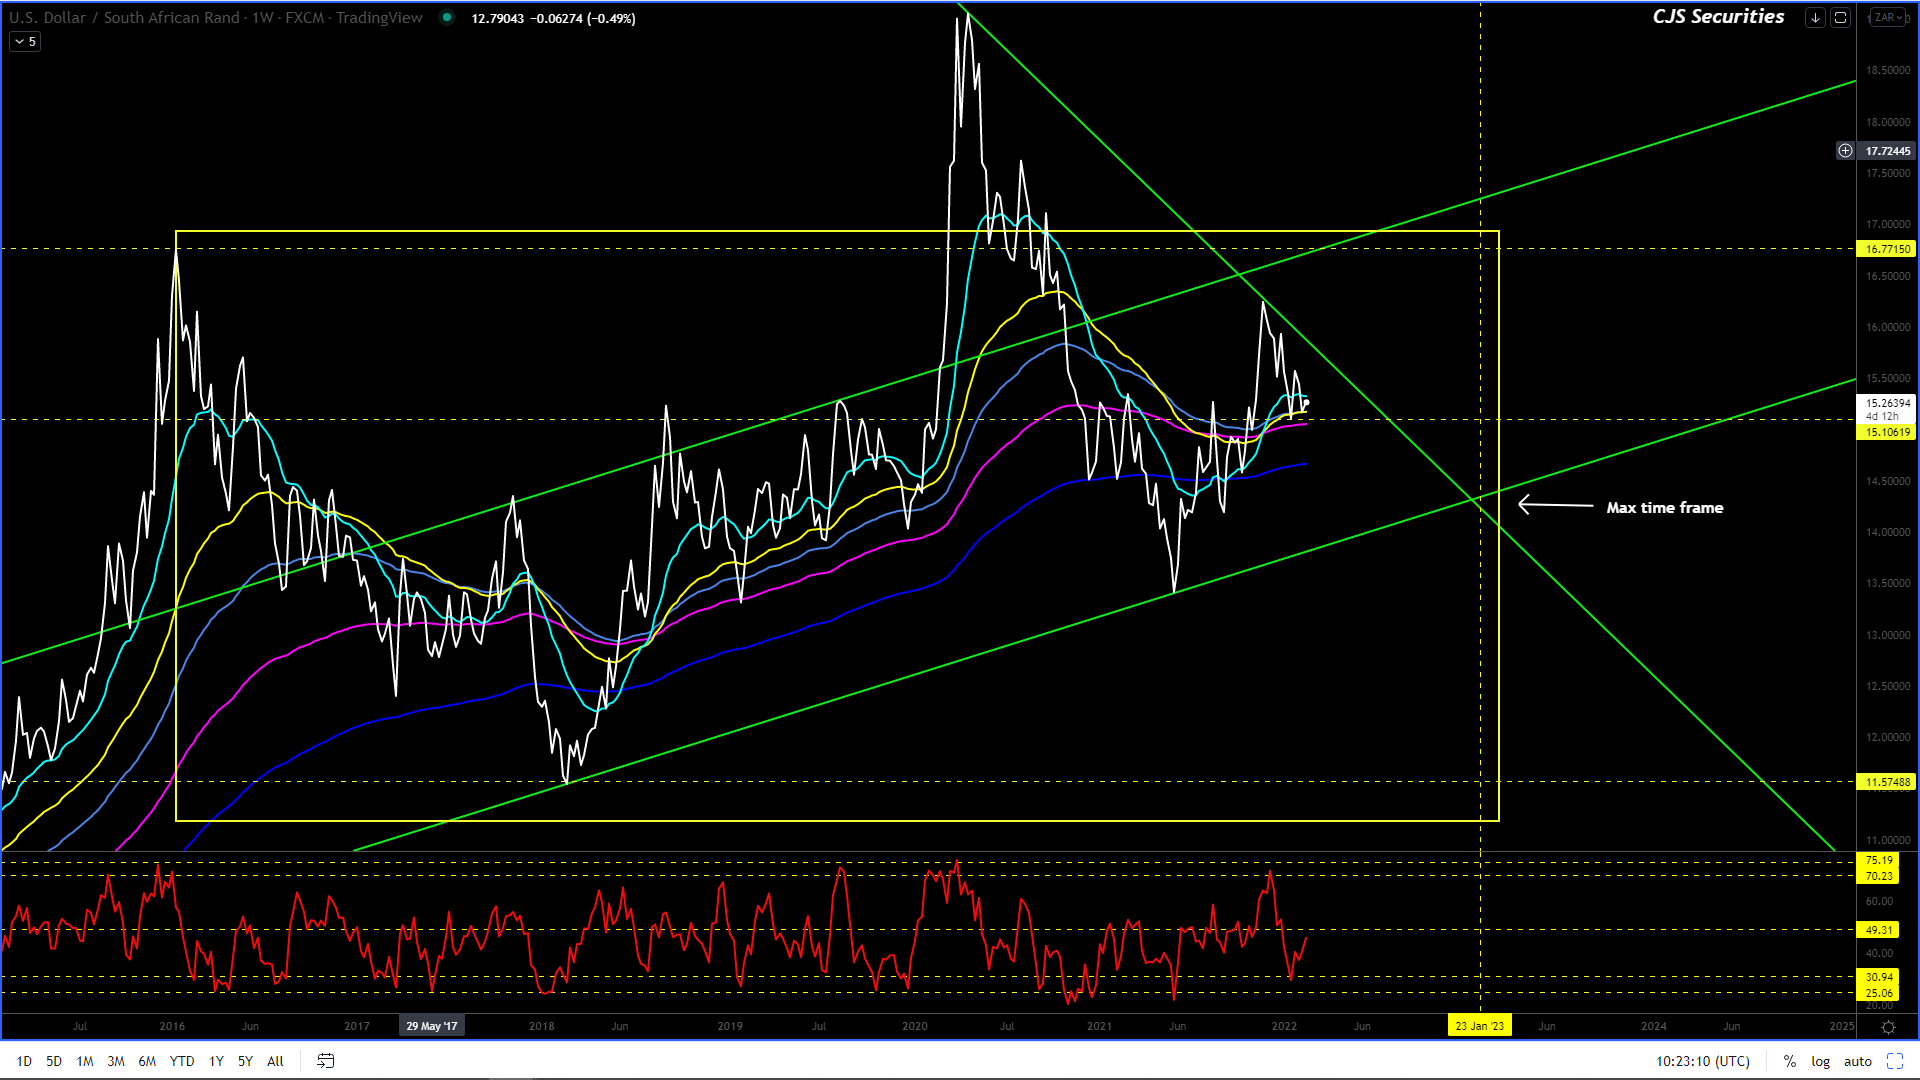
What I see is R11.50 over the next 17 months.
I am convinced that the ZAR is in a multi-year corrective phase vs. the USD and that from today on, all upward spikes on this chart are well worth a short!
This chart could easily have a leg higher and trade toward the R16.77 level in the coming weeks. – I would use this as a USD selling opportunity.
Until then, the range is likely to be R14.88 – R15.50 and I would seriously consider owning the bottom of the range! – hopefully some of you bought the sub R15’s, even as just a ST hedge against war.
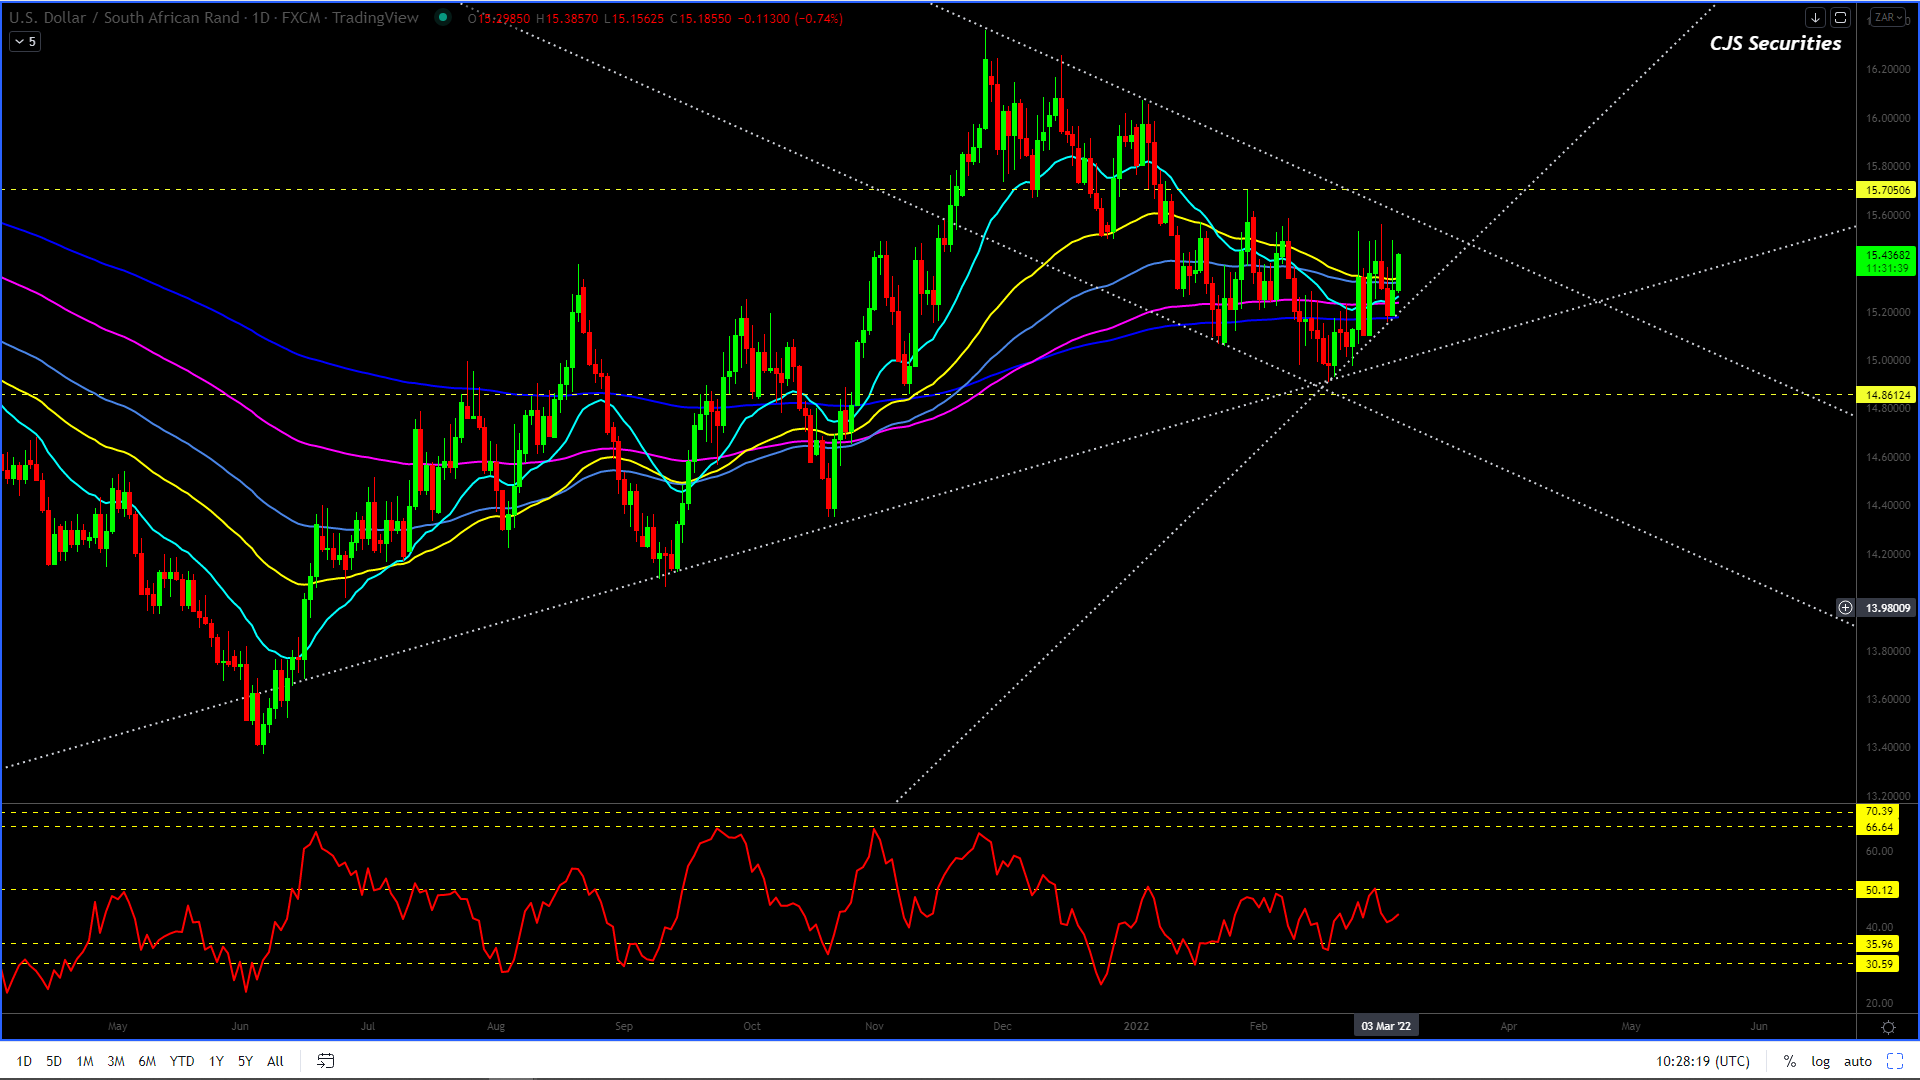
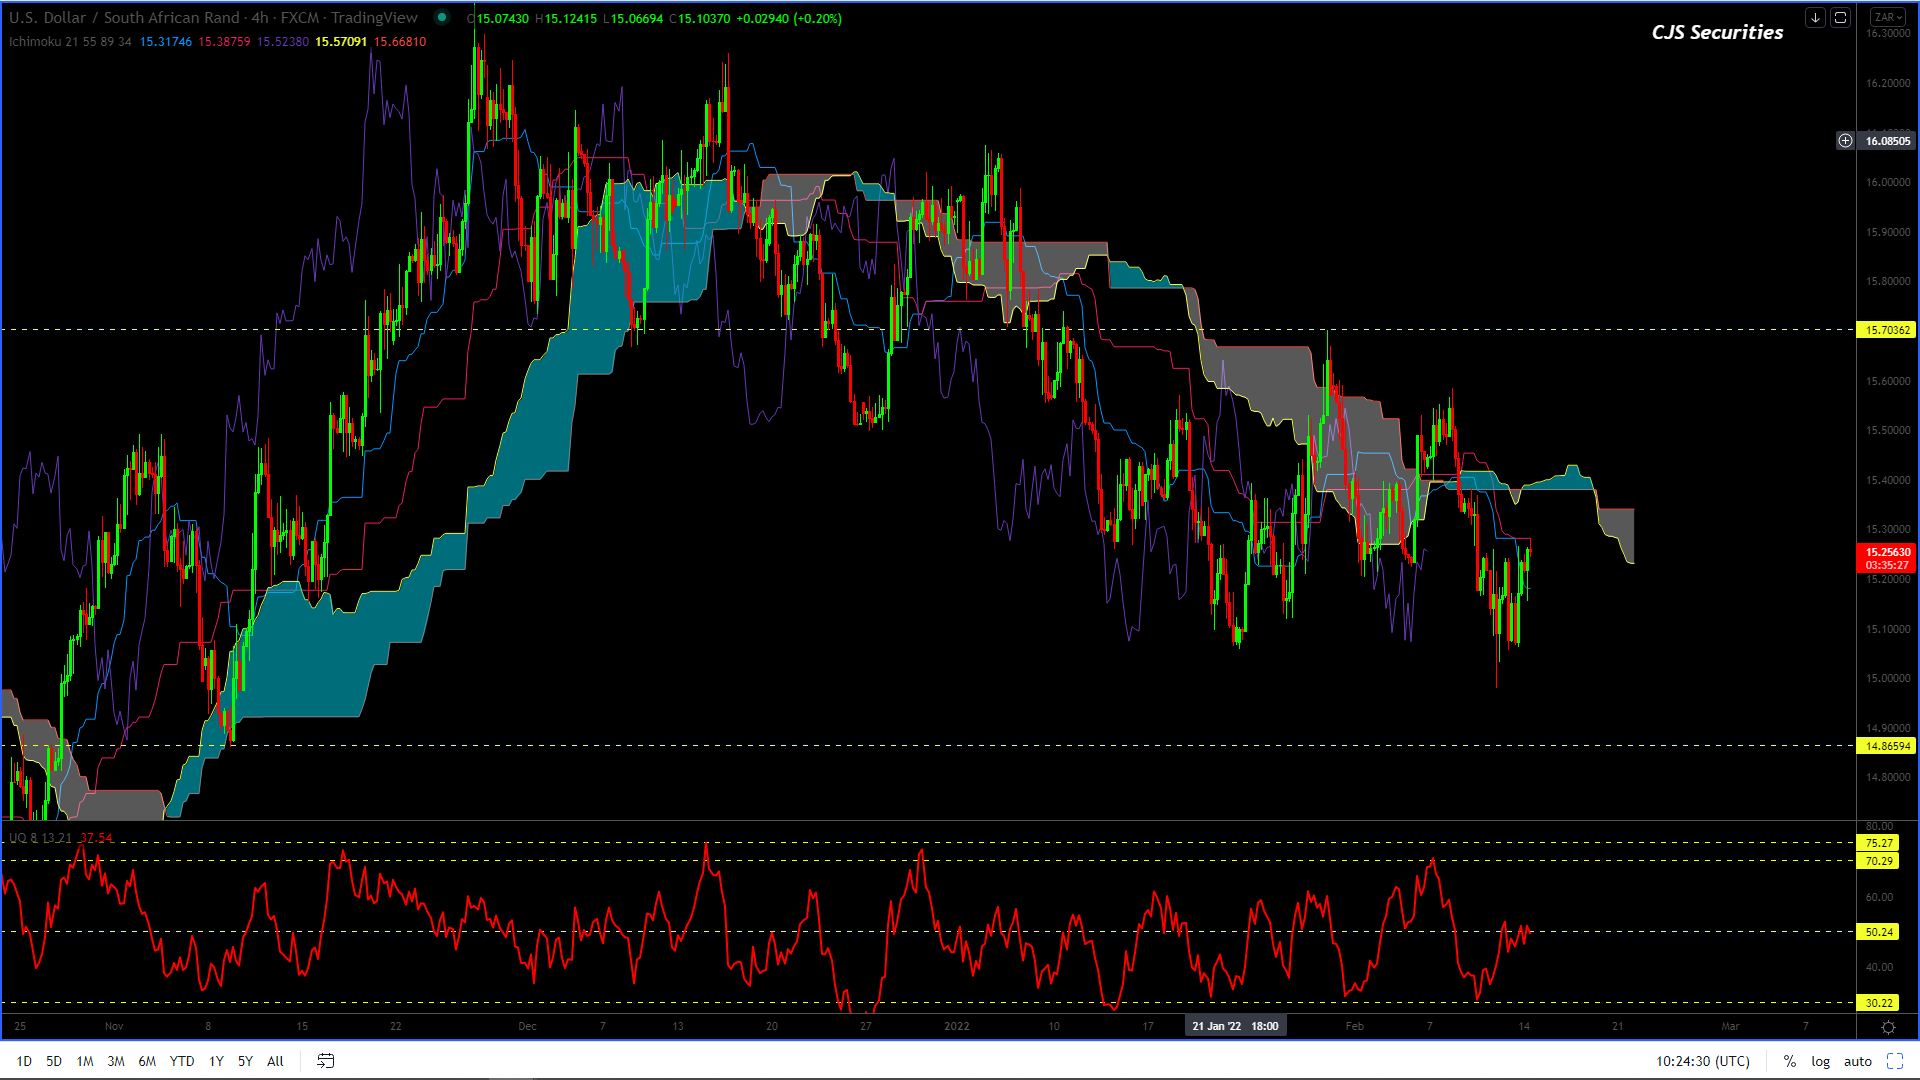
Dollar/Rand Daily Candle
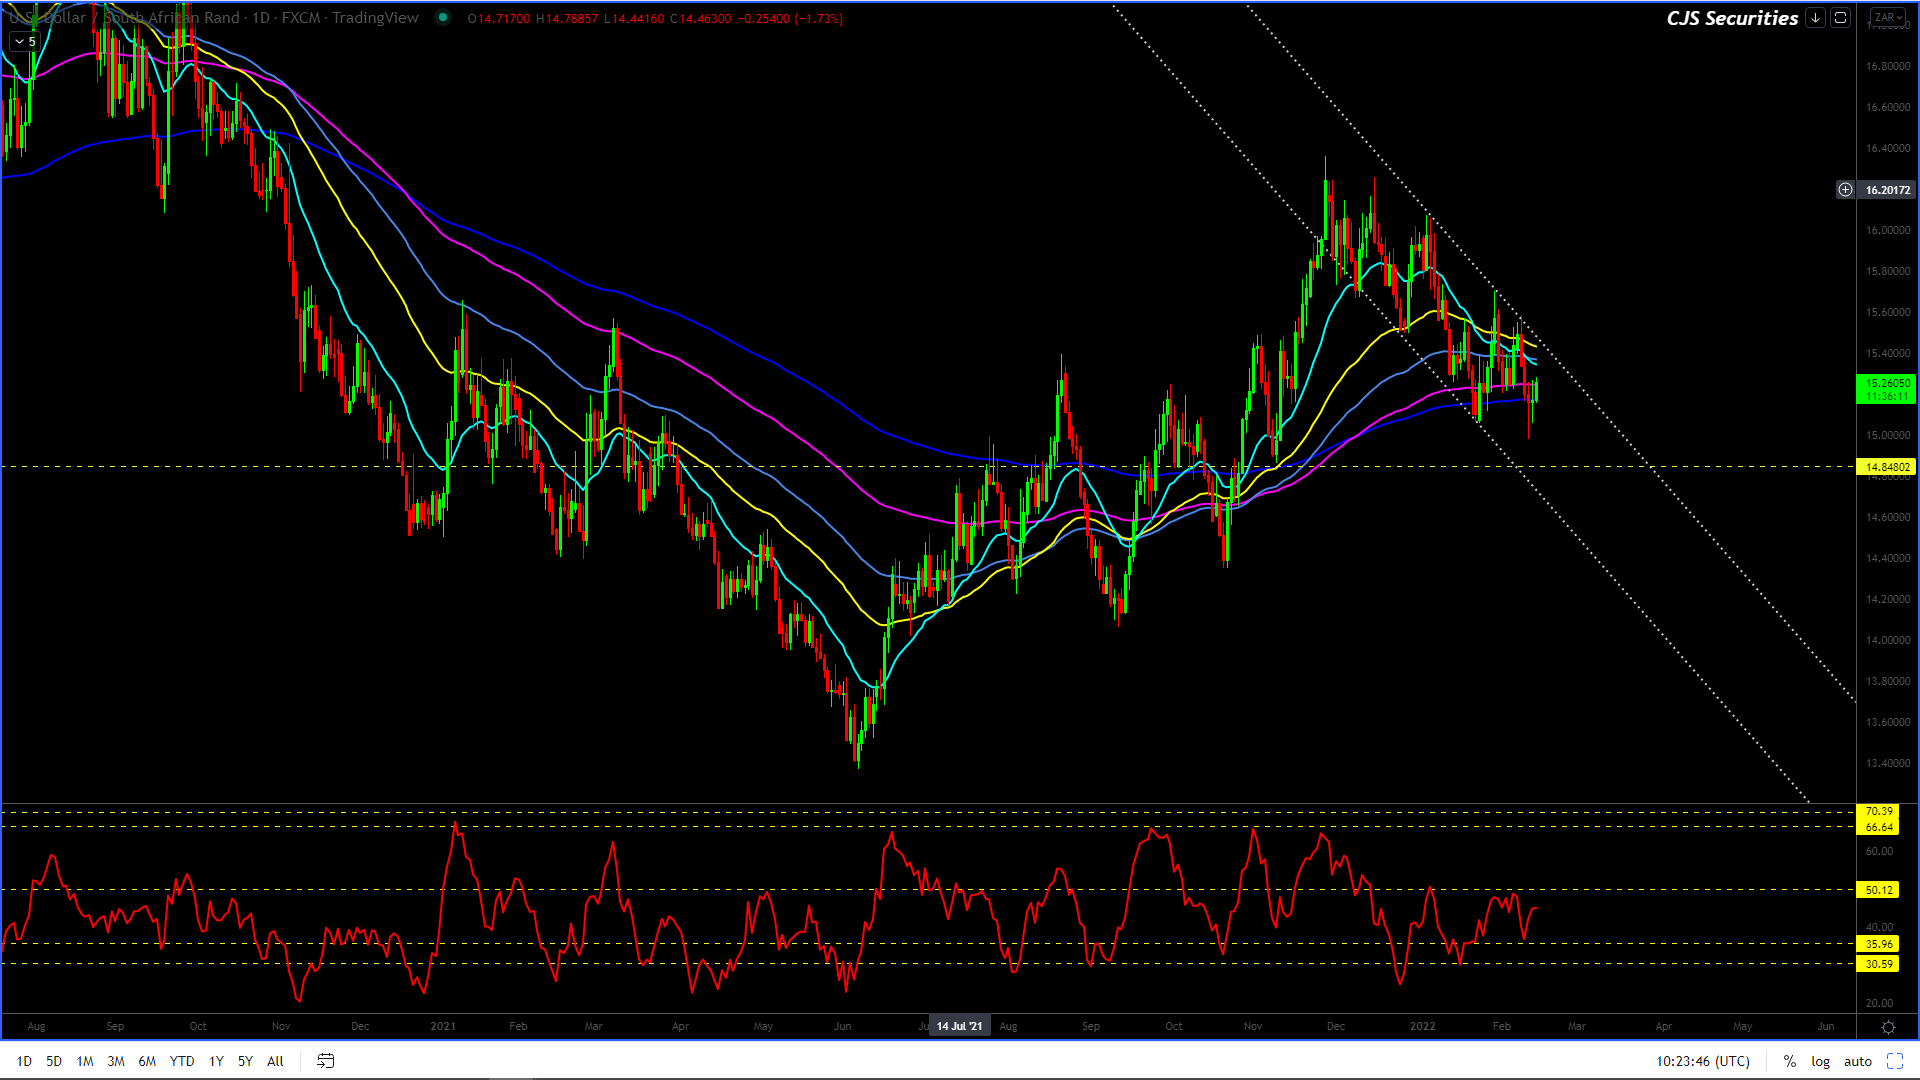
Overall, the chart formation is corrective, needs a leg higher, and fits my weekly view.
I want the last leg higher into the R16’s to complete the chart.
I cannot stress enough how important patience is and keeping your mind clear as emotions are sure to get the better of many this year.
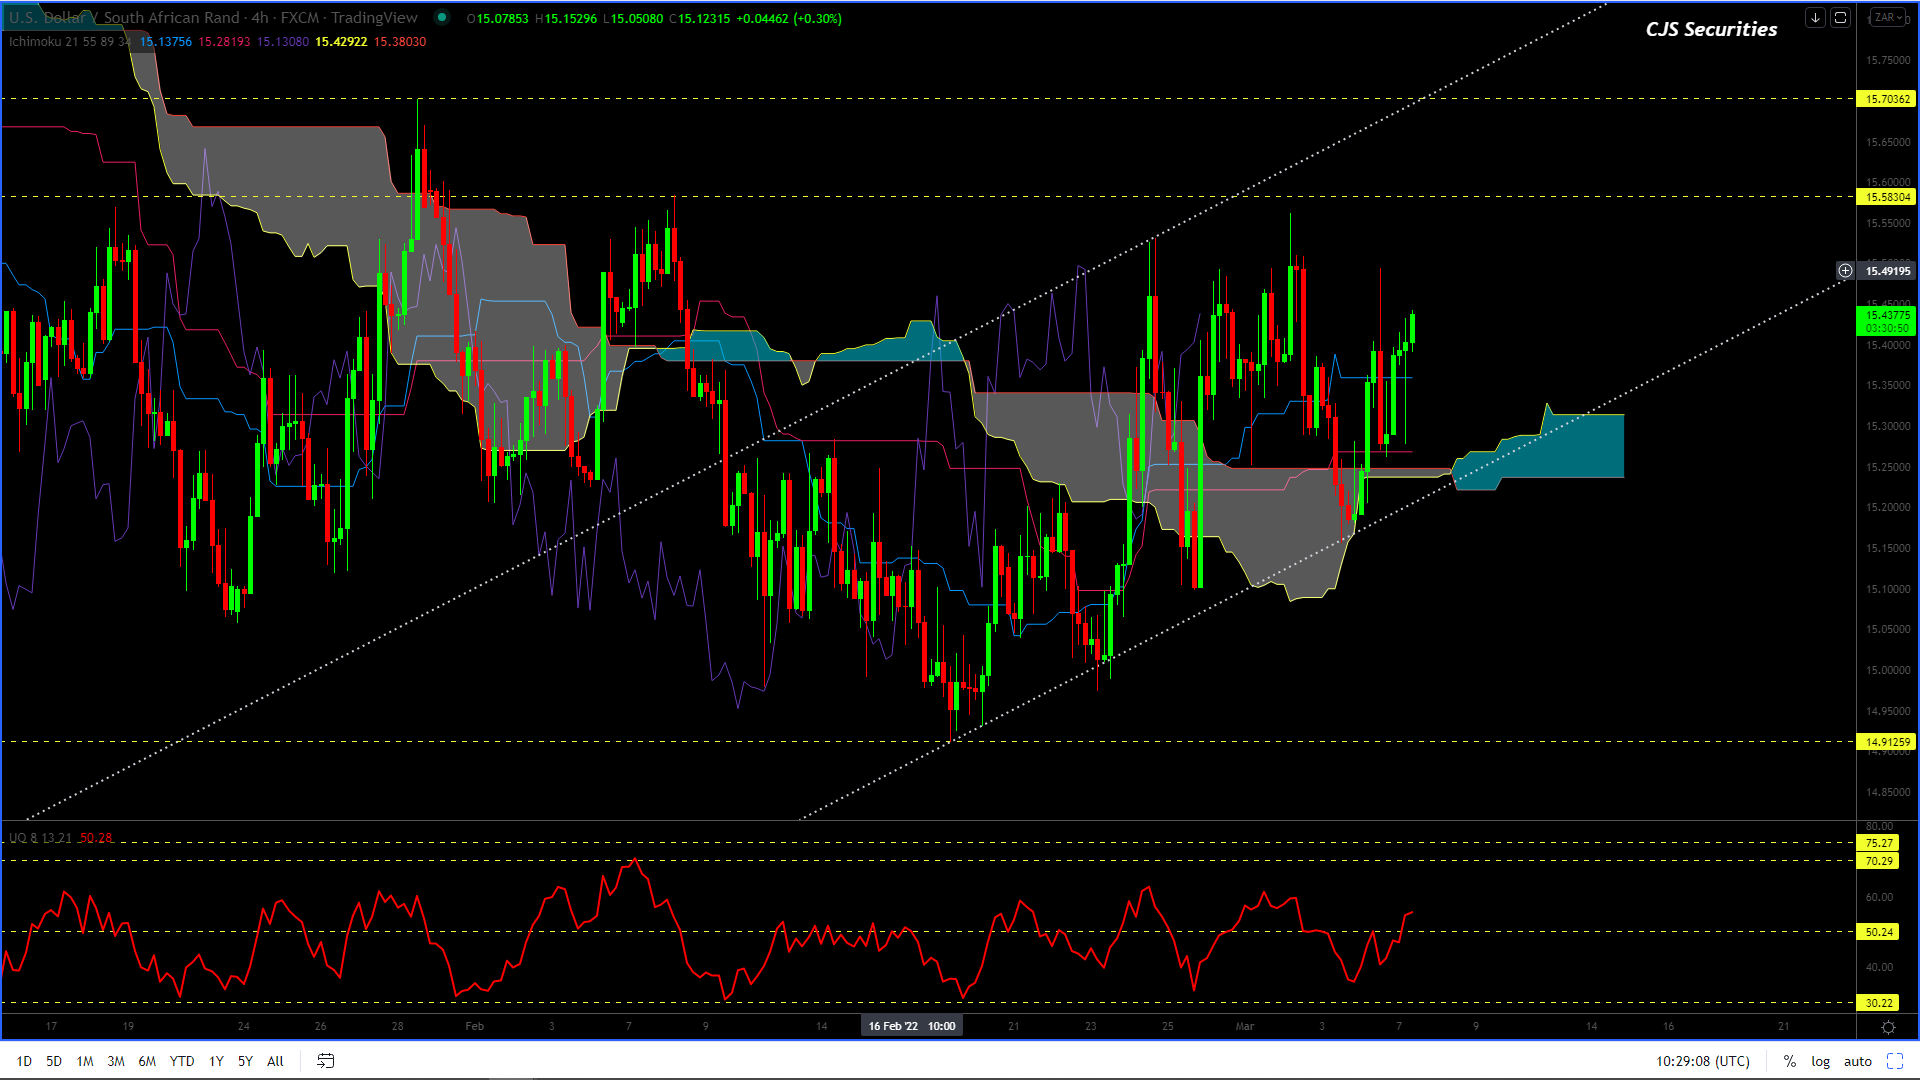
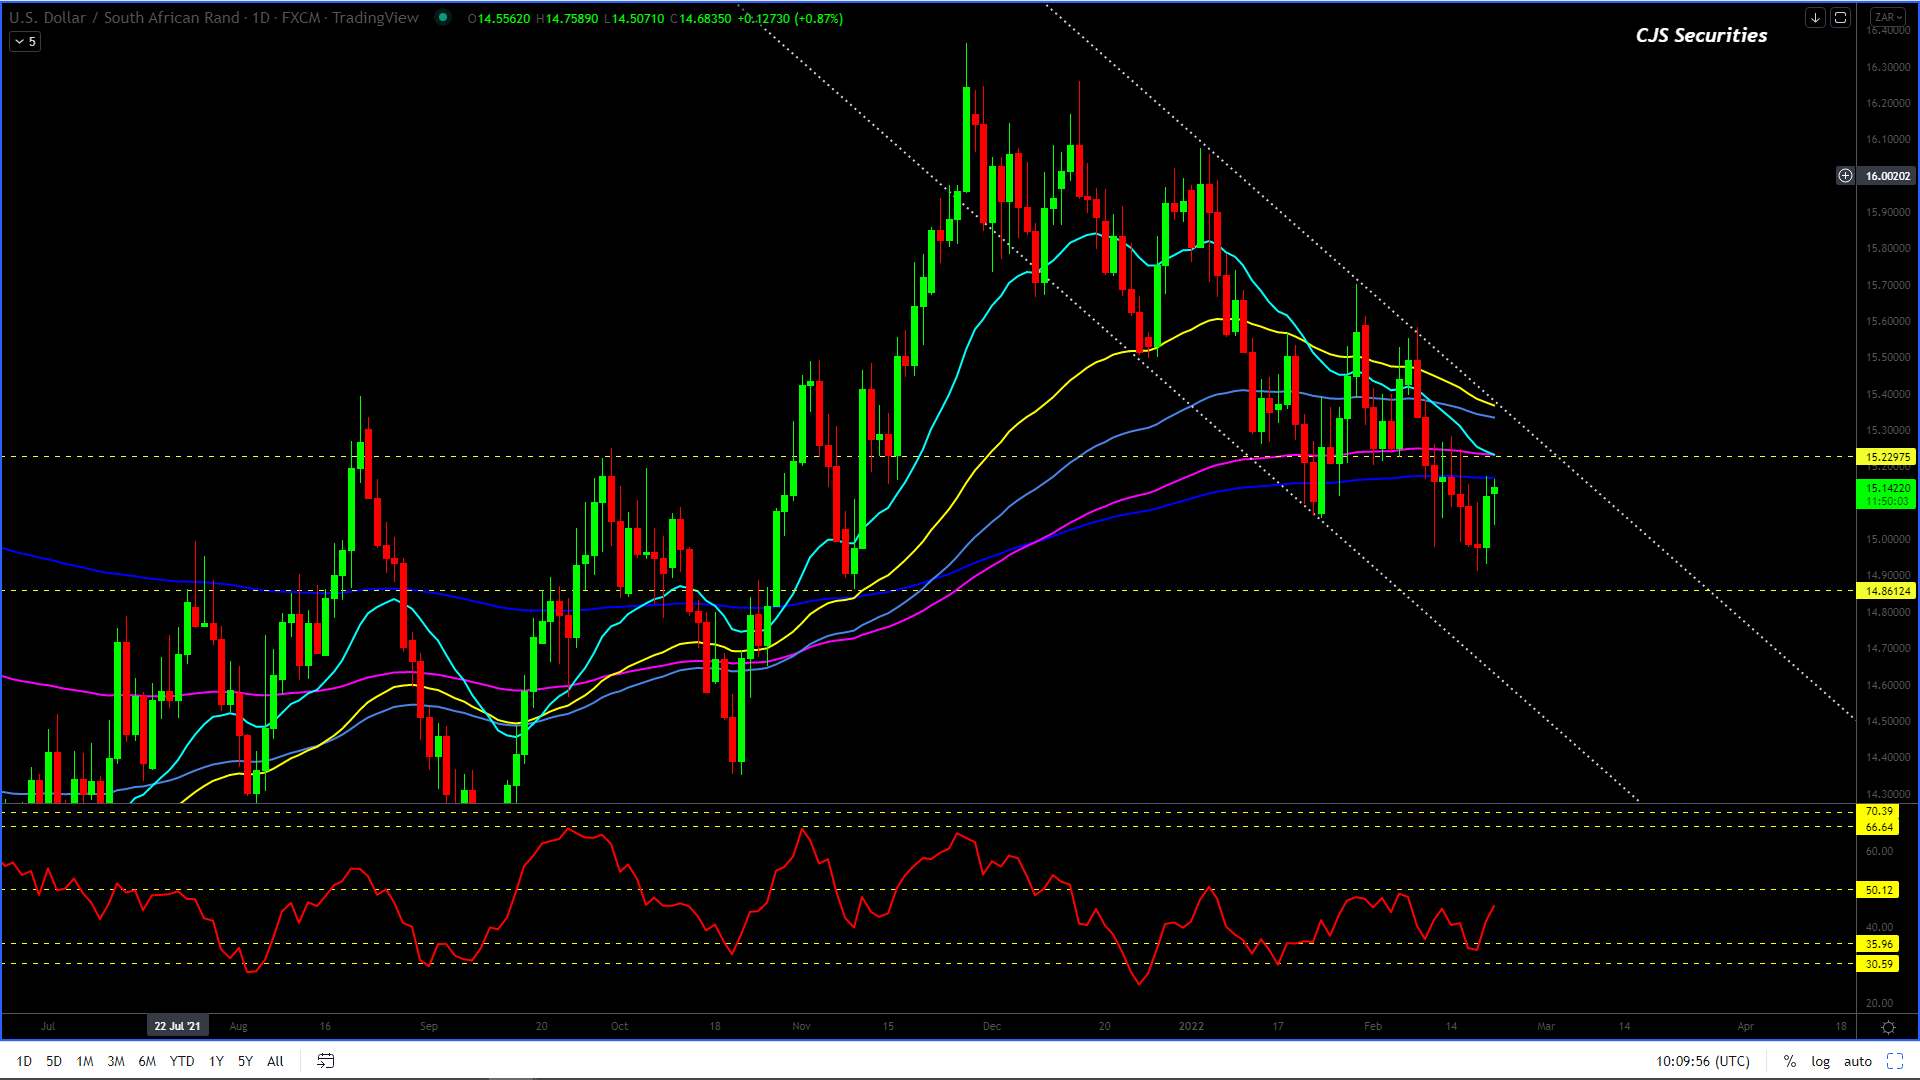
Dollar/Rand 240 min Candle
#No Change in commentary
Currently, there is no decent trade that I can see on an RR basis, as I always require a 3/1 ratio.
However, this chart’s current formation leads me to believe that we will see a trade toward R15.70 and potentially higher.
So, I have decided to get long and stay long until either R15.70 or until I am stopped out through R15.00!– long at R15.22
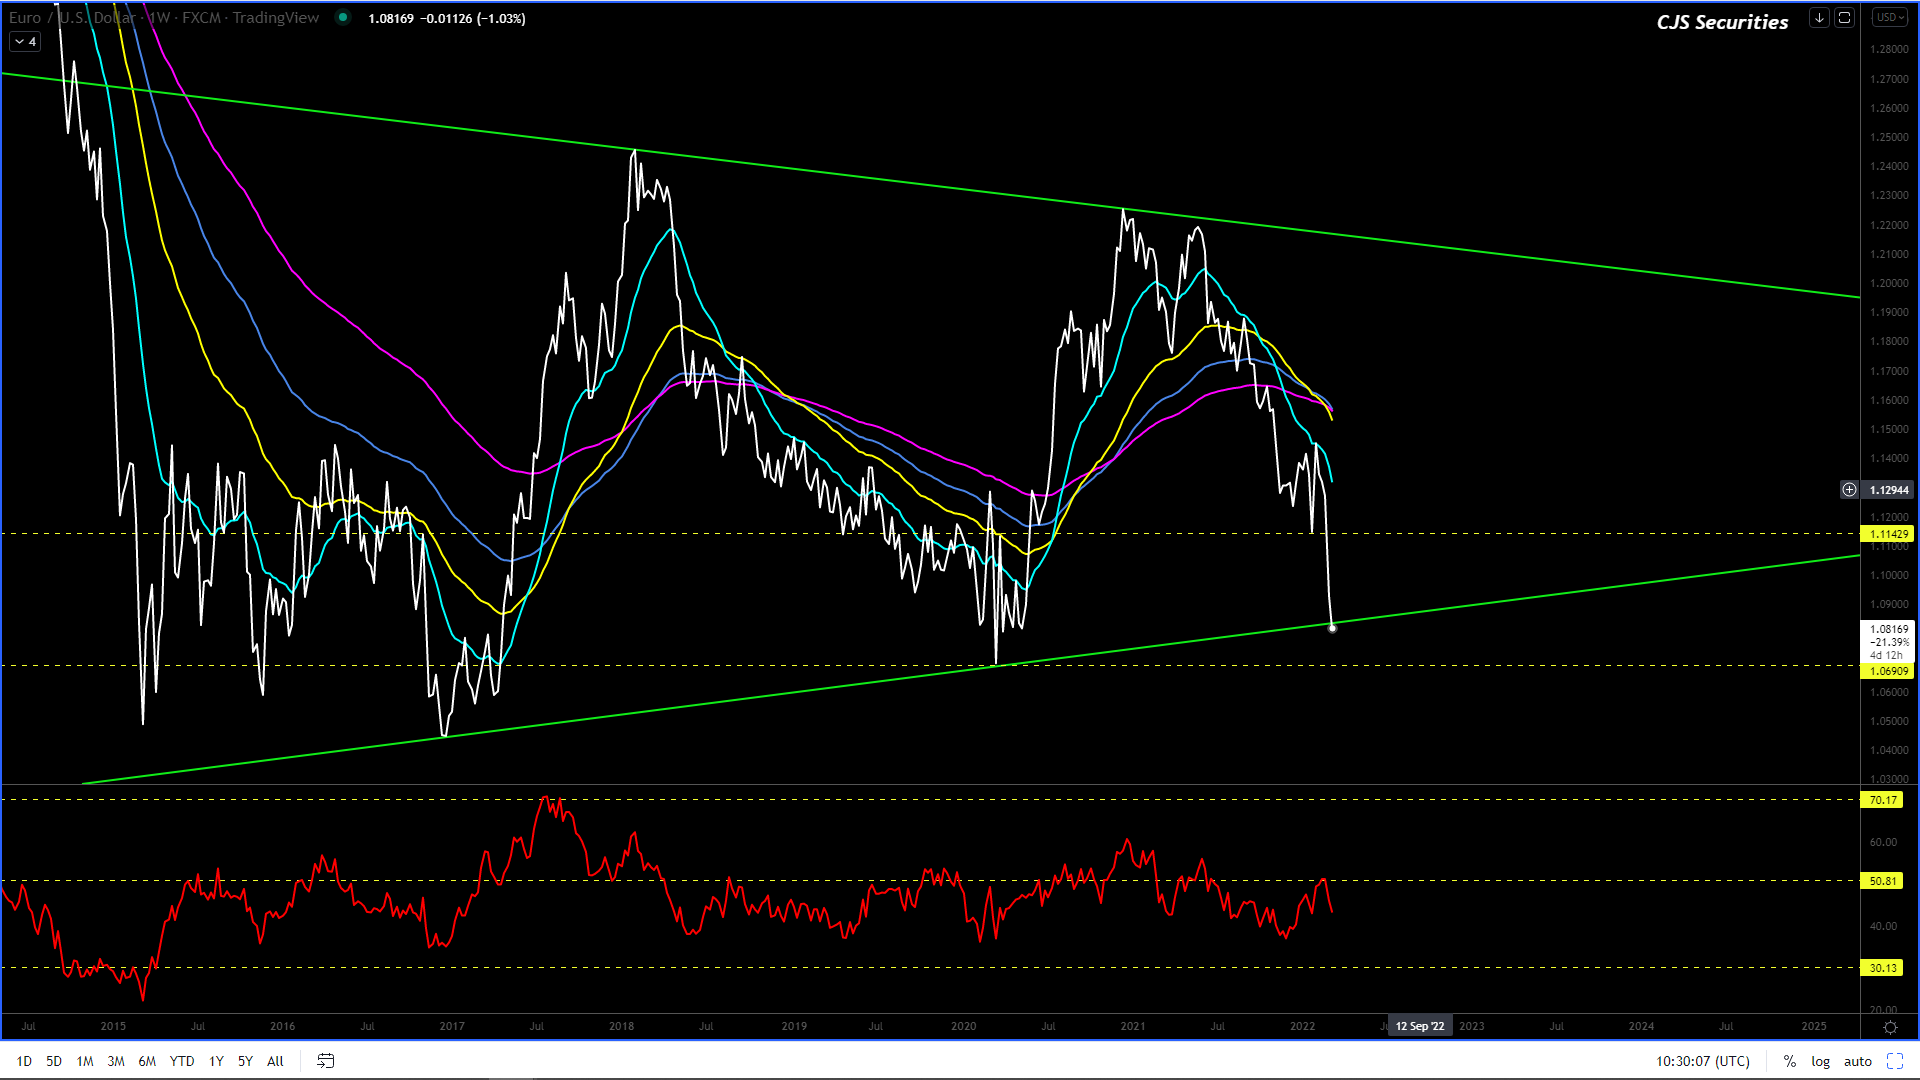
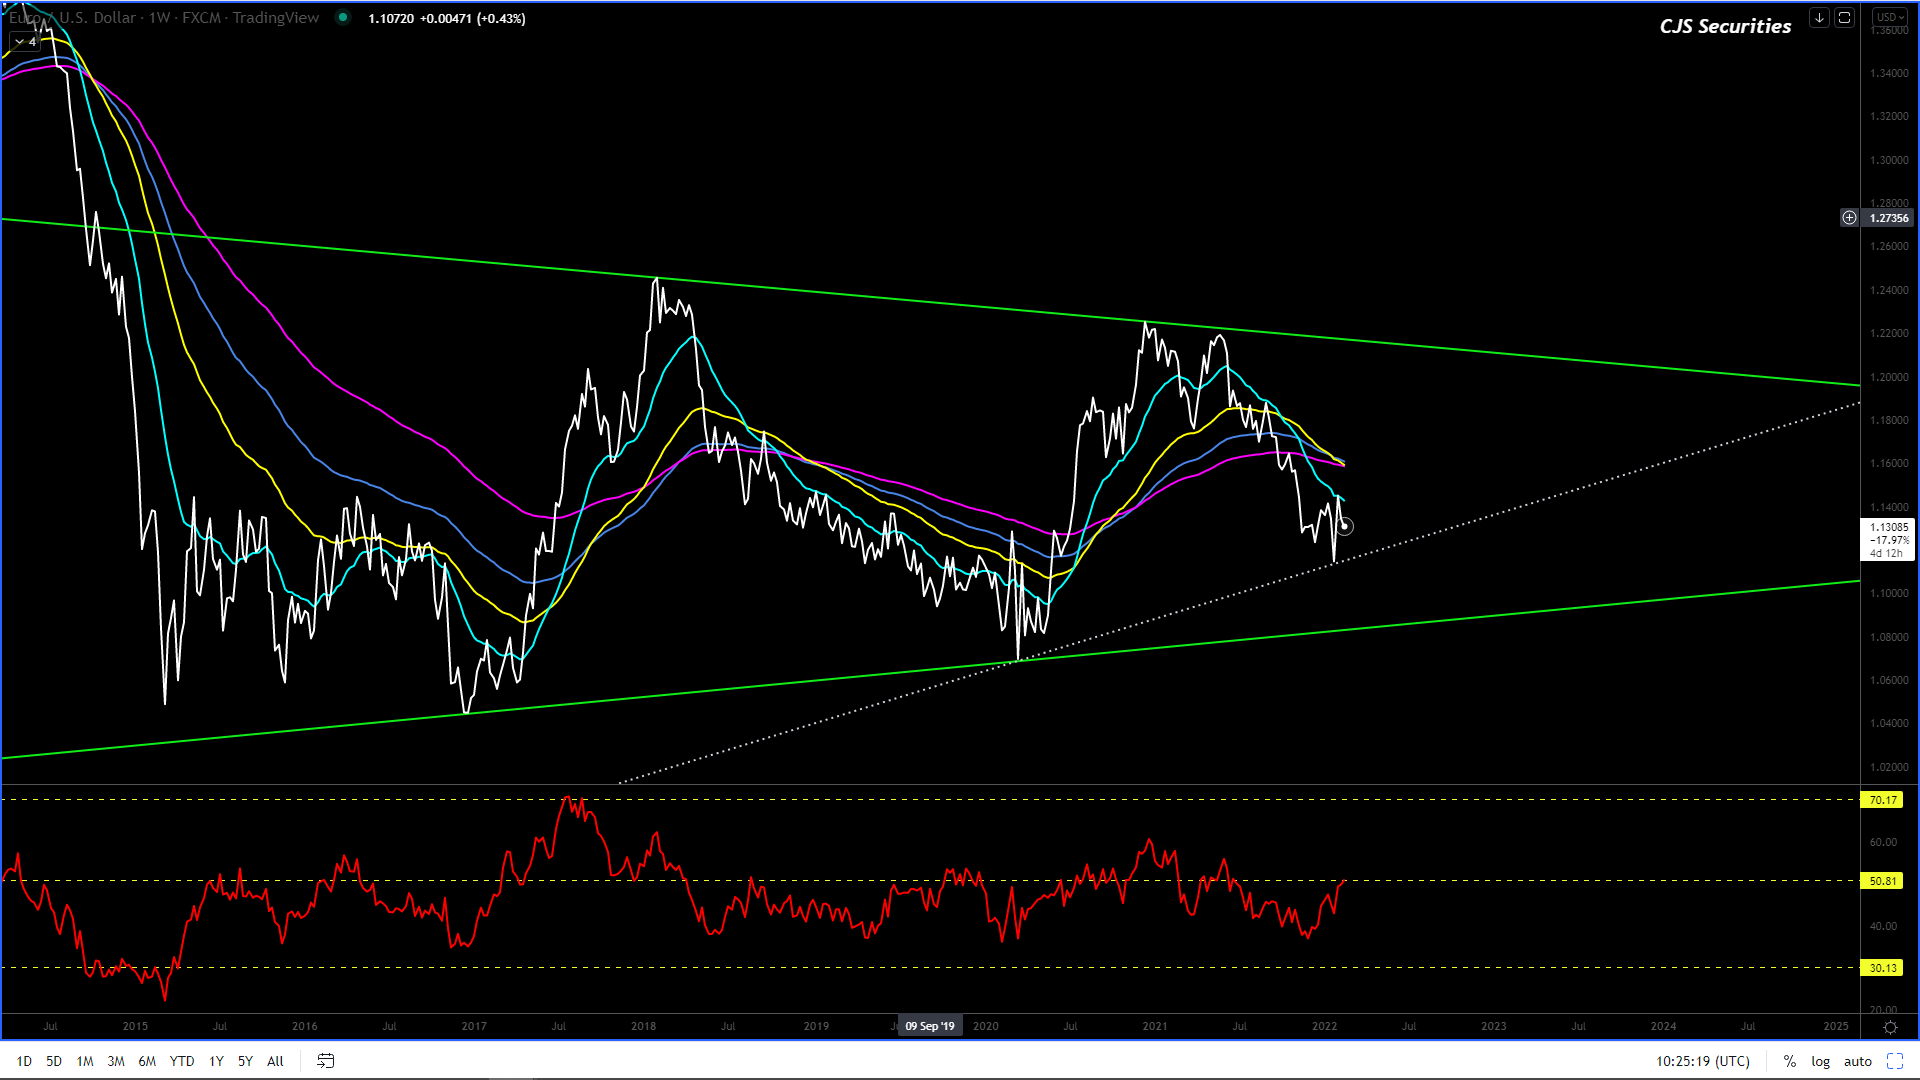
Euro/USD Weekly Close
All bets are off.
The Black Swan that is WAR has taken over, and I will need this chart to play out over the next few weeks before remotely thinking about taking a view.
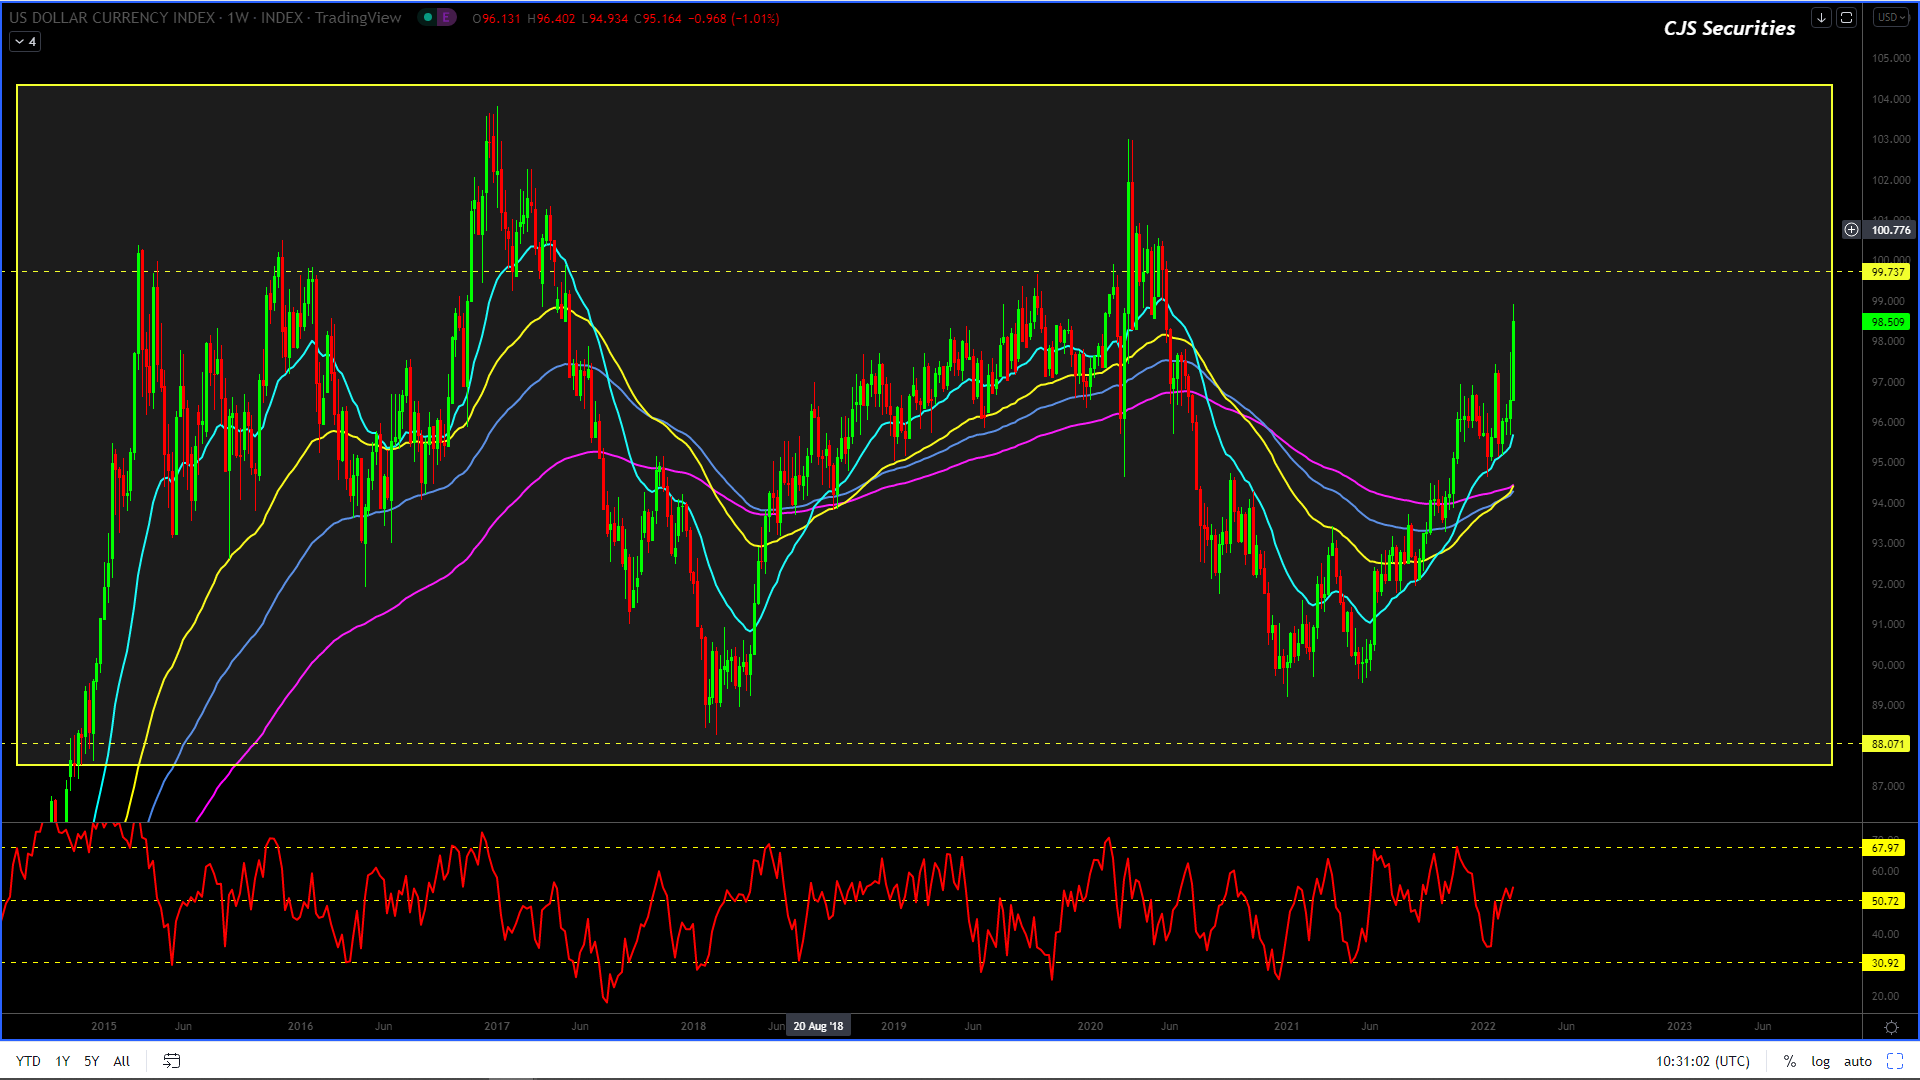
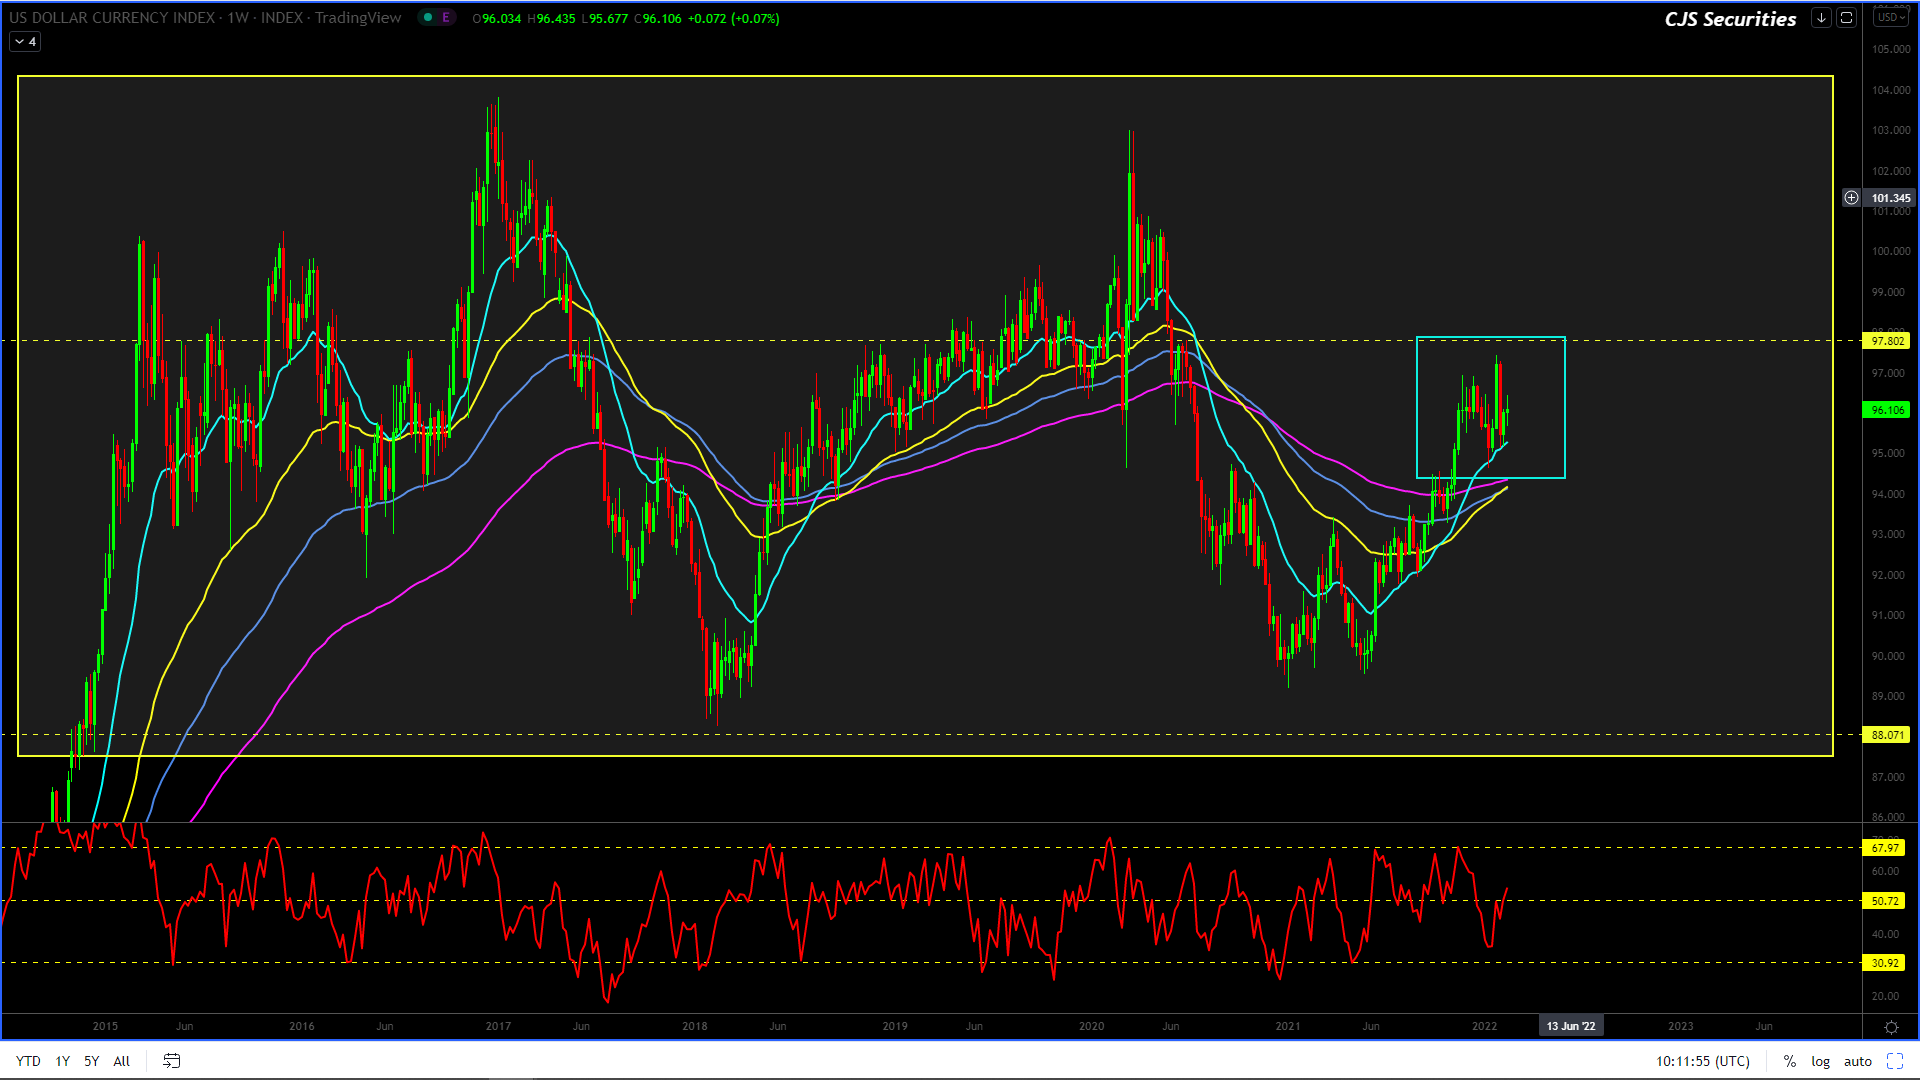
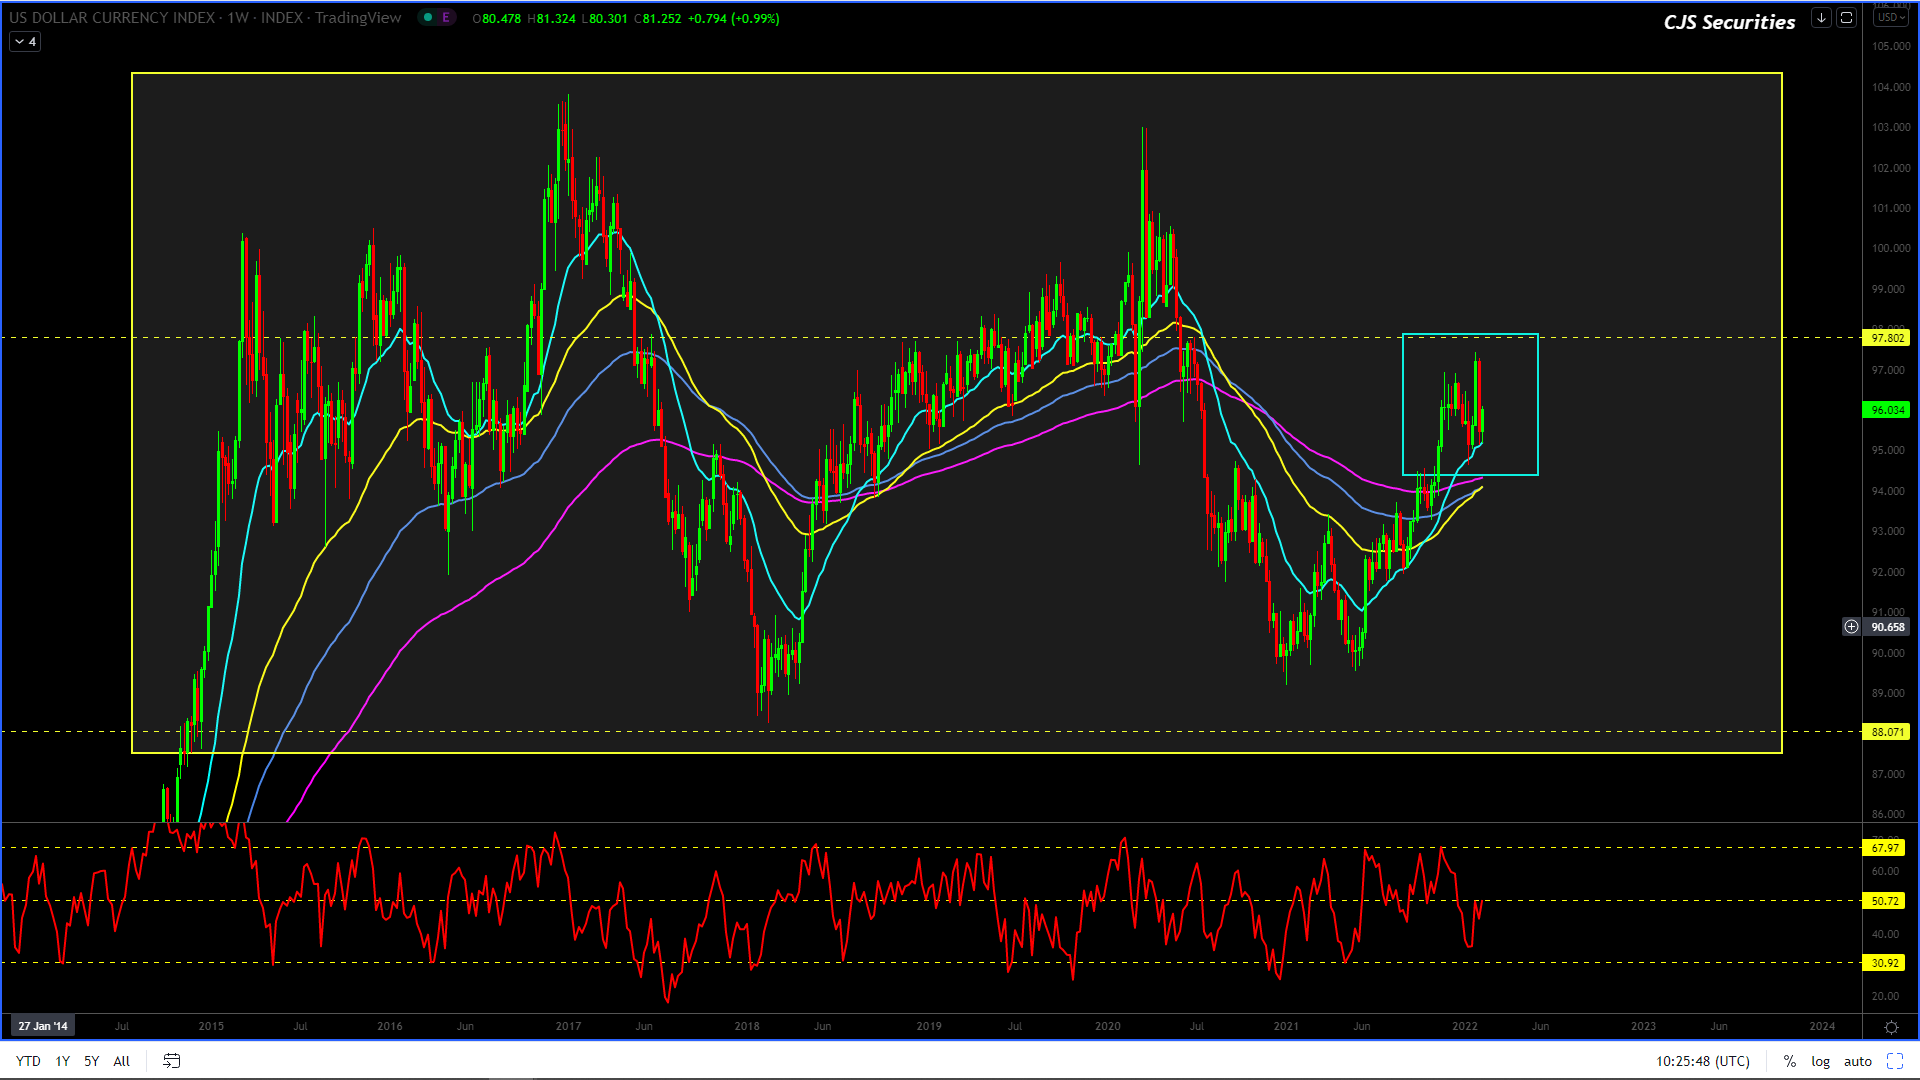
US Dollar Index Weekly Candle
So much for the chart’s upside momentum failing.
With the Black Swan of WAR taking over, I am very unsure of where to from here, and hence I would advise staying out.
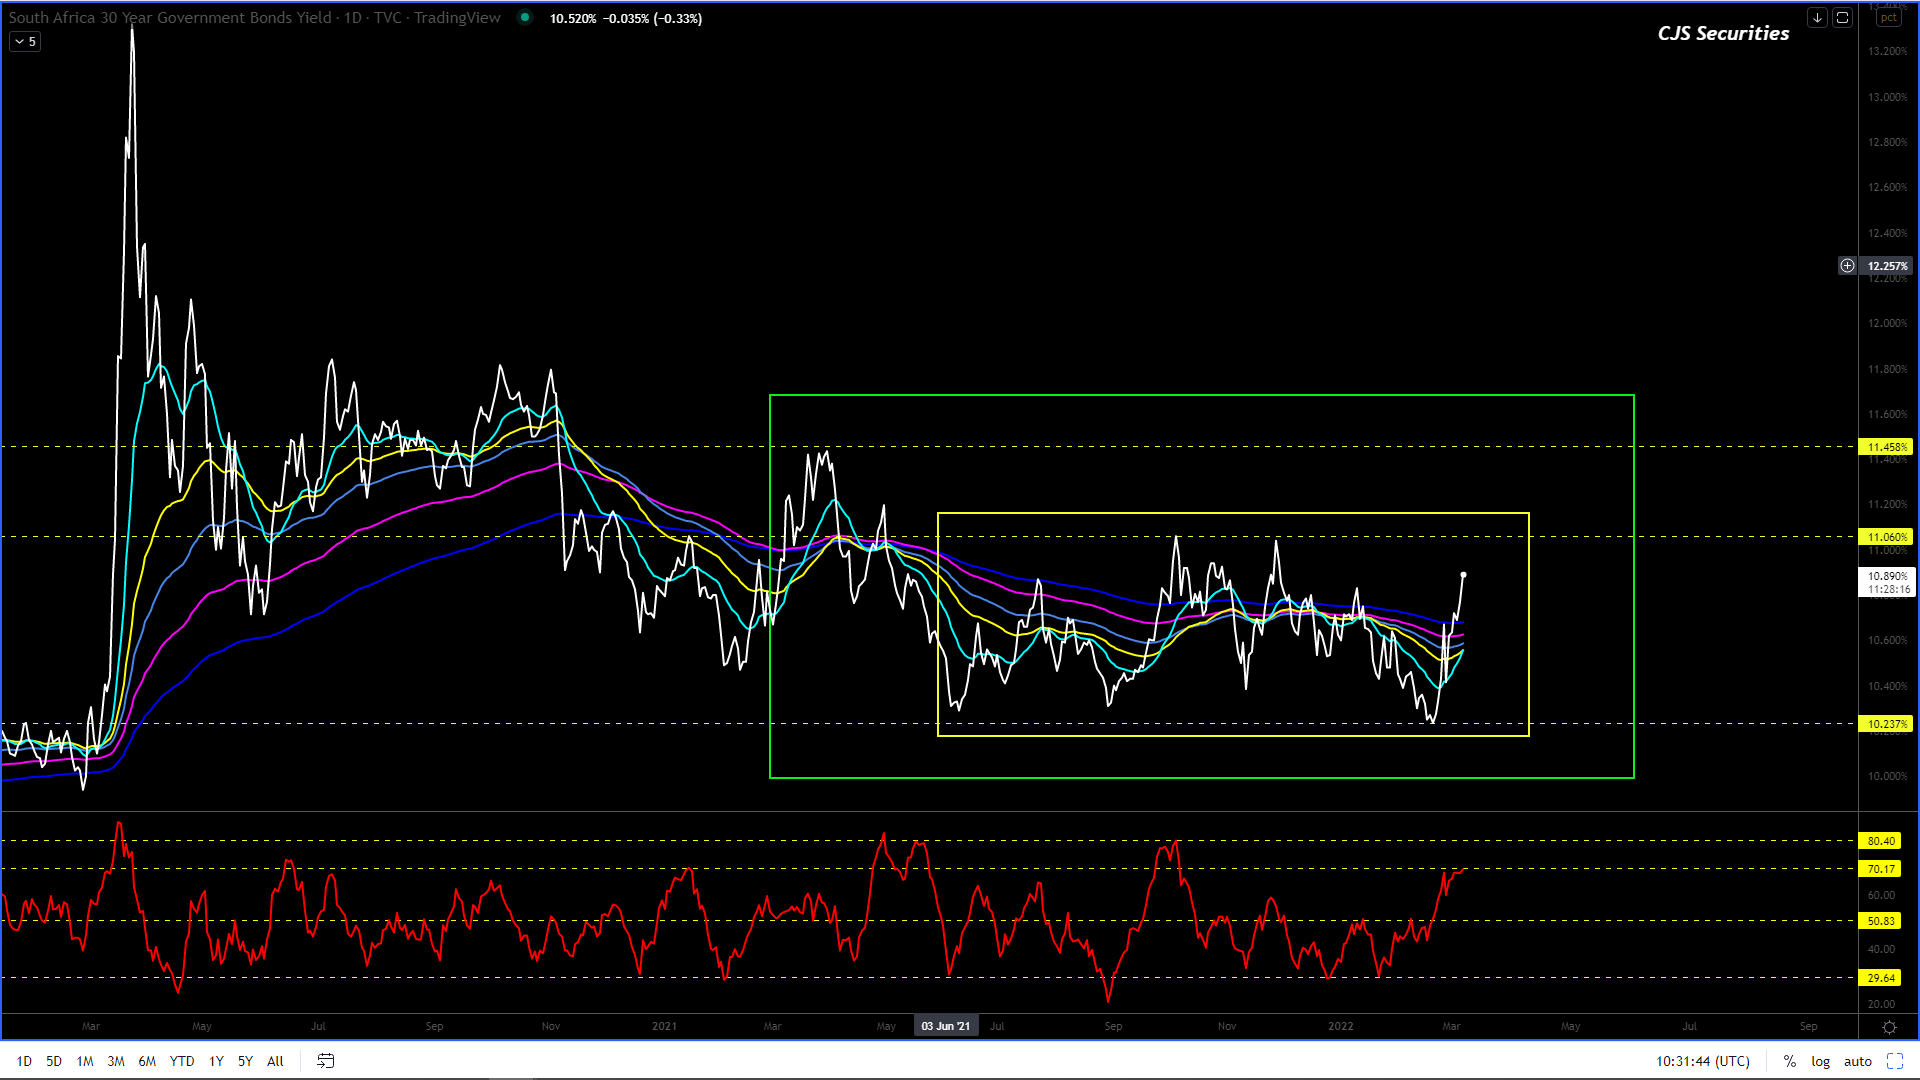
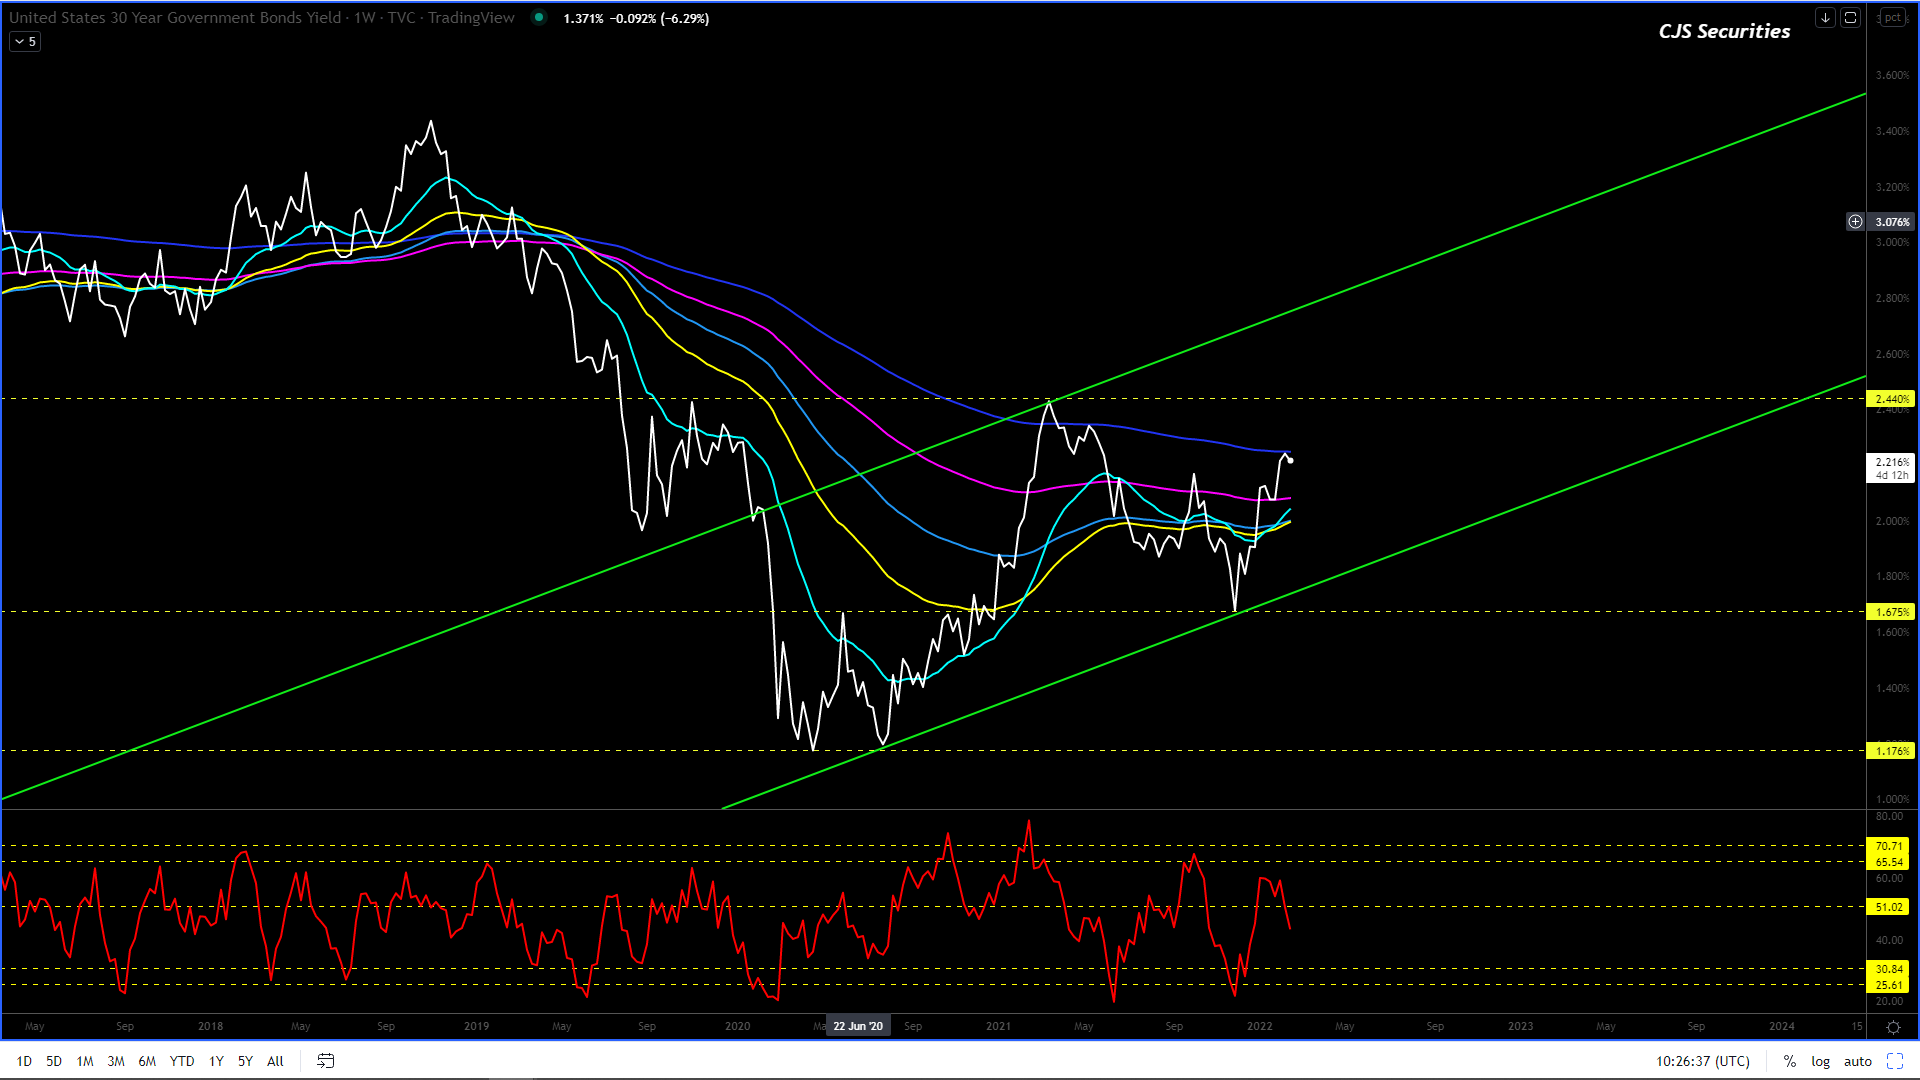
SA Government Bond 30 Year Yield Daily Close
#No Change in commentary
The chart has made a solid base around the 10.30% level.
The chart remains range-bound but we feel the move higher toward the top of the range at 11.40% is on the cards before looking to start a severe leg lower to sub 9.00%.
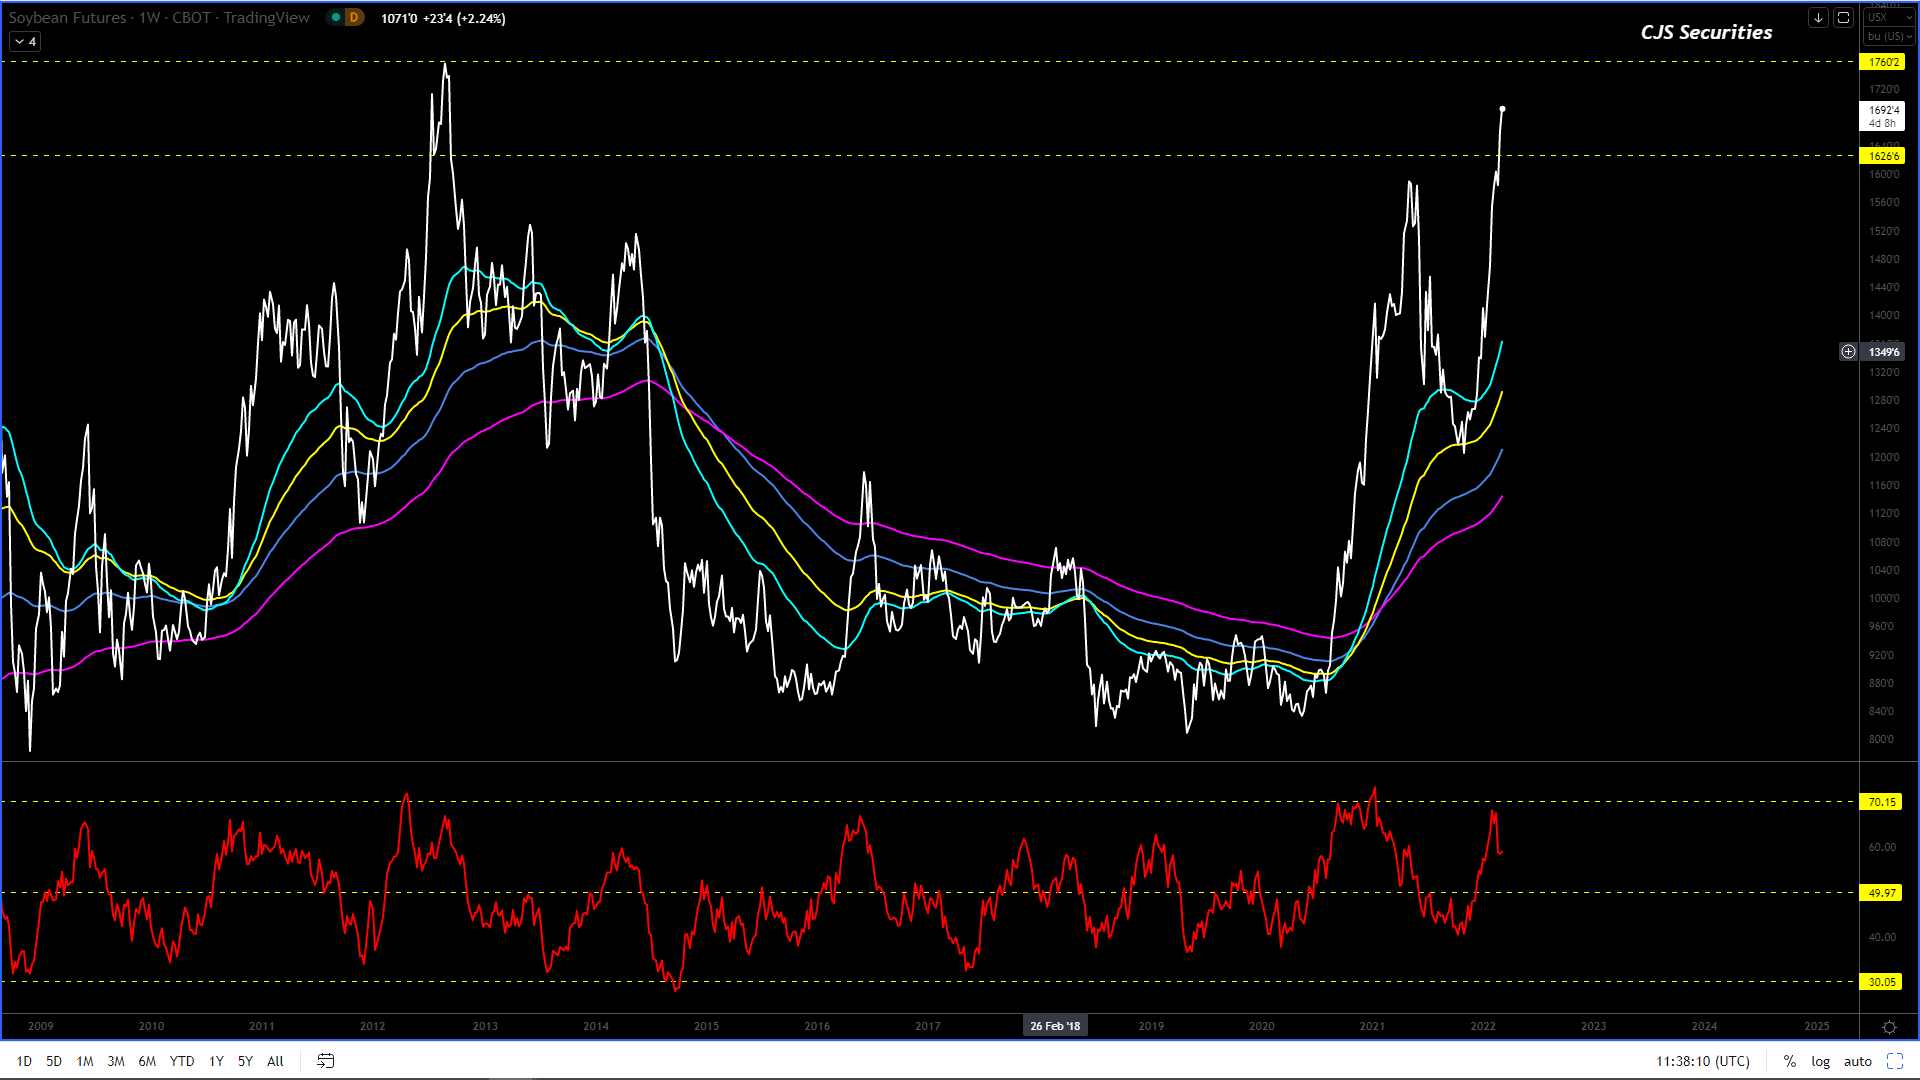
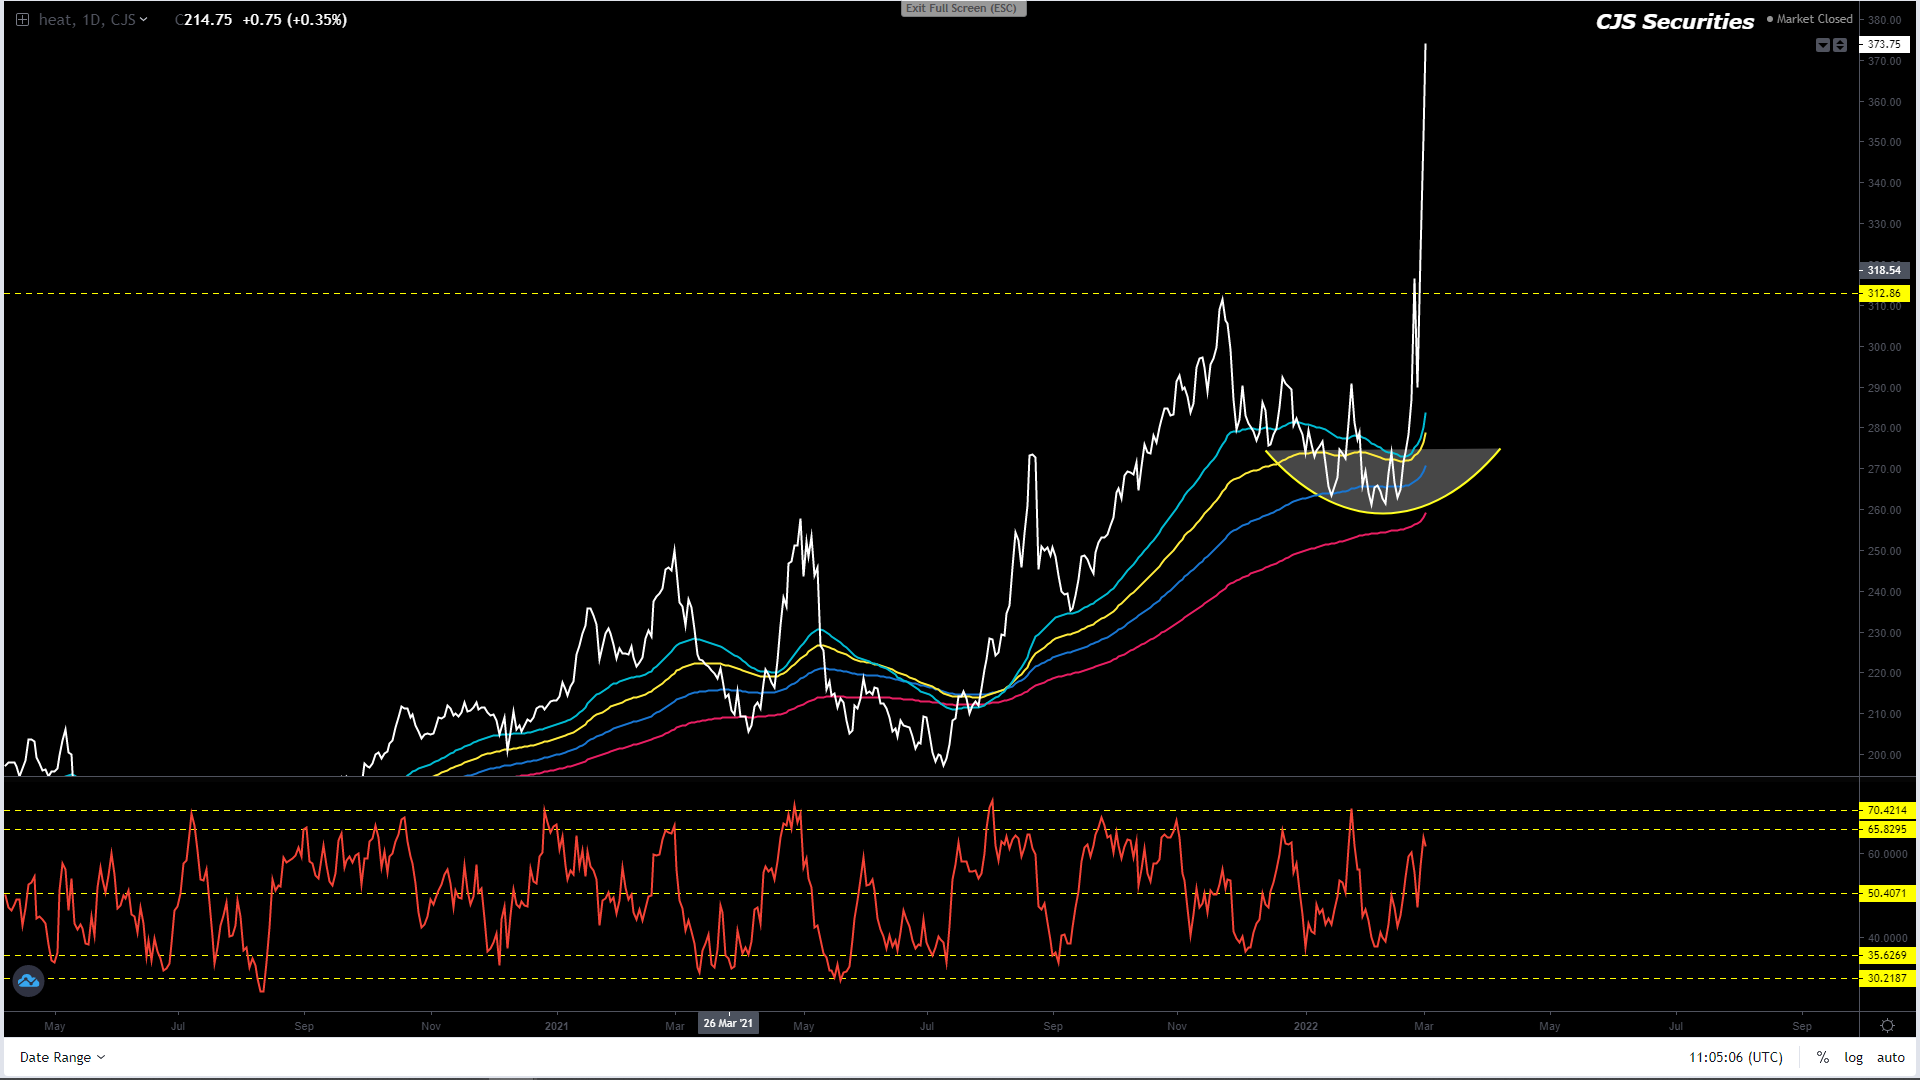
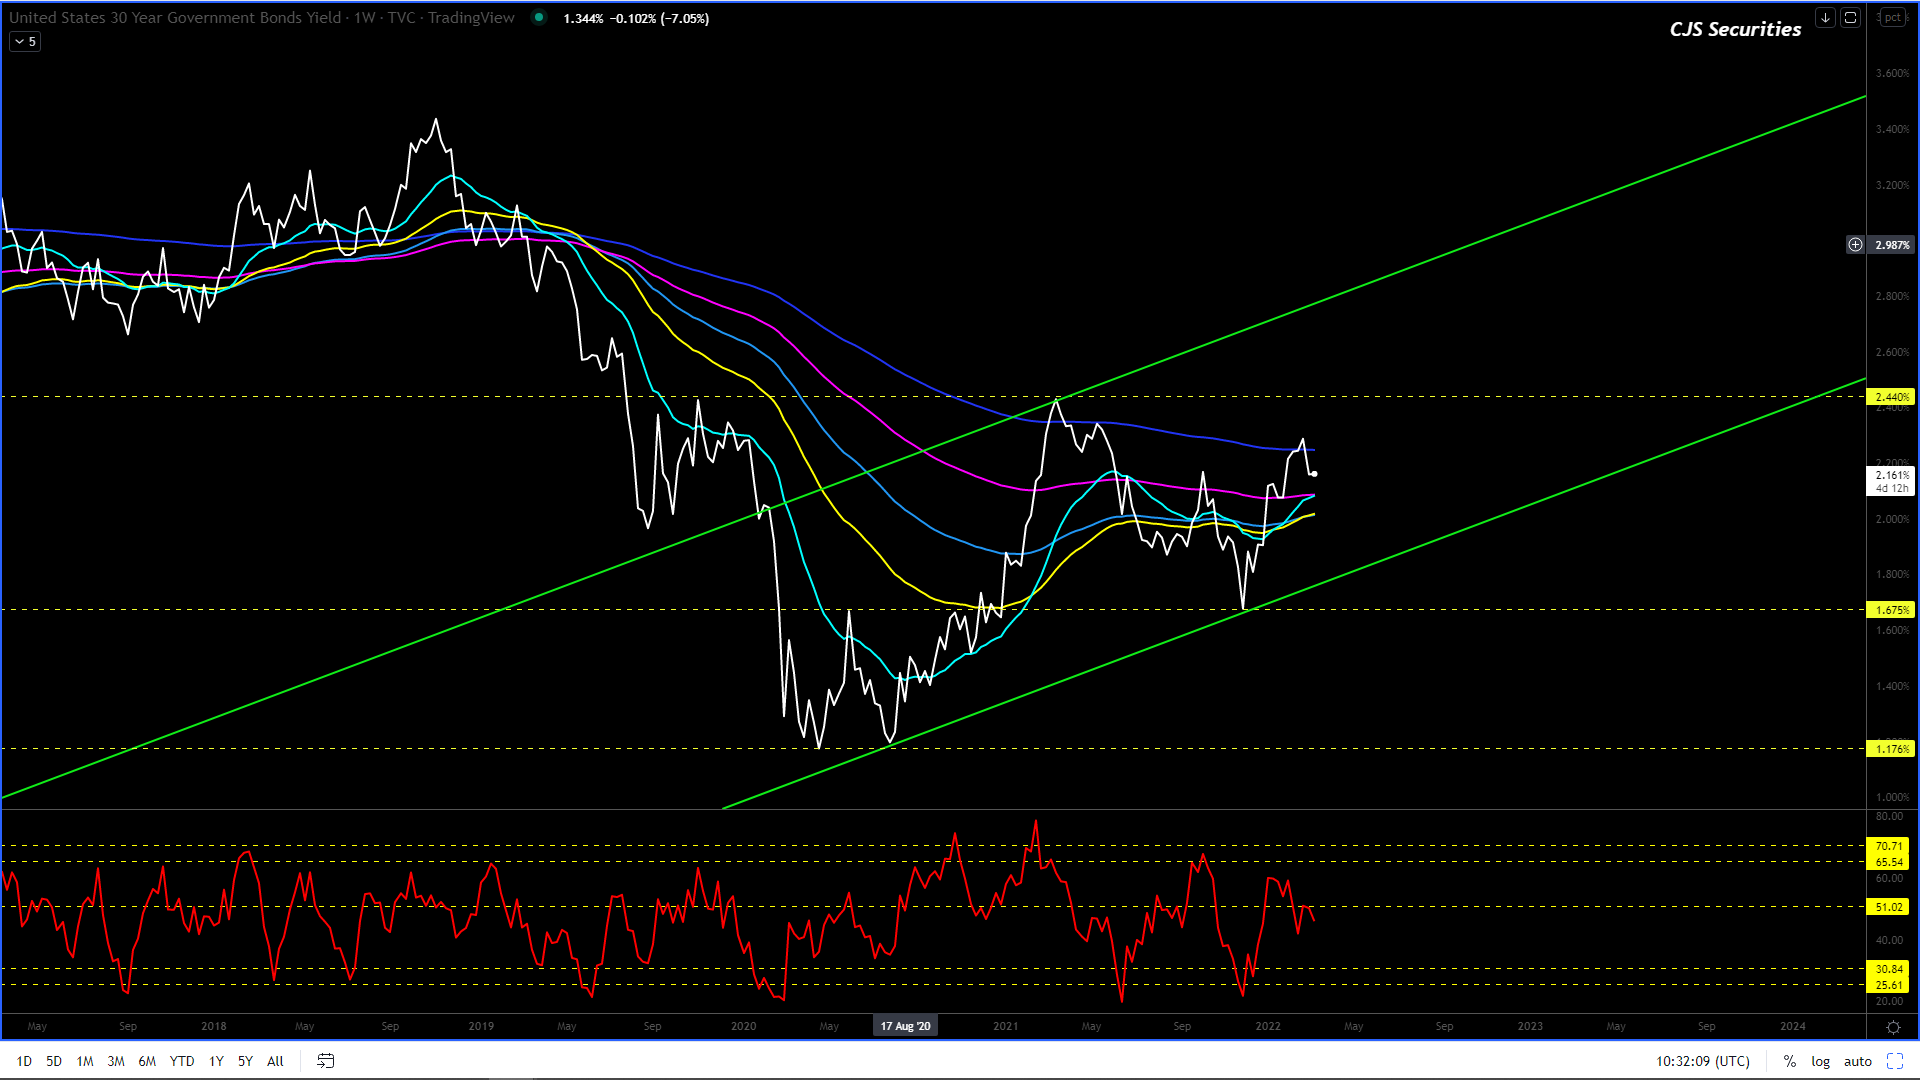
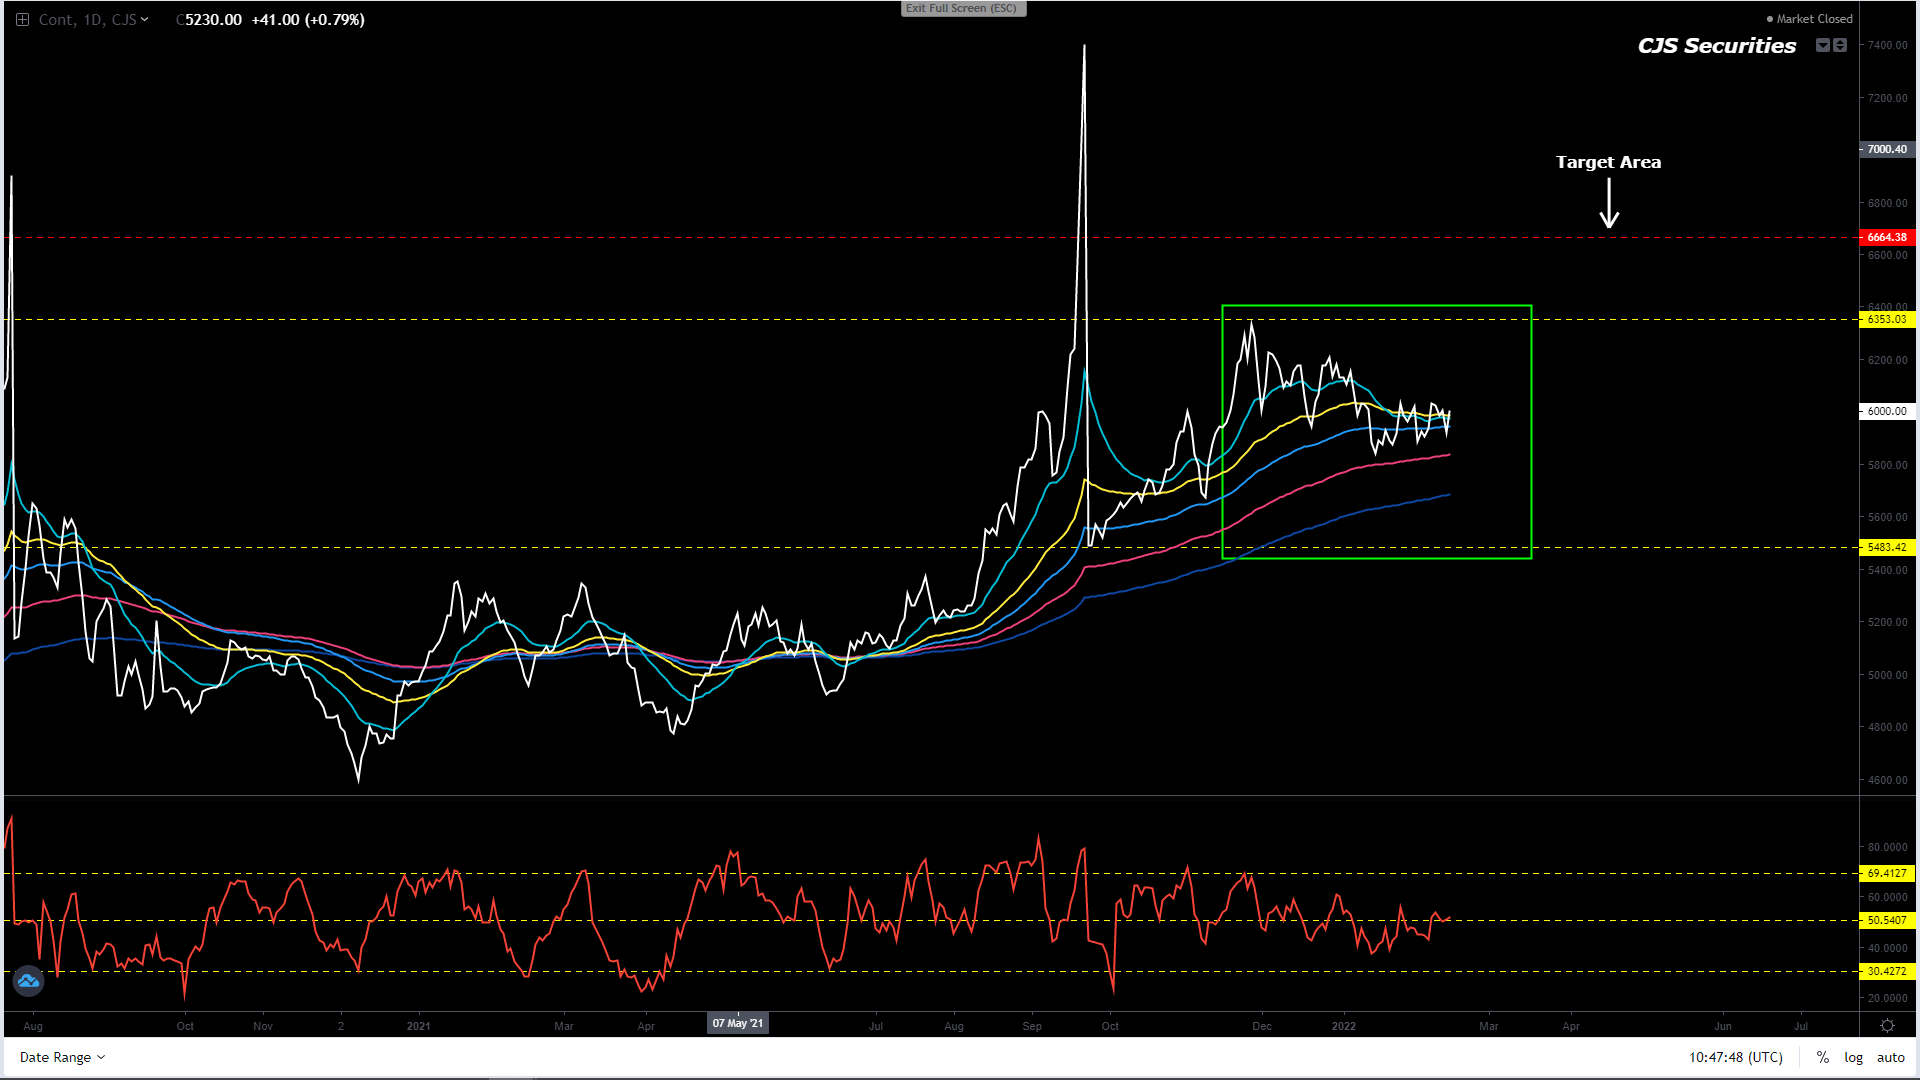
The weekly close has hardly changed, and all I can say is that if Uncle Vlad provides you the opportunity to sell some of your long at a higher level, use it!
The chart remains bullish, but looking at where the weekly close and where the oscillator is I would advise taking profits for those that are long, because when the music stops playing and believe me it will, you don’t want to be the one without a chair!
If you have not thought about shipping in some puts, the time has come.
Please do not get married to your long position, it will only end in a bitter divorce.
240 Min CBOT January 22 Soybean Candle Chart
I wouldn’t say I like this chart, and I cannot advocate buying up here invasion or no invasion.
I have no strong view other than I would love to buy a deep pullback.
Board Crush Continuous Daily Close
The volatility on this chart remains rough.
We are happy to sit out a week or three.
The oscillator remains near oversold levels.
Oil Share Continuous Daily Close
#No Change in Commentary = winning!
We have not been stopped on the below view but will put in a stop under 40% as this chart is now highly overbought!
“After kicking off extremely oversold levels and making a new MT low, the chart remains at oversold levels and another leg lower to 42% will get me long. – lets see how this plays out.”
Weekly SAF Soy Continuous Close
#No Change in Commentary
Now is the time to sit back and wait for the next opportunity as its not every day that you will make R500 + on a trade.
Weekly SAF Suns Continuous Close
This
chart is not a true reflection of the Suns market, and come closer to harvest
it will likely print R8000.
Weekly CBOT Soy Oil Continuous Close
The below has not changed, and we are riding this one into the sunsetas we are winning!
I seem to have this wrong and although we are long, this chart is now grossly oversold on a weekly basis and we need to dig deep and buy more scale down with a stop under $0.52 as the rally is coming, even if its only a kick!
I feel the correction is done (it had another leg lower), and all the pullbacks from here are buying opportunities with upside targets between $0.85 -$0.89! – the correction was obviously not done.
I almost feel that we don’t have enough cash to get as long as we should, buy at best and scale down, this is budget making stuff with sprinkling of retirement!!!! – hope we don’t go broke before retiring.
Weekly CBOT SBM Continuous Close
Nothing has changed on the weekly chart, but we are happy to stay out until further notice.
With the oscillator being where it is, I would be a very nervous short around current levels.
Nothing has changed technically to the below commentary, but all I can say is beware of Ukraine and if it blows and you are long, take the cash!
For those that have faded the rally to over $6.40, I am with you and firmly believe that if we see a continued rally, the $6.60’s will be the highs. – so far so good, but over $6.72 I would be wrong.
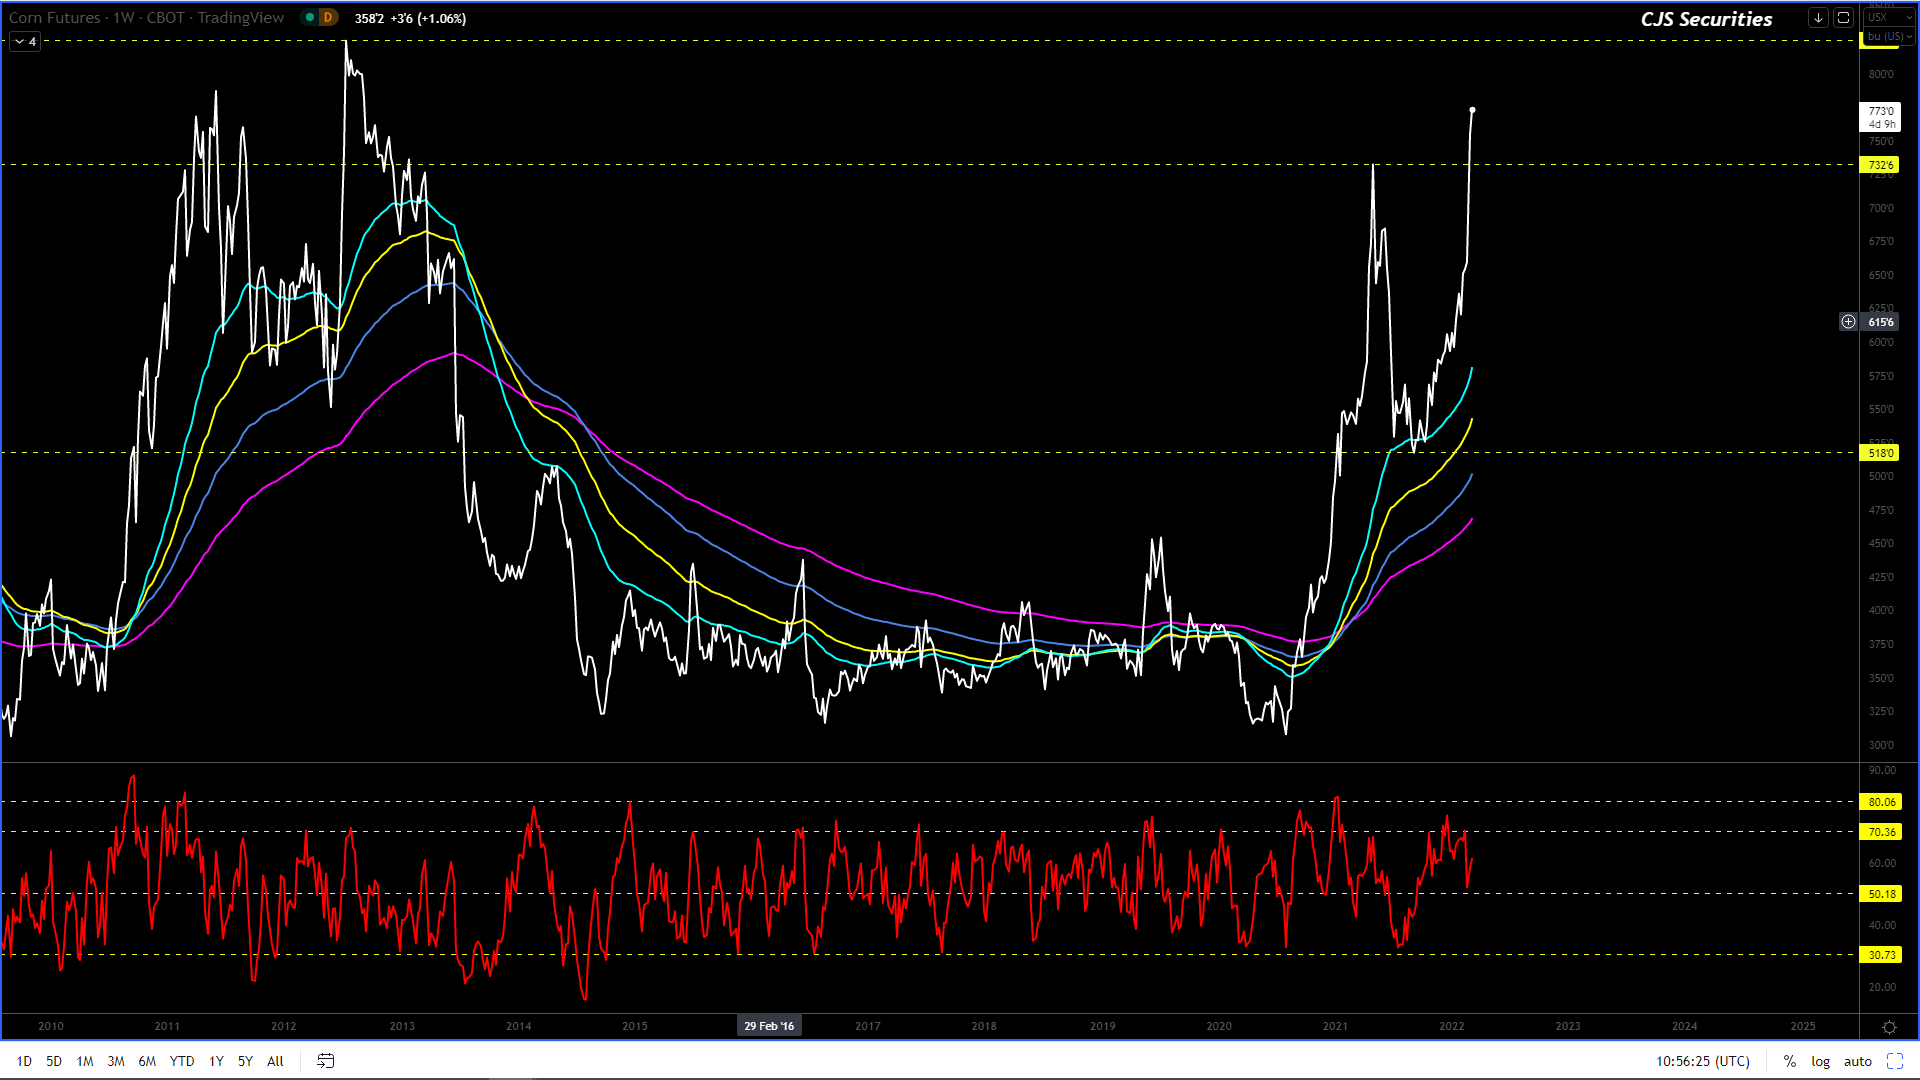
I am convinced that the chart will not turn into a massive bull market from here and that my big picture view is that the following $1.00 move will be lower rather than higher (could be famous last words).
Should my above view be correct this chart could be in for a move back towards the low $5.00’s, before becoming a serious buying opportunity once again.
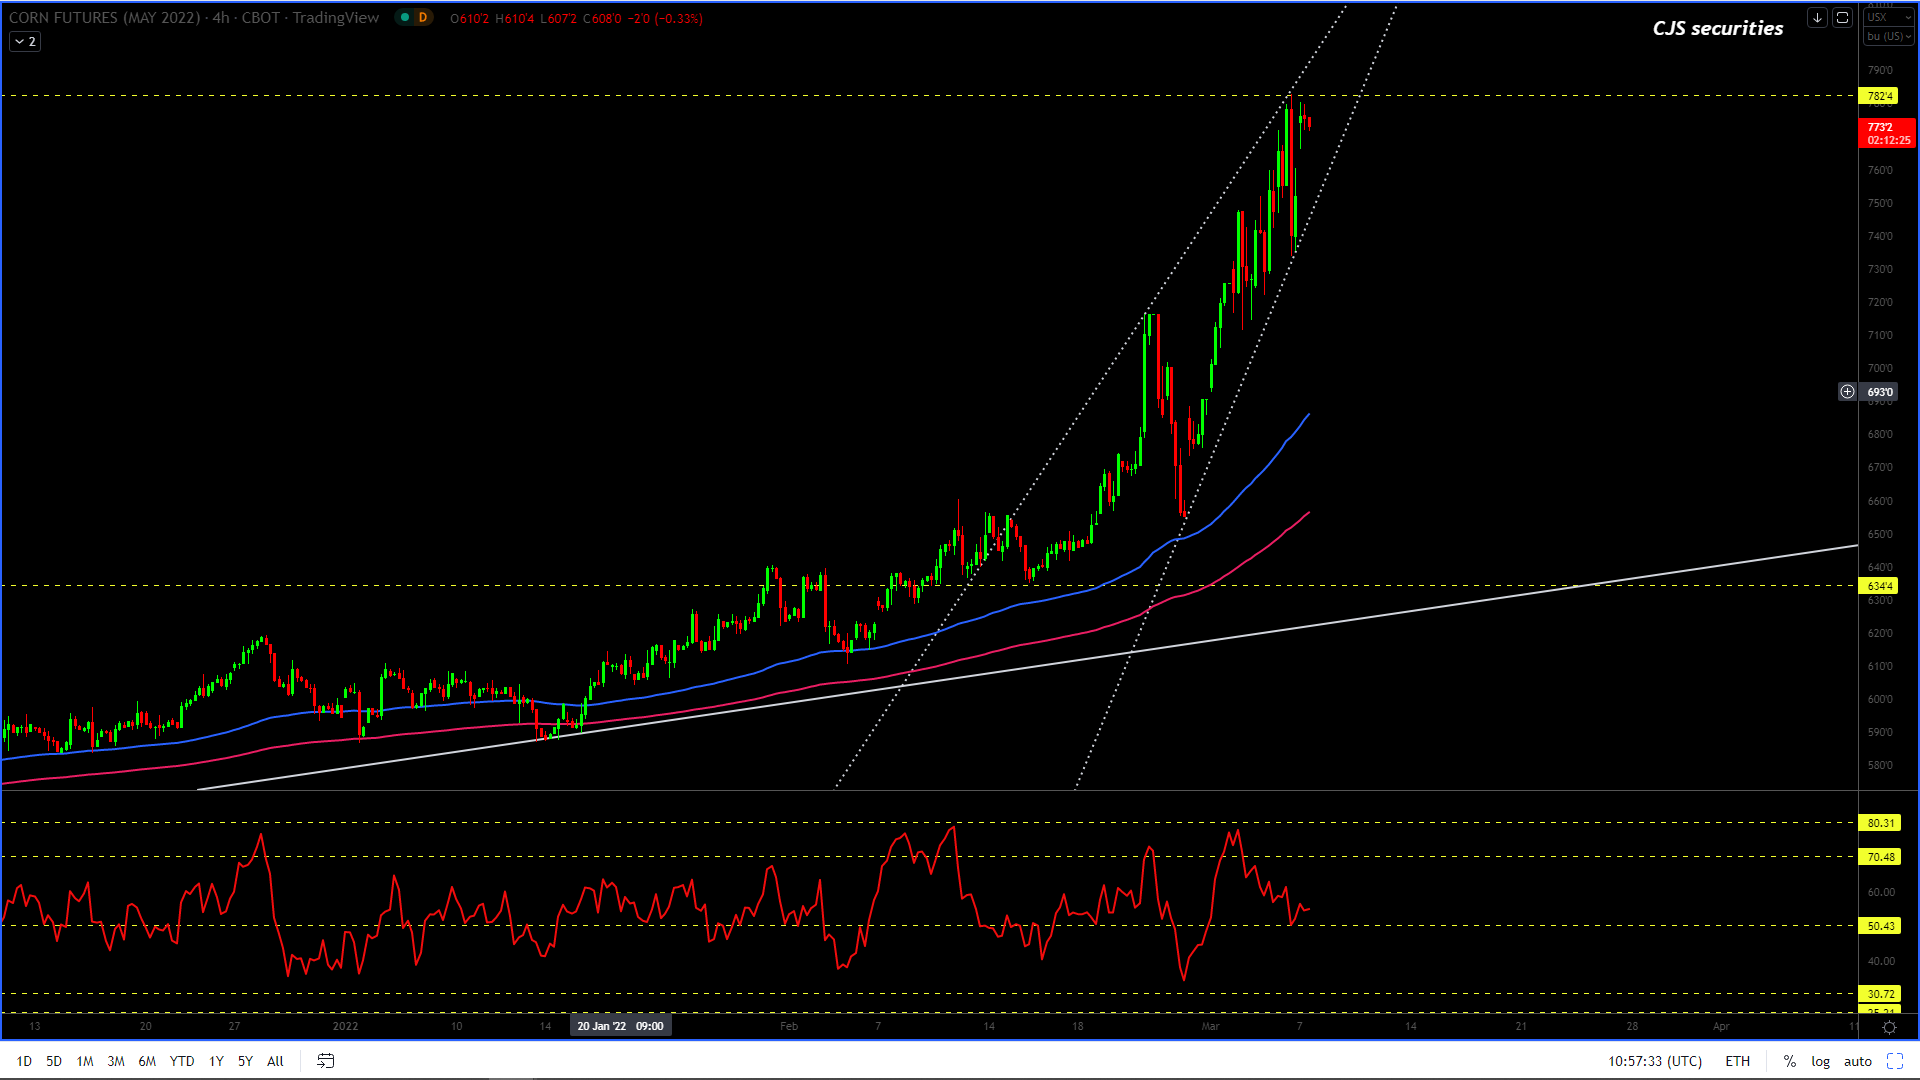
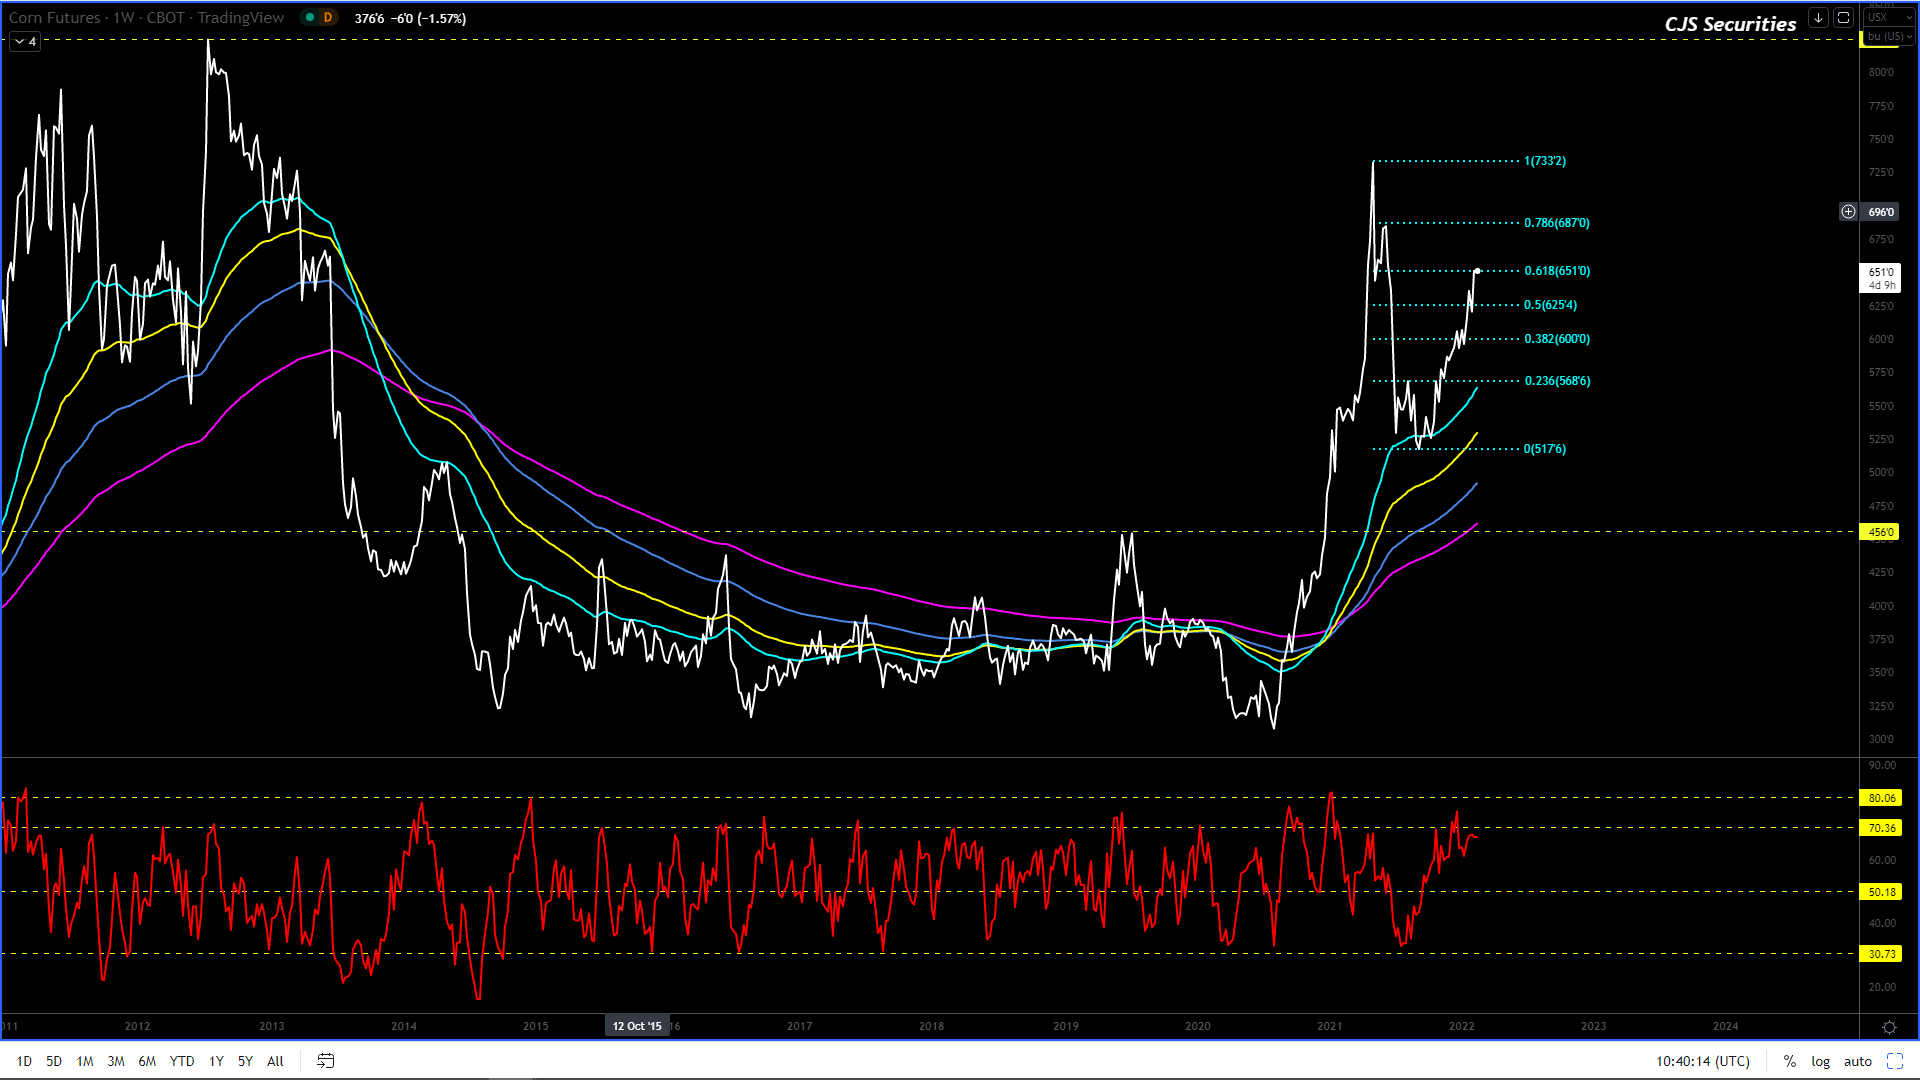
240 Min March 22 Corn Candle Chart Close
Technically nothing has changed, and the ST double tops are not great for the bulls, but maybe uncle Vlad will help them out.
If so, I would take the cash on outstanding longs. – short at $6.60, fingers, toes, and all other appendages are crossed for this one.
If my above view is correct, we could be in for a vicious ST bear market.
Think about what move would hurt the most players, and the answer is a move back sub $6.00!
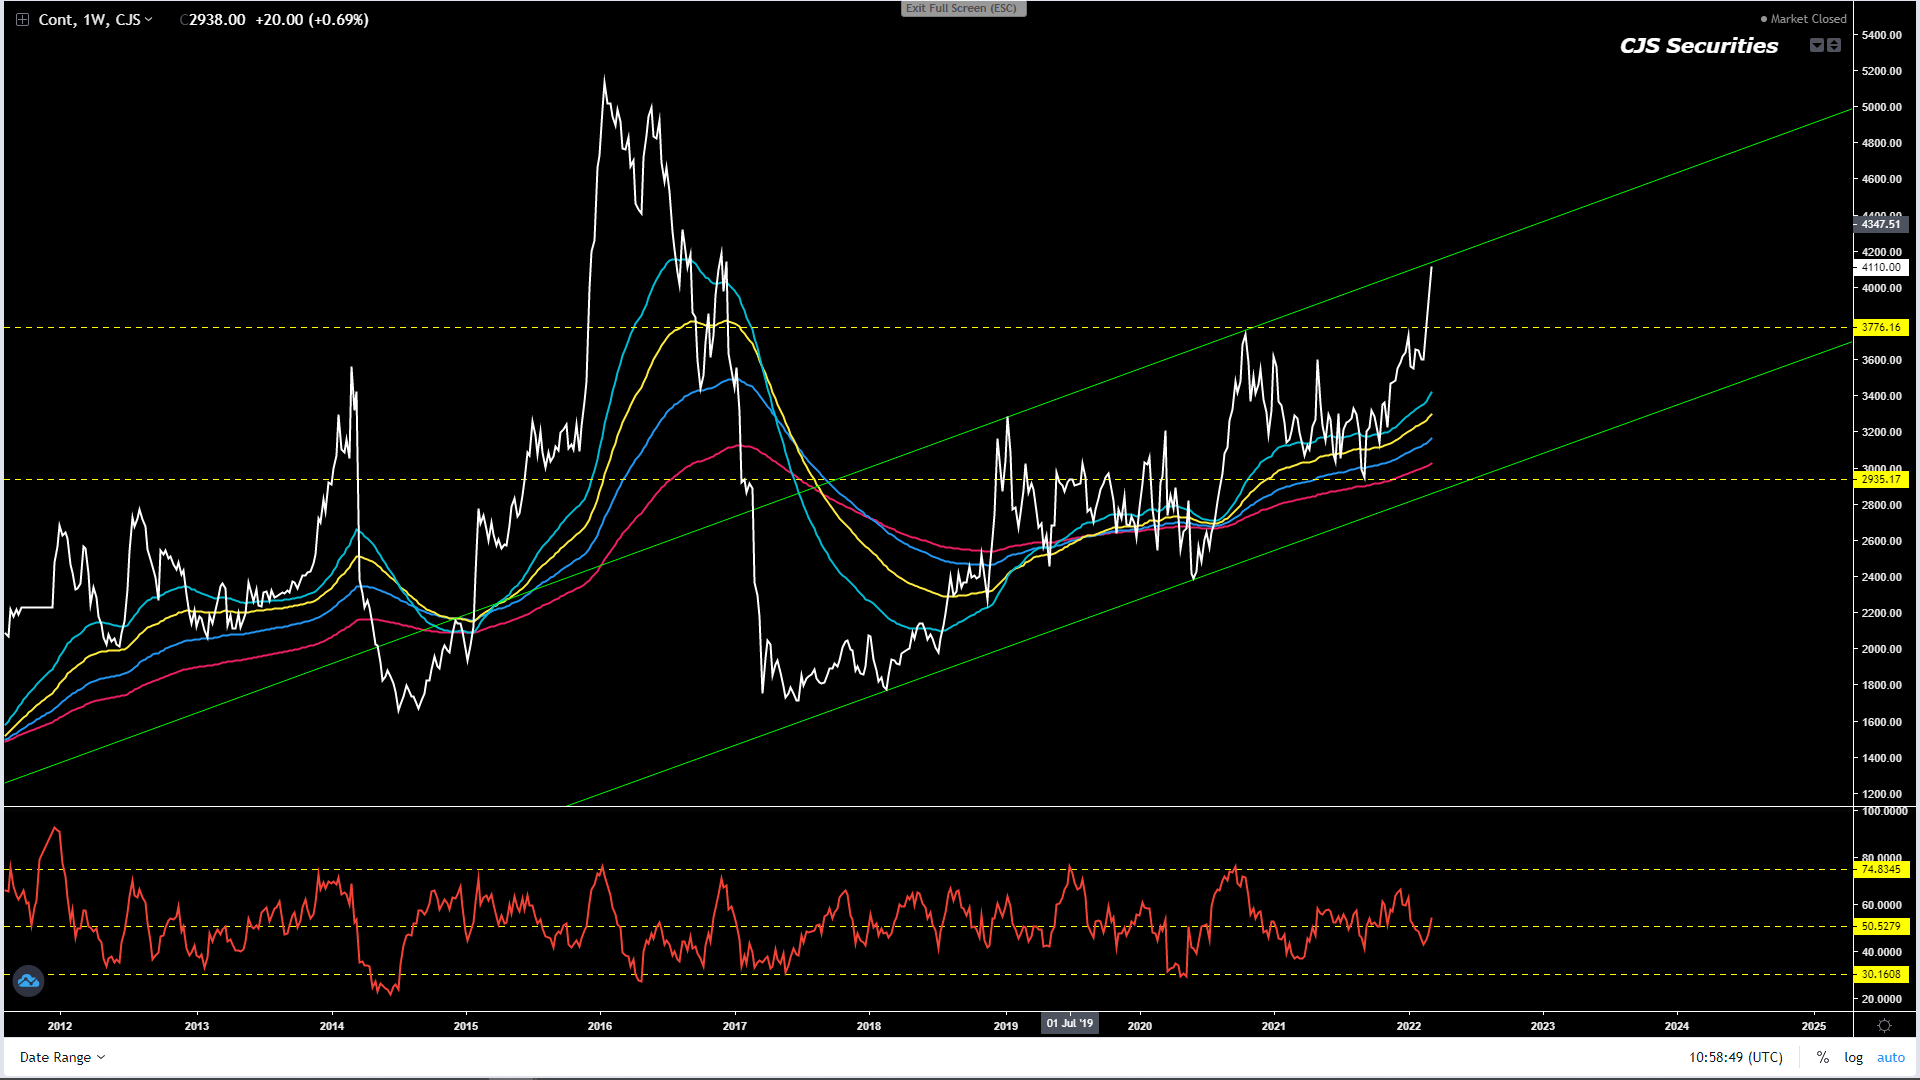
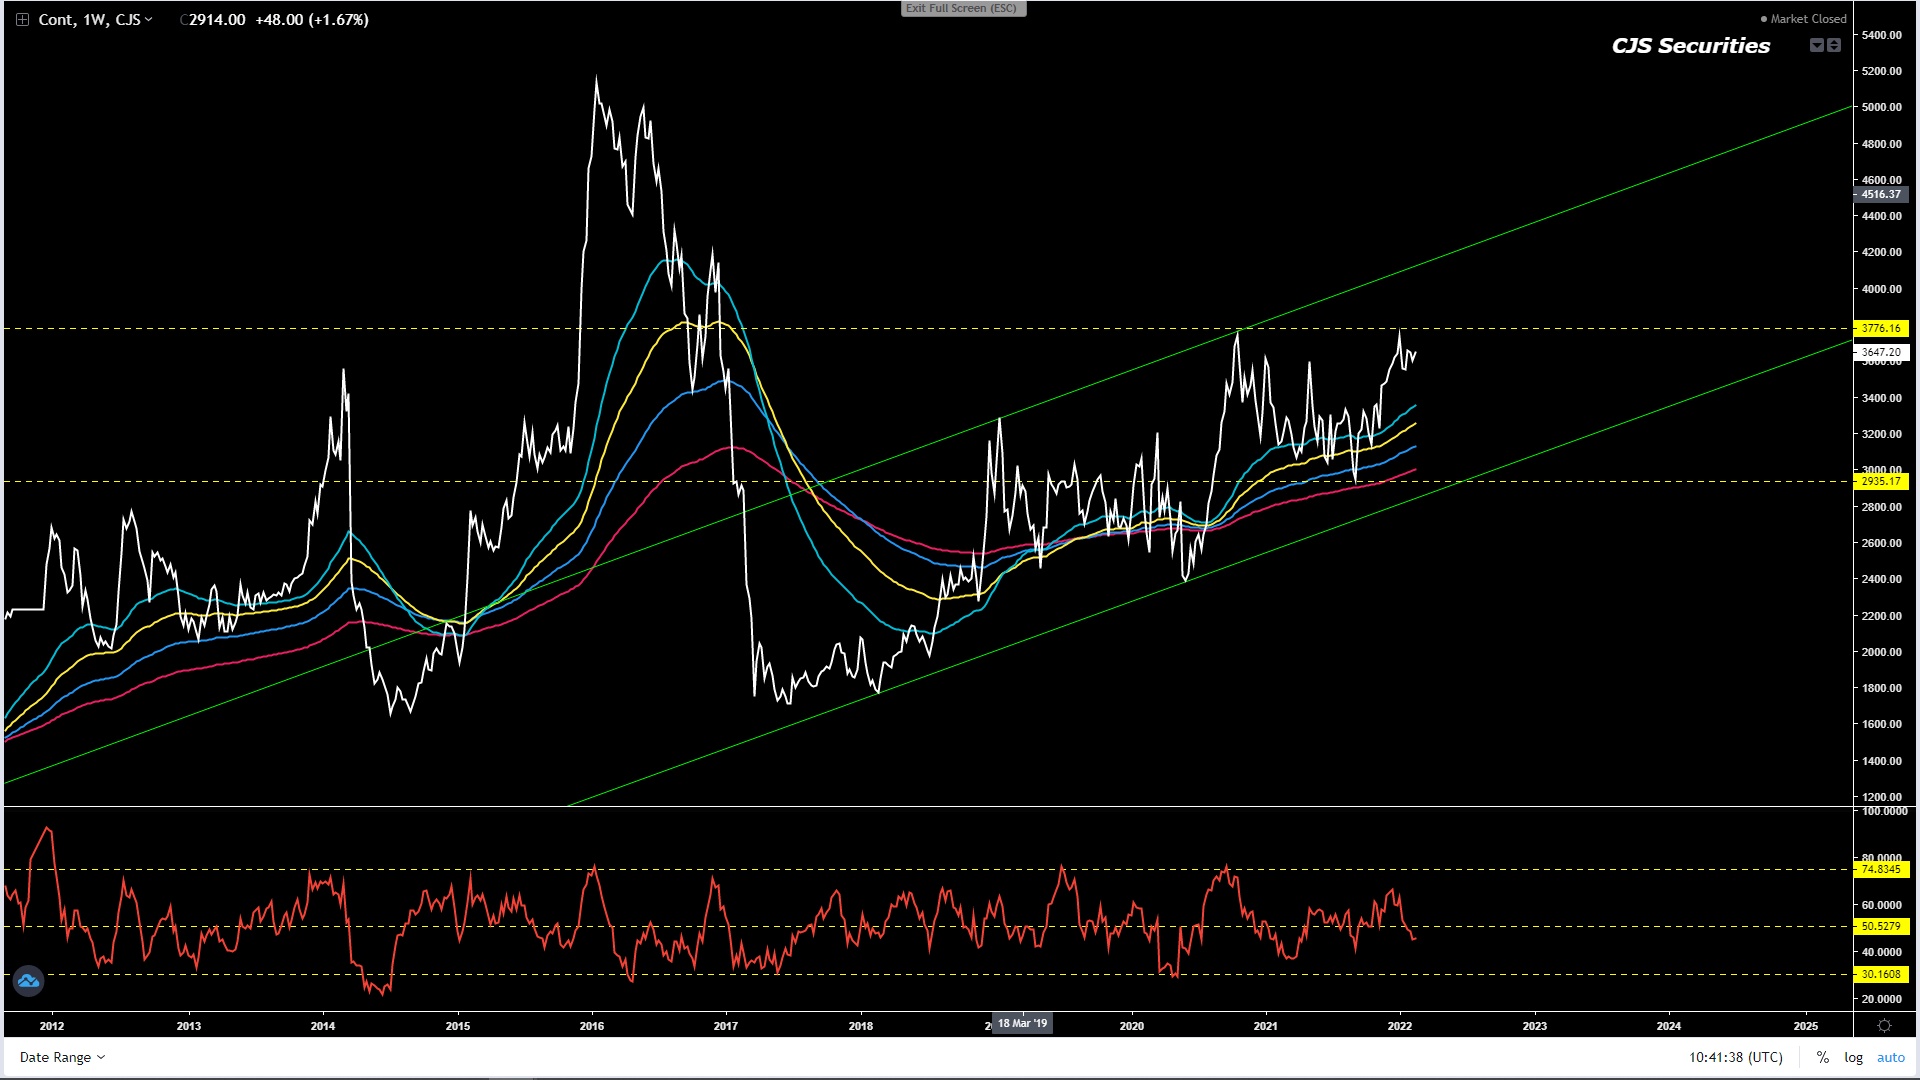
Weekly WM Continuous Close
I stand by the below view in the face of geopolitical issues; however, I feel the chart could test the top of the range before coming off again.
People, I cannot emphasize just how strong these WEEKLY CLOSE DOUBLETOPS are and right now, even in the face of high crude and SAM, this chart is not a buy.
Right now IMO any rally back over R3700 would constitute a selling opportunity
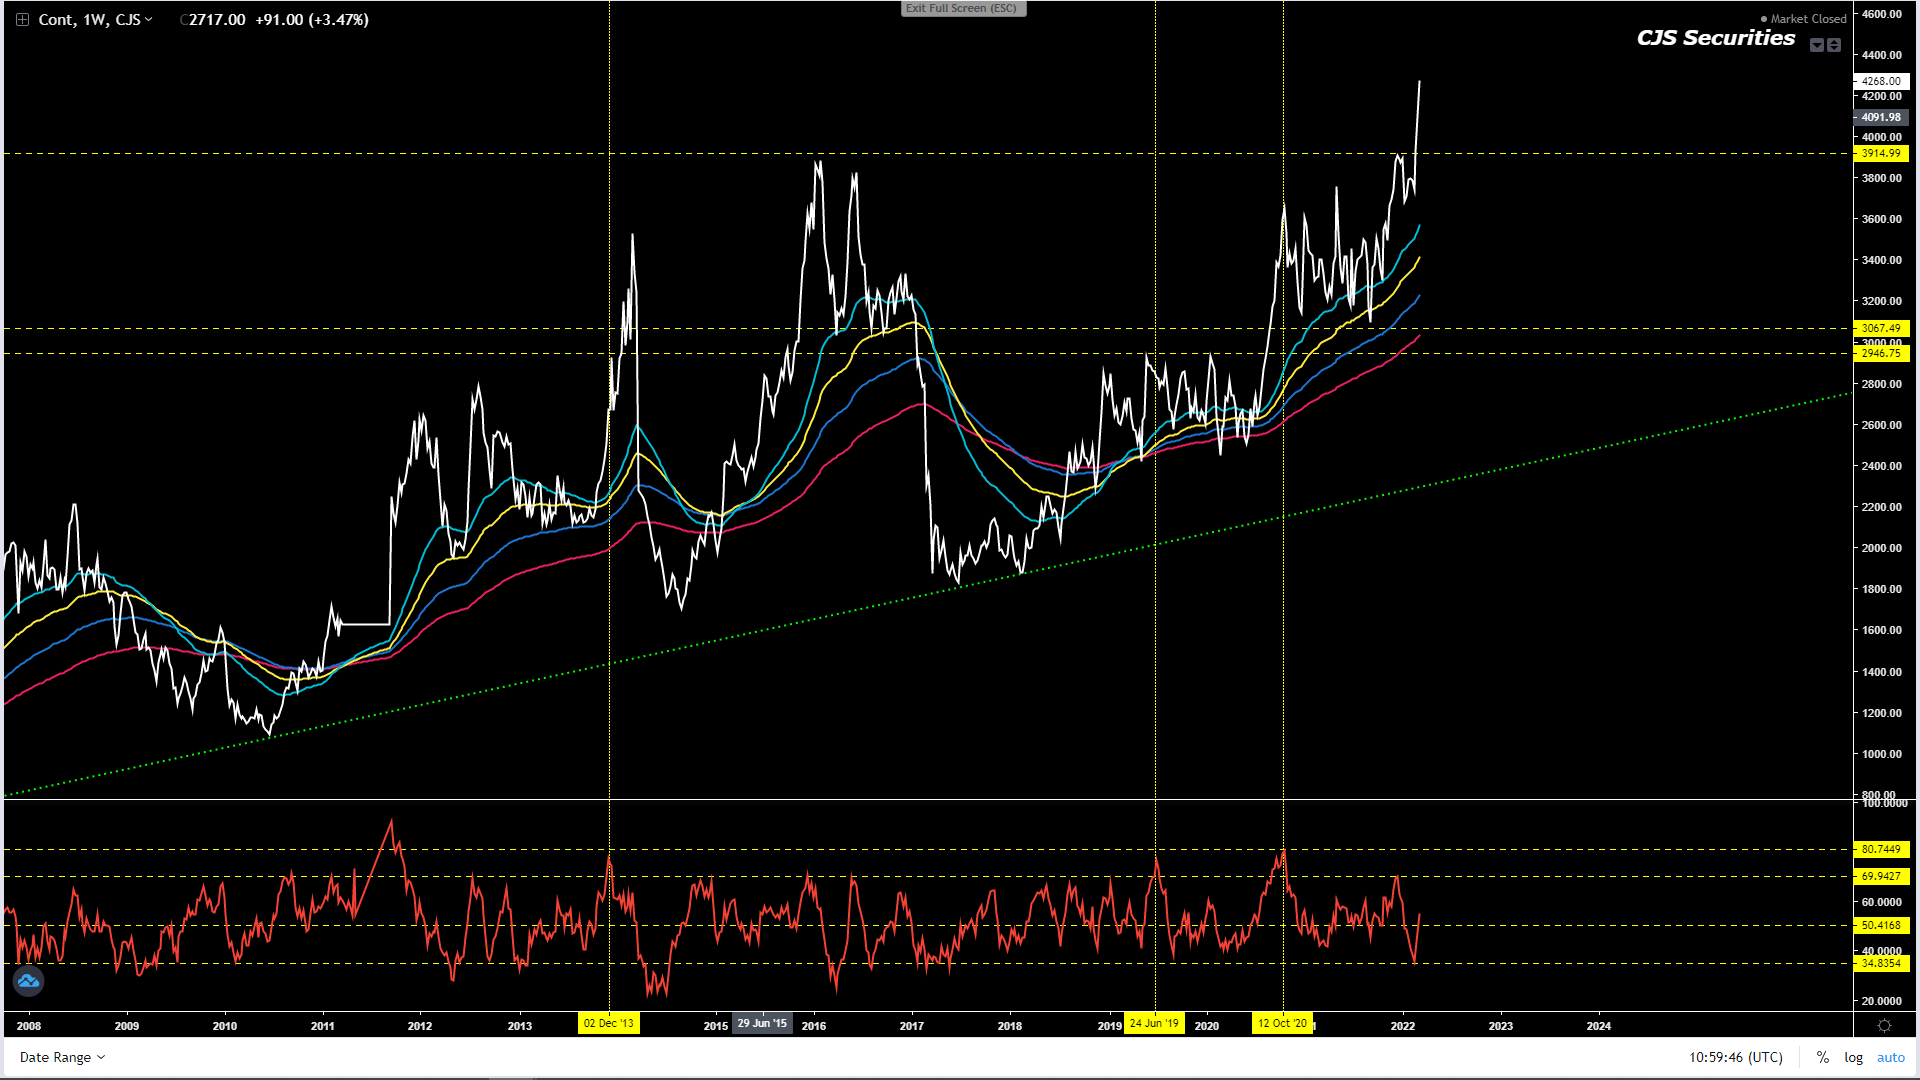
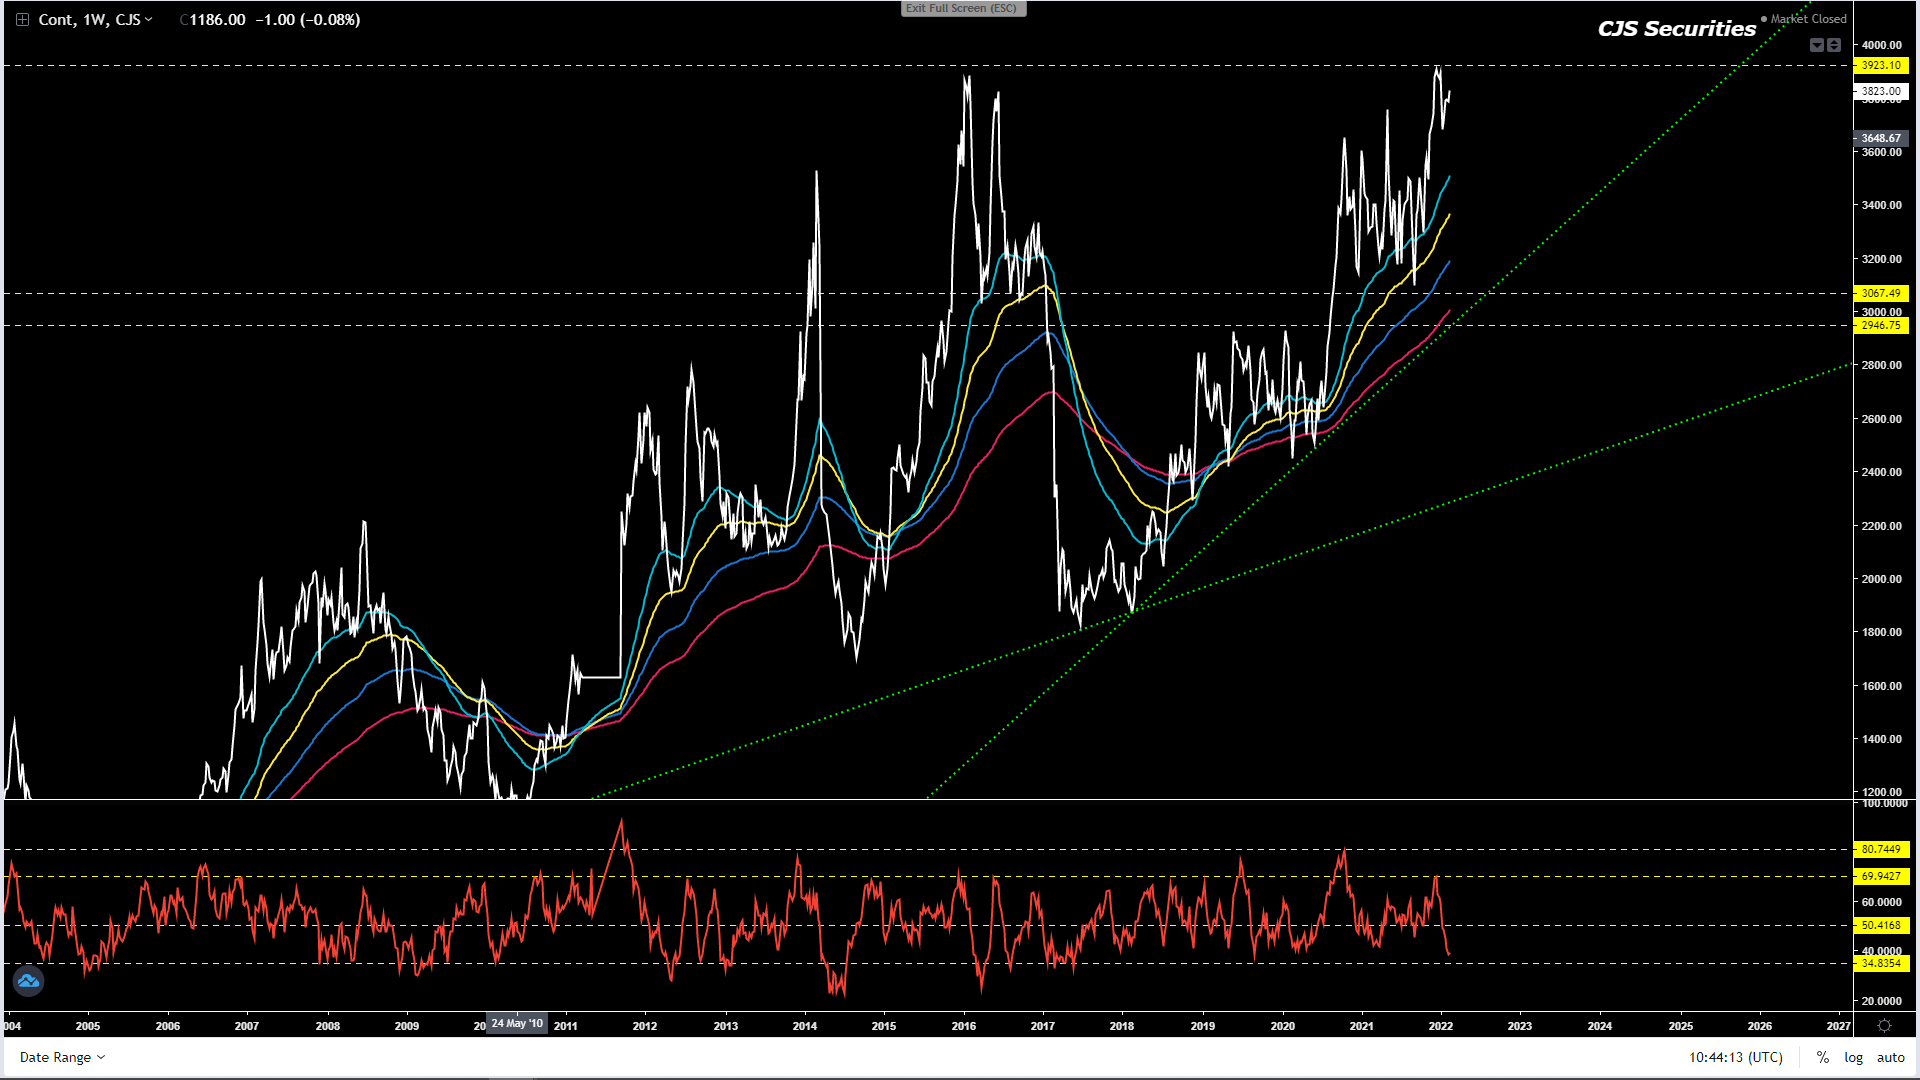
Weekly YM Continuous Close
I stand by the below view, but I feel the chart could test the top of the range before coming off again, especially after being oversold.
This chart has reached its target zone and has made MASSIVE Weekly Close double tops.
I am happy to sit on the sidelines until we feel there is more certainty in buying this chart
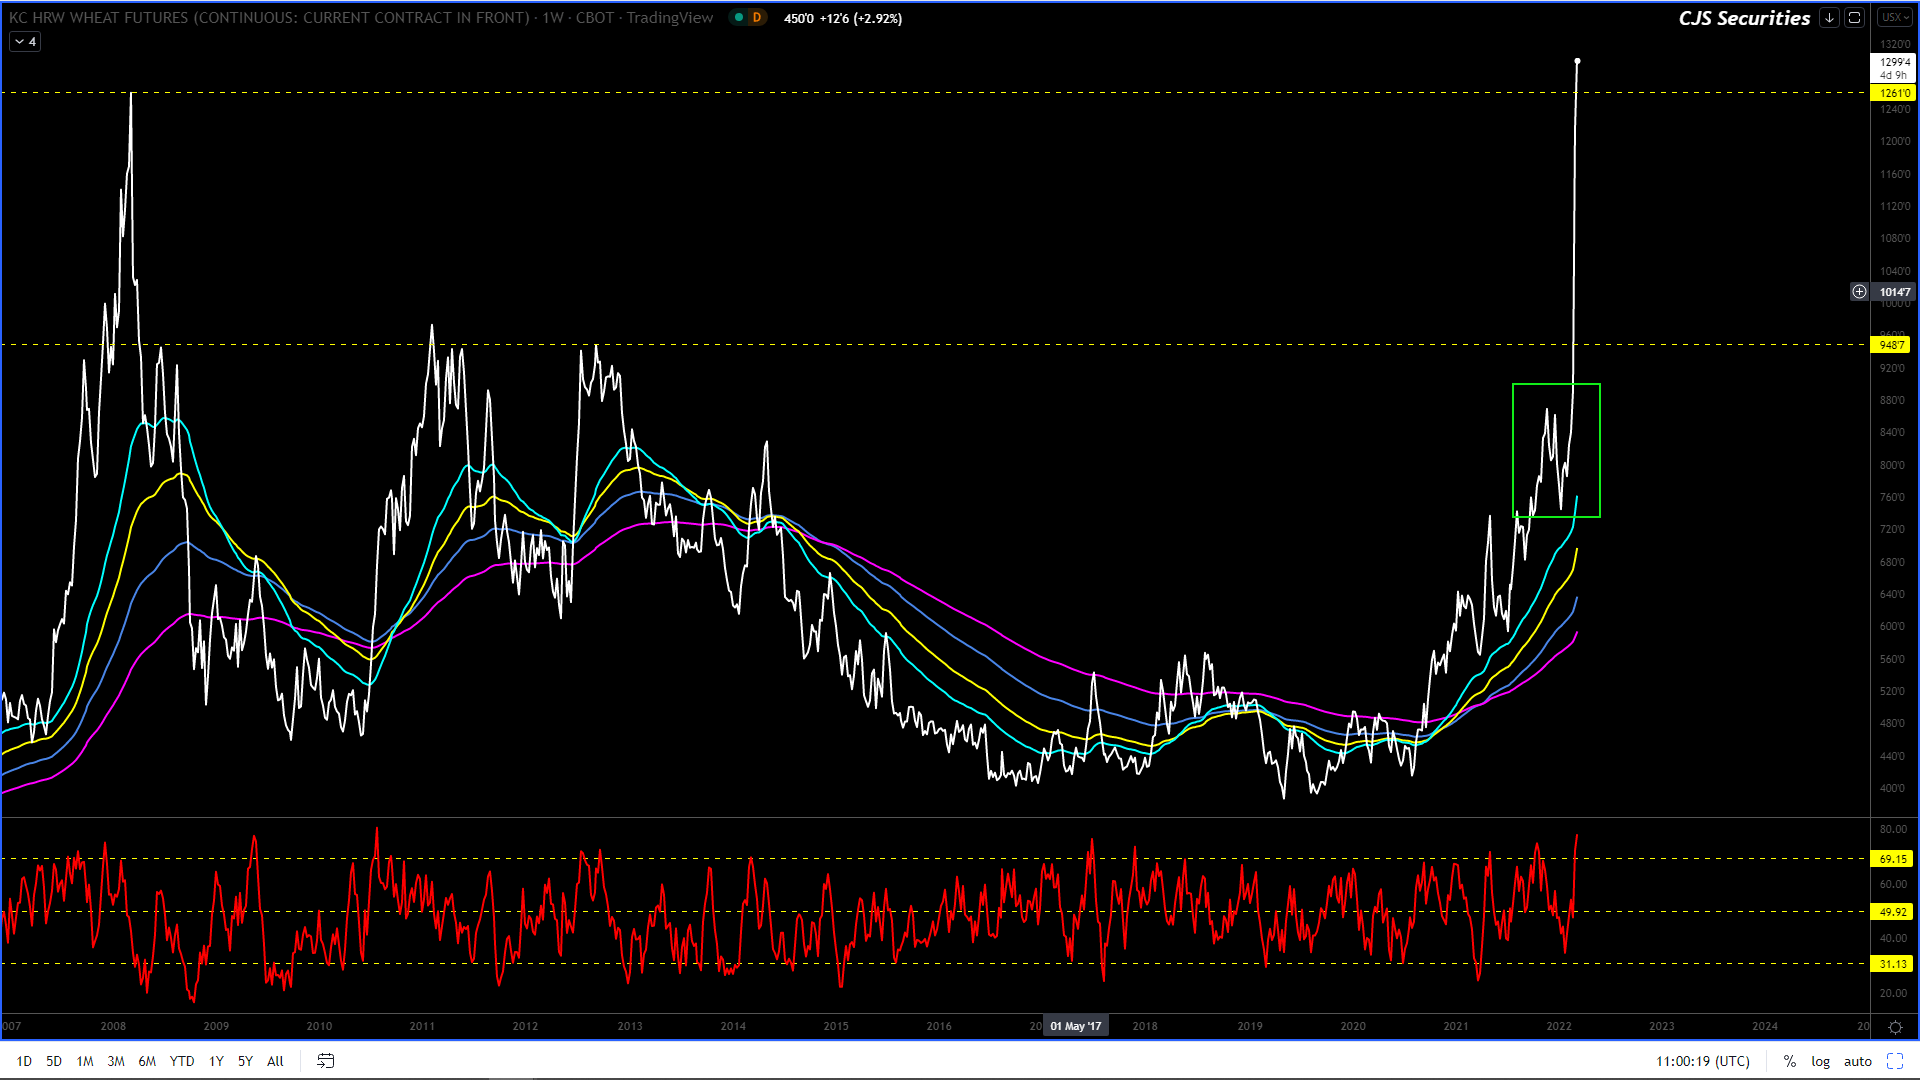
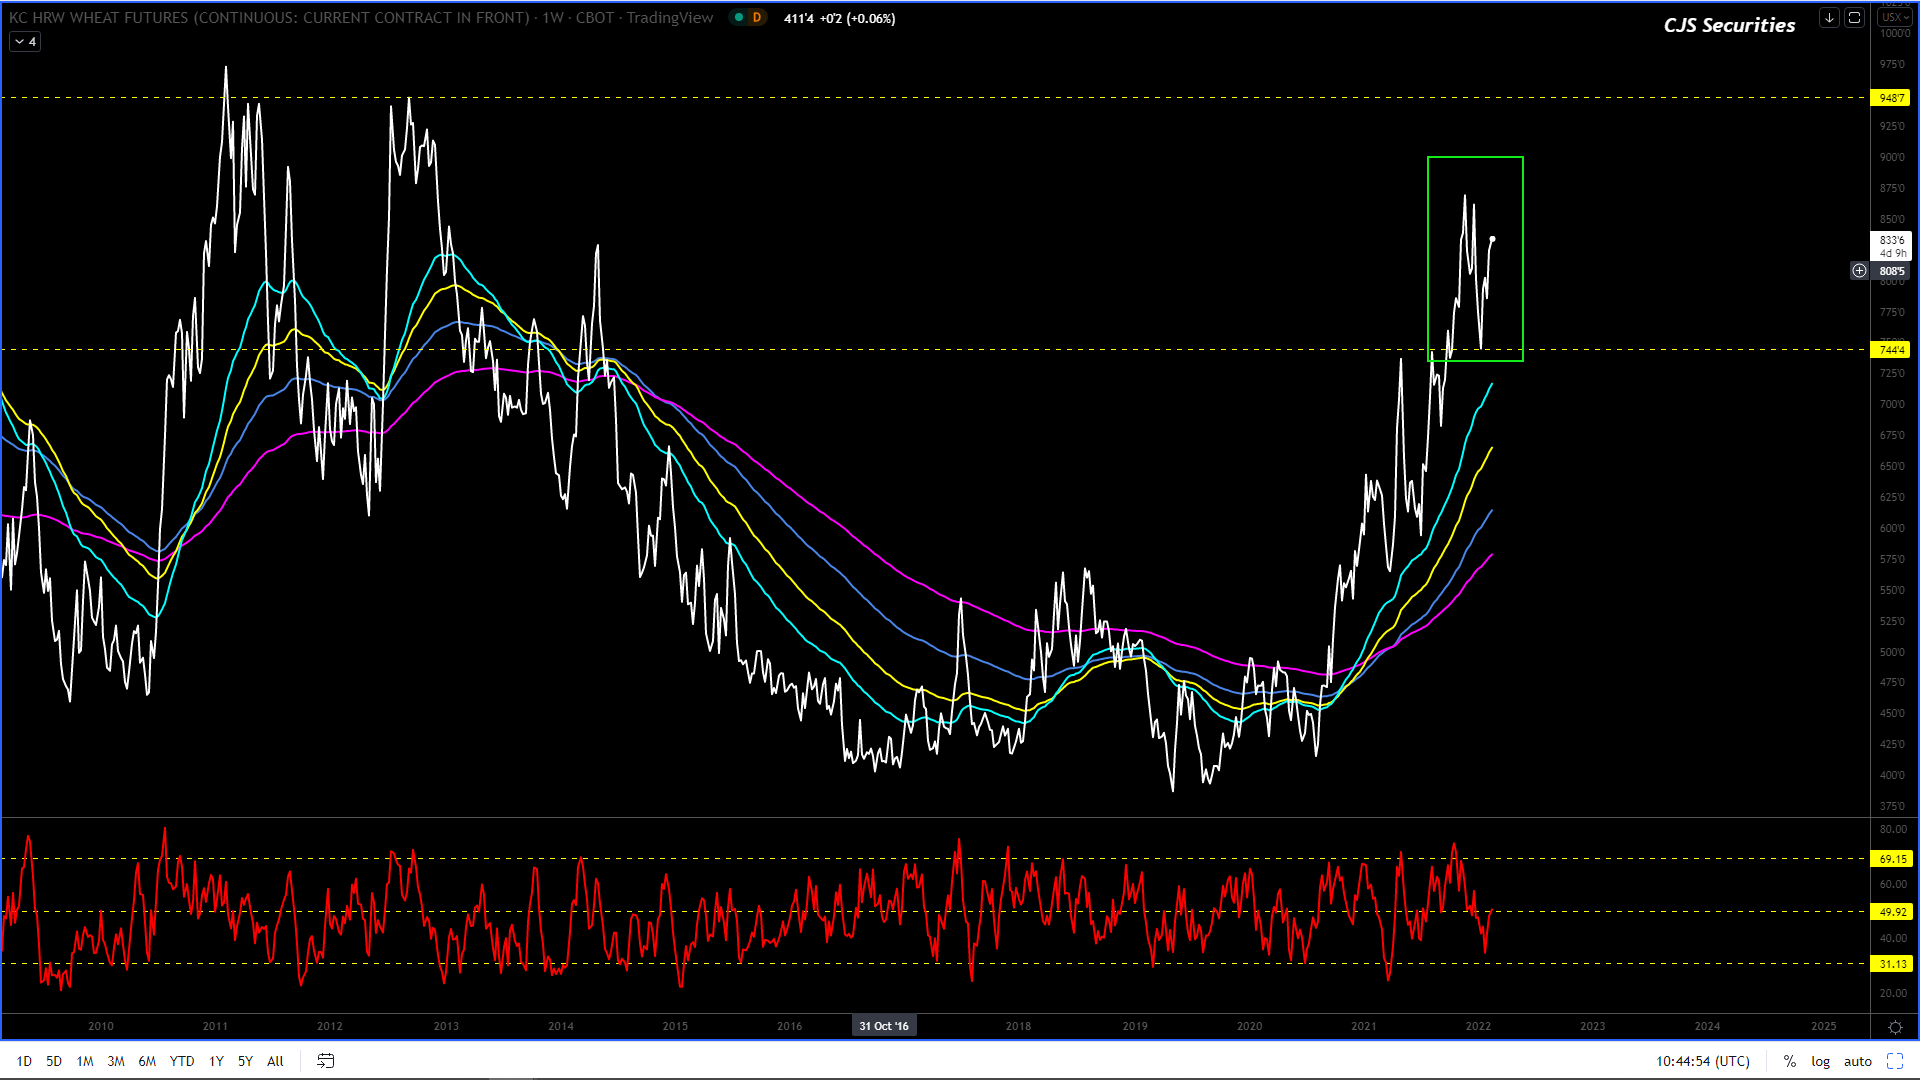
Weekly KC Wheat Continuous Close
The only thing I can add to the below is that I would now put in a stop profit on a daily close under $8.04.
I like this chart and would be looking at buying a move sub $8.00 – $7.44 as I can see the price heading towards $9.50 before making a significant correction! – this is aging really well, especially since the chart turned around at $7.44.
Keep your eyes on Corn VS Wheat as corn has limited upside, IMO.
An unwinding of the spread could give wheat the kick we require.
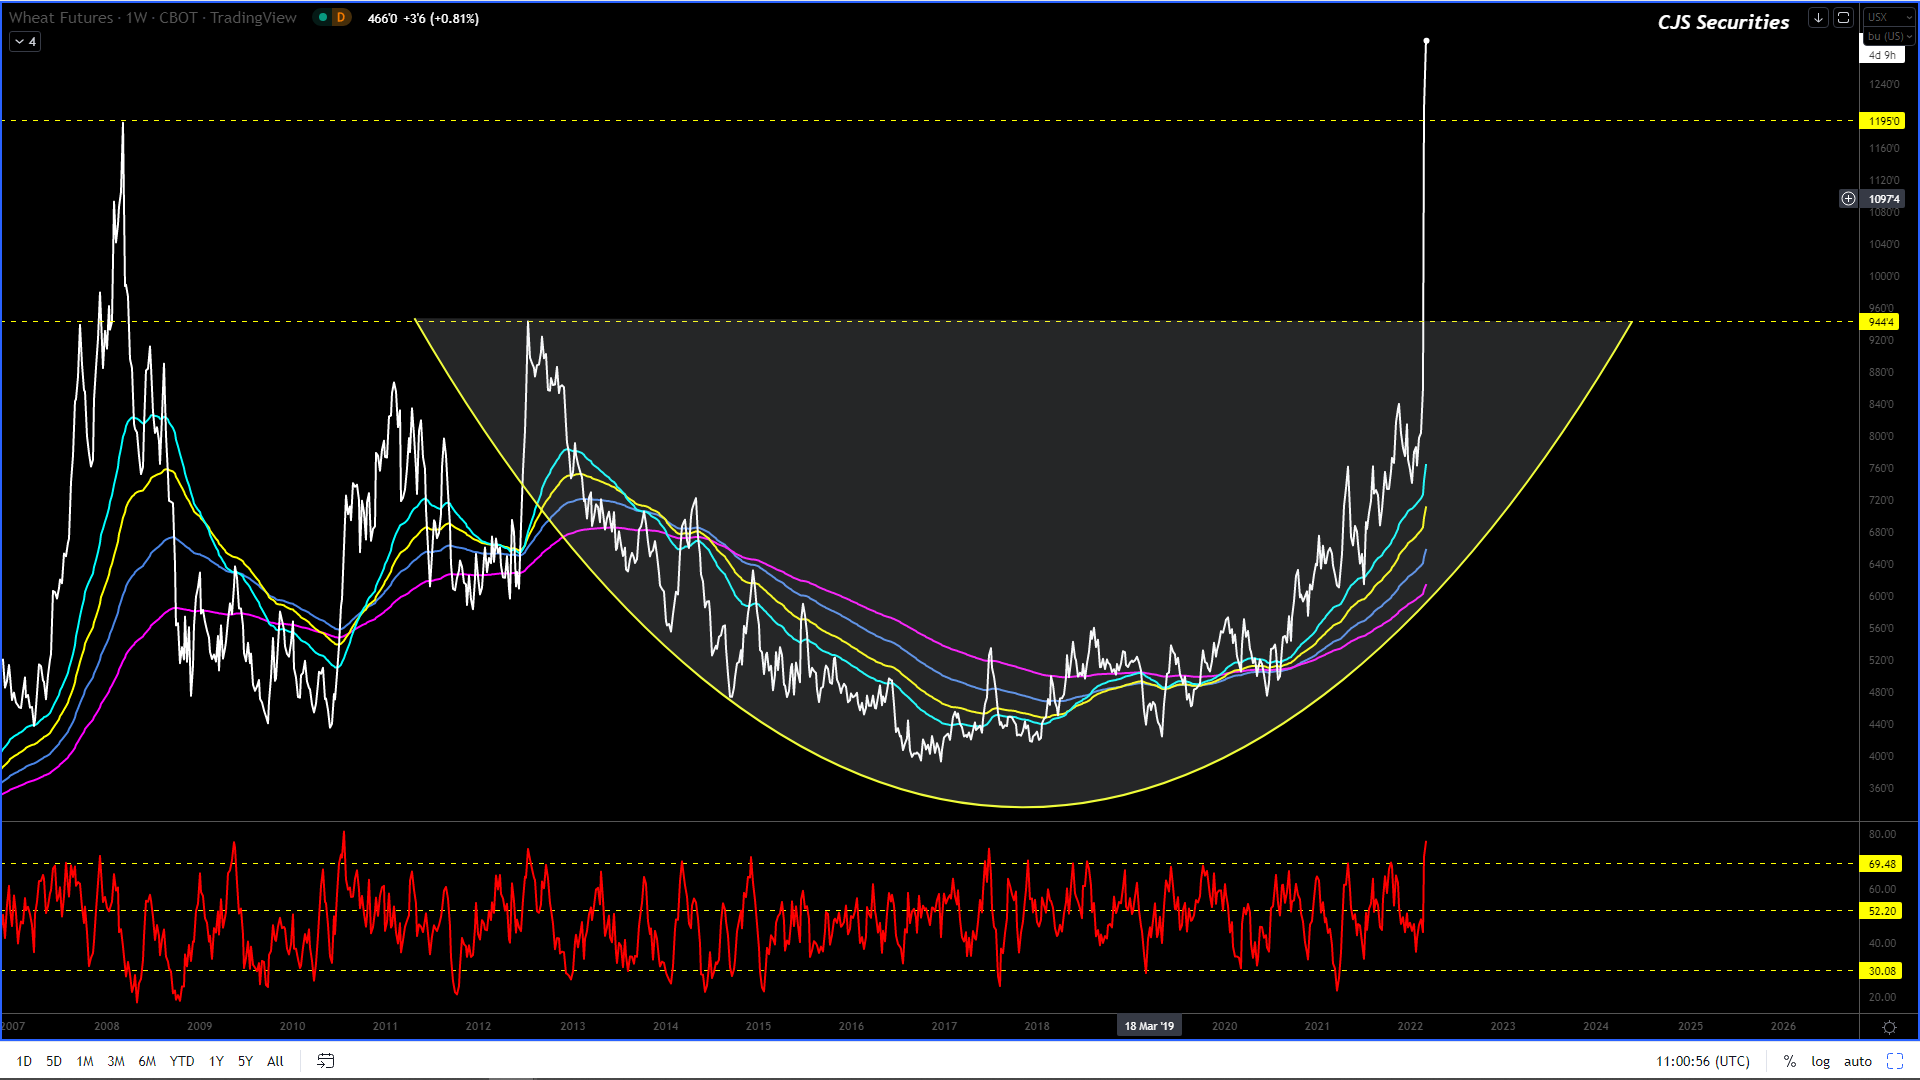
Weekly Chicago SRW Wheat Continuous
The only thing I can add to the below is that I would now put a stop profit on a daily close under $7.86.
I like this chart and would be looking at buying at best down to $7.43 as I can see the price heading towards $9.44 before making a significant correction! – another call aging well.
I truly feel that from here, the ST / MT low is in.
Daily Close KC Wheat v Chicago SRW Continuous Close
Selling the rally over $0.30 has me sweating and the only thing helping me keep it together right now is that market is grossly overbought.
Weekly SAF Wheat Continuous Close
The below is still in play but has not confirmed yet, as the chart will need to clear all the MA’s to break higher.
The chart seems to be making a decent correction that should rally over R600 higher within the next ten weeks (it has STILL not broken higher yet).
A rally of this nature would be considered a selling opportunity.
Daily Matif Wheat Continuous Close
I am starting to like
what I see and I am now a buyer of this chart with a stop under €260.00.
We are now at the precipice of whether or not Russia will invade Ukraine.
Should the invasion take place we should see ST risk off trading followed by more strength in the ZAR.
The below commentary remains well and truly intact for now.
What I see is R11.50 over the next 17 months.
I am convinced that the ZAR is in a multi-year corrective phase vs. the USD and that from today on, all upward spikes on this chart are well worth a short!
This chart could easily have a leg higher and trade toward the R16.77 level in the coming weeks.
This could be attributed to Russia invading the Ukraine or China invading Taiwan or Iran attacking Israel or all three, which should provide a risk – off environment, causing a quick and painful weakening of the ZAR.
An event of this nature should be seen for exactly what it is, an opporutunity to sell the USD and buy the ZAR.
Until then, the range is likely to be R14.88 – R15.50 and I would seriously consider owning the bottom of the range! – hopefully some of you bought the sub R15’s, even as just a ST hedge against war.
Dollar/Rand Daily Candle
#No Change in commentary
Based on the charts current formation, we would only look to get long sub R15.05 scale down to the R14.80 level. – hope you bought some USD last week.
The daily chart fits into my weekly view.
I want a last leg higher into the R16’s to complete the chart.(but what I want does not count)
I cannot stress enough how important patience is and keeping your mind clear as emotions are sure to get the better of many this year.
Dollar/Rand 240 min Candle
Currently, there is no decent trade that I can see on an RR basis, as I always require a 3/1 ratio.
However, this chart’s current formation leads me to believe that we will see a trade toward R15.70 and potentially higher.
So, I have decided to get long and stay long until either R15.70 or until I am stopped out through R15.00!
Euro/USD Weekly Close
This chart has made a decent spike at $1.1142 and this appears now to be a strong weekly close V bottom.
In the ST, should we see this chart move back over $1.450 – $1.16!– This is currently underway.
I would be looking a buying the Euro on a dip south of $1.1300.
US Dollar Index Weekly Candle
#No Change in commentary
I am changing my view until further notice, and I think we are headed back to the 88.00 level over the next few months.
The chart’s upside momentum has failed. IMO
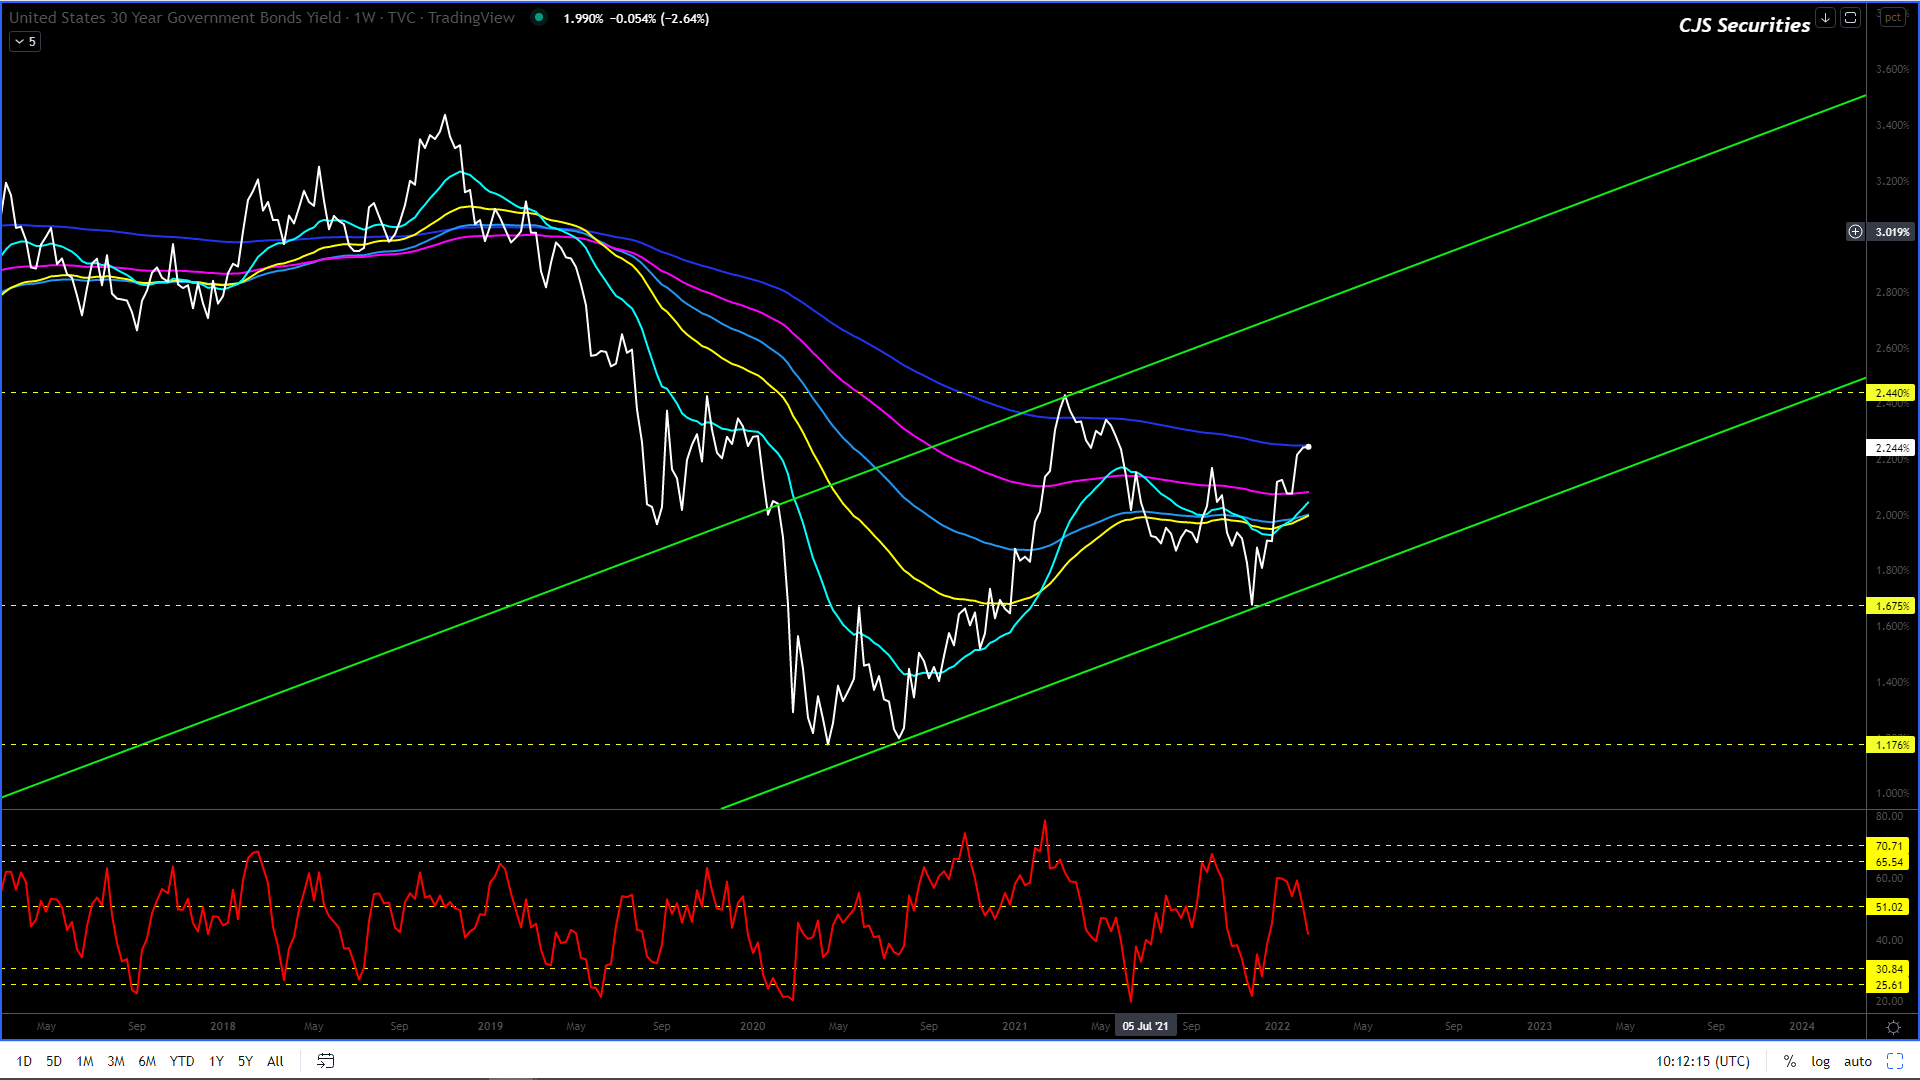
SA Government Bond 30 Year Yield Daily Close
The chart has now made a very solid base around the 10.30% level.
The chart remains range-bound but we feel the move higher toward the top of the range at 11.40% is on the cards before looking to start a severe leg lower to sub 9.00%.
I cannot add any pearls of wisdom to the commentary from last week as the weekly close has hardly changed and the market has likely priced in more carnage.
The chart remains bullish, but looking at where the weekly close and where the oscillator is I would advise taking profits for those that are long, because when the music stops playing and believe me it will, you don’t want to be the one without a chair!
If you have not thought about shipping in some puts, the time has come.
Please do not get married to your long position, it will only end in a bitter divorce.
240 Min CBOT January 22 Soybean Candle Chart
Two very simples points on this chart:
#1. The spike looks shocking and the chart will need to trade up soon to negate it.
#2. The oscillator has quickly come off overbought levels.
I have no strong view other than I would love to buy a deep pullback.
Board Crush Continuous Daily Close
The volatility on this chart is ridiculous and although we have been patiently waiting to buy a dip to the previous low at $1.22, we are now rather going to sit out a week or three.
The oscillator remains near oversold levels.
Oil Share Continuous Daily Close
#No Change in Commentary
We have not been stopped on the below view but will put in a stop under 40% as this chart is now highly overbought!
“After kicking off extremely oversold levels and making a new MT low, the chart remains at oversold levels and another leg lower to 42% will get me long. – lets see how this plays out.”
Weekly SAF Soy Continuous Close
Congratulations to those the rode this trade into the sunset.
Now is the time to sit back and wait for the next opportunity as its not every day that you will make R500 + on a trade.
Weekly SAF Suns Continuous Close
This chart is not a true reflection of the Suns market, and come closer to harvest it will likely print R8000.
Weekly CBOT Soy Oil Continuous Close
The below has not changed, and we are riding this one into the sunset.
I seem to have this wrong and although we are long, this chart is now grossly oversold on a weekly basis and we need to dig deep and buy more scale down with a stop under $0.52 as the rally is coming, even if its only a kick!
I feel the correction is done (it had another leg lower), and all the pullbacks from here are buying opportunities with upside targets between $0.85 -$0.89! – the correction was obviously not done.
I almost feel that we don’t have enough cash to get as long as we should, buy at best and scale down, this is budget making stuff with sprinkling of retirement!!!! – hope we don’t go broke before retiring.
Weekly CBOT SBM Continuous Close
Nothing
has changed on the weekly chart, but we are happy to stay out until further
notice.
With
the oscillator being where it is, I would be a very nervous short around
current levels.
Another week of what feels like massive volatility but overall not much weekly movement.
For those that have faded the rally to over $6.40, I am with you and firmly believe that if we see a continued rally, the $6.60’s will be the highs. – so far so good, but over $6.72 I would be wrong.
I am convinced that the chart will not turn into a massive bull market from here and that my big picture view is that the following $1.00 move will be lower rather than higher (could be famous last words).
Should my above view be correct this chart could be in for a move back towards the low $5.00’s, before becoming a serious buying opportunity once again.
240 Min March 22 Corn Candle Chart Close
I don’t like the gaps and the Massive Spike I am seeing and should we see a move back over the $6.40’s I would bash the market harder than a Piñata on my birthday! – short at $6.60 fingers, toes and all other appendages are crossed for this one.
If my above view is correct, we could be in for a vicious ST bear market.
Think about what move would hurt the most players, and the answer is a move back sub $6.00!
Weekly WM Continuous Close
#No Change in Commentary
People, I cannot emphasize just how strong these WEEKLY CLOSE DOUBLETOPS are and right now, even in the face of high crude and SAM, this chart is not a buy.
Right now IMO any rally back over R3700 would constitute a selling opportunity.
Weekly YM Continuous Close
#No Change in Commentary
This chart has reached its target zone and has made MASSIVE Weekly Close double tops.
The YM chart looks much better than WM currently, and a pullback could well be a buying opportunity, but it looks decidedly like the buy level will only R300 plus lower than where we are now.
Weekly KC Wheat Continuous Close
Honestly there is nothing to add to the below.
I like this chart and would be looking at buying a move sub $8.00 – $7.44 as I can see the price heading towards $9.50 before making a significant correction! – this is aging really well, especially since the chart turned around at $7.44.
Keep your eyes on Corn VS Wheat as corn has limited upside, IMO.
An unwinding of the spread could give wheat the kick we require.
Weekly Chicago SRW Wheat Continuous
The below view seems pretty decent, but we will require a decent weekly close higher than where we are now.
I like this chart and would be looking at buying at best down to $7.43 as I can see the price heading towards $9.44 before making a significant correction! – another call aging well.
I truly feel that from here, the ST / MT low is in.
Daily Close KC Wheat v Chicago SRW Continuous Close
#No Change in Commentary
Gun to the head I would look to sell a rally over $0.30!– the gun is getting closer, and I am not changing my mind!
Weekly SAF Wheat Continuous Close
I still fancy the below commentary to play out, but we will require a decent rally this week or we could be a making a R300 move lower first.
The chart seems to be making a decent correction that should rally over R600 higher within the next ten weeks (it has STILL not broken higher yet).
A rally of this nature would be considered a selling opportunity.
Daily Matif Wheat Continuous Close
This chart is fugly and
volatile and all I can say is stay out!
Another week of will he or wont he invade the Ukraine.
Should the invasion take place we should see ST risk off trading followed by more strength in the ZAR.
The below commentary remains well and truly intact for now.
What I see is R11.50 over the next 17 months.
I am convinced that the ZAR is in a multi-year corrective phase vs. the USD and that from today on, all upward spikes on this chart are well worth a short!
This chart could easily have a leg higher and trade toward the R16.77 level in the coming weeks.
This could be attributed to Russia invading the Ukraine or China invading Taiwan or Iran attacking Israel or all three, which should provide a risk – off environment, causing a quick and painful weakening of the ZAR.
An event of this nature should be seen for exactly what it is, an opportunity to sell the USD and buy the ZAR.
Until then, the range is likely to be R14.88 – R15.50 and I would seriously consider owning the bottom of the range!
Dollar/Rand Daily Candle
Based on the charts current formation, we would only look to get long sub R15.05 scale down to the R14.80 level.
The daily chart fits into my weekly view.
I want a last leg higher into the R16’s to complete the chart.(but what I want does not count)
I cannot stress enough how important patience is and keeping your mind clear as emotions are sure to get the better of many this year.
Dollar/Rand 240 min Candle
There is nothing to
say that will change the below outlook.
This chart is middle
of the range but can surprise with a last leg lower before looking to trade
higher.
And it’s with this in
mind that I am happy to hang back another week and let the chart play
out.
Euro/USD Weekly Close
#No Change in commentary
This chart remains well within the triangle range, while $1.1250 remains MASSIVE support.
In the ST, should we see this chart move back over $1.450 – $1.16!– This is currently underway.
US Dollar Index Weekly Candle
#No Change in commentary
I am changing my view until further notice, and I think we are headed back to the 88.00 level over the next few months.
The chart’s upside momentum has failed. IMO
SA Government Bond 30 Year Yield Daily Close
The chart has now made a very solid base around the 10.30% level.
The chart remains range-bound, and all I can add is that the top of the range (11.40%ish) will be a fantastic buy as the more significant formation is starting to appear more and more like a consolidation for a severe leg lower.
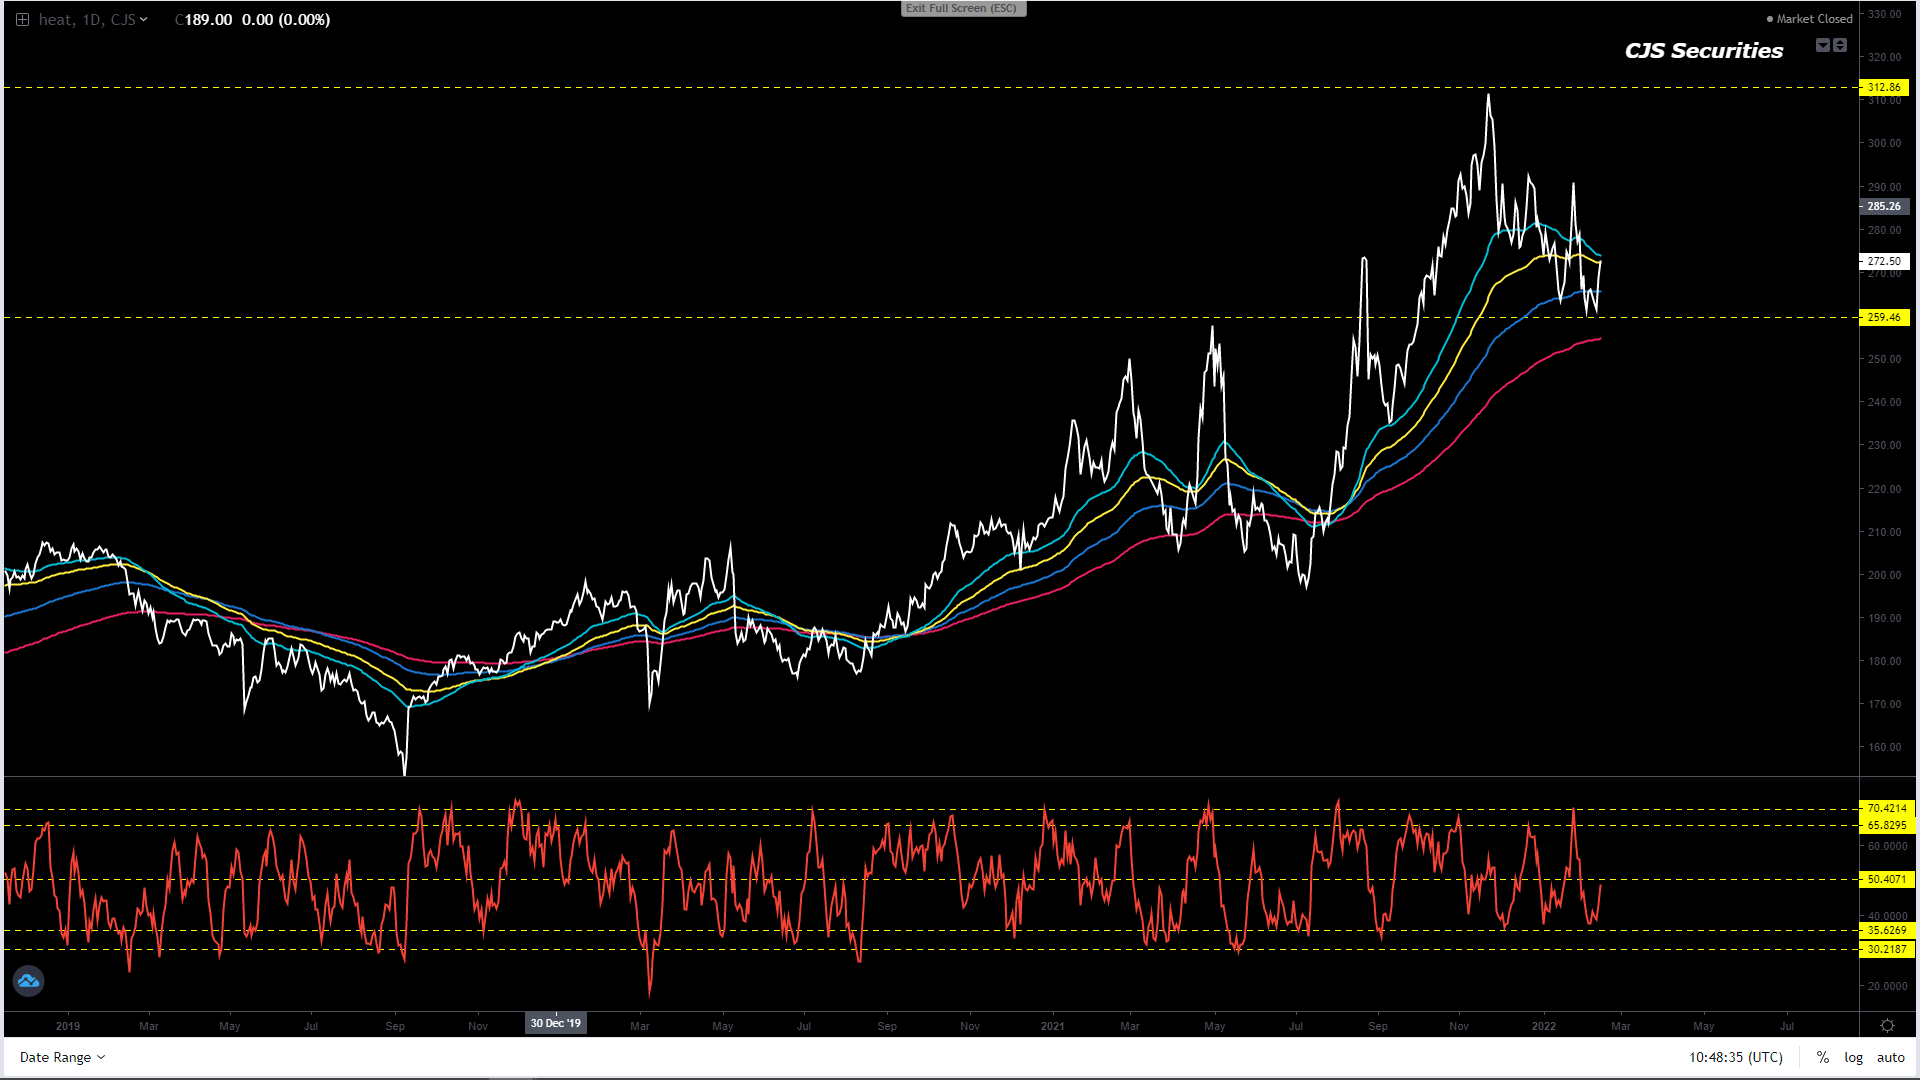
The chart remains bullish, but looking at where the weekly close and where the oscillator is I would advise taking profits for those that are long, because when the music stops playing and believe me it will, you don’t want to be the one without a chair!
If you have not thought about shipping in some puts, the time has come.
Please do not get married to your long position, it will only end in a bitter divorce.
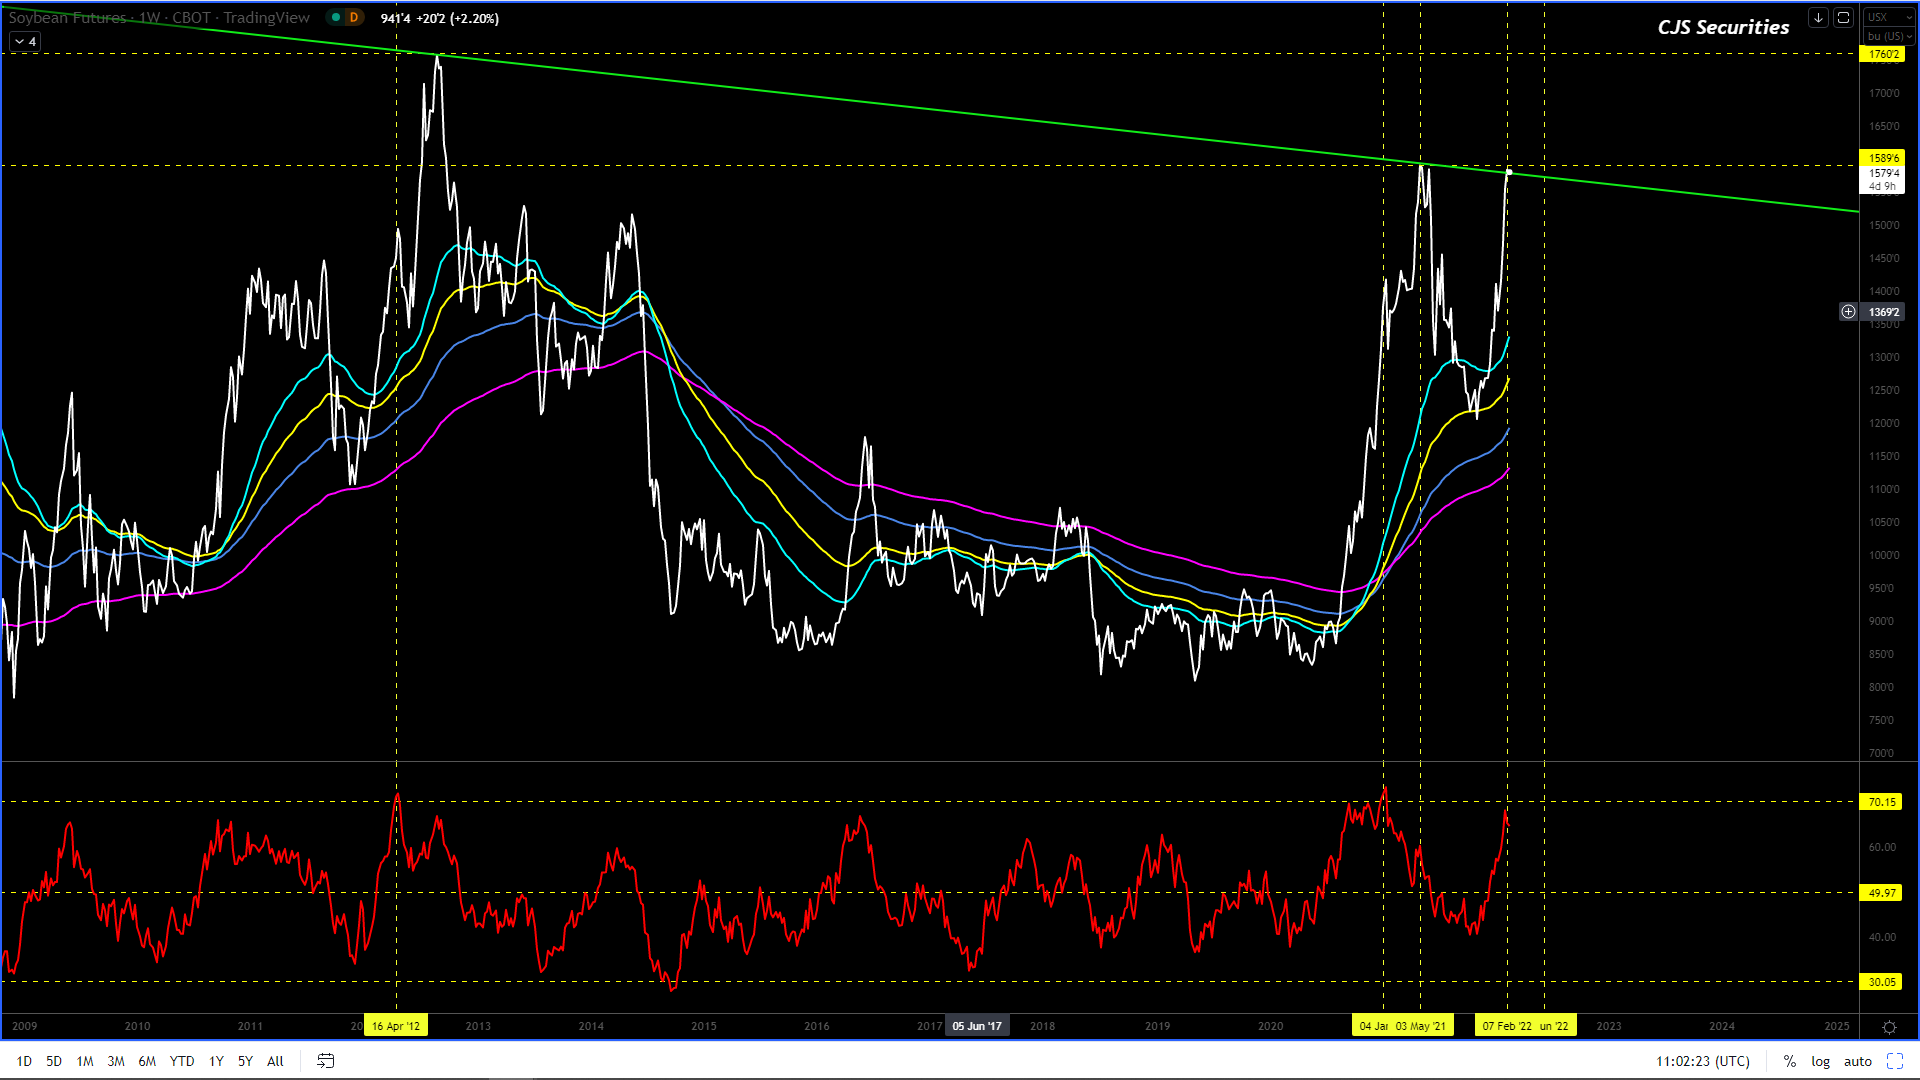
240 Min CBOT January 22 Soybean Candle Chart
The 240 min chart can continue to rally, I don’t like the gaps and the angle of attack, and although this chart should trade higher, I fear heights and would happily take profits on longs and enjoy the chaos.
I have no definitive levels to get involved and hence I am happy on the side lines.
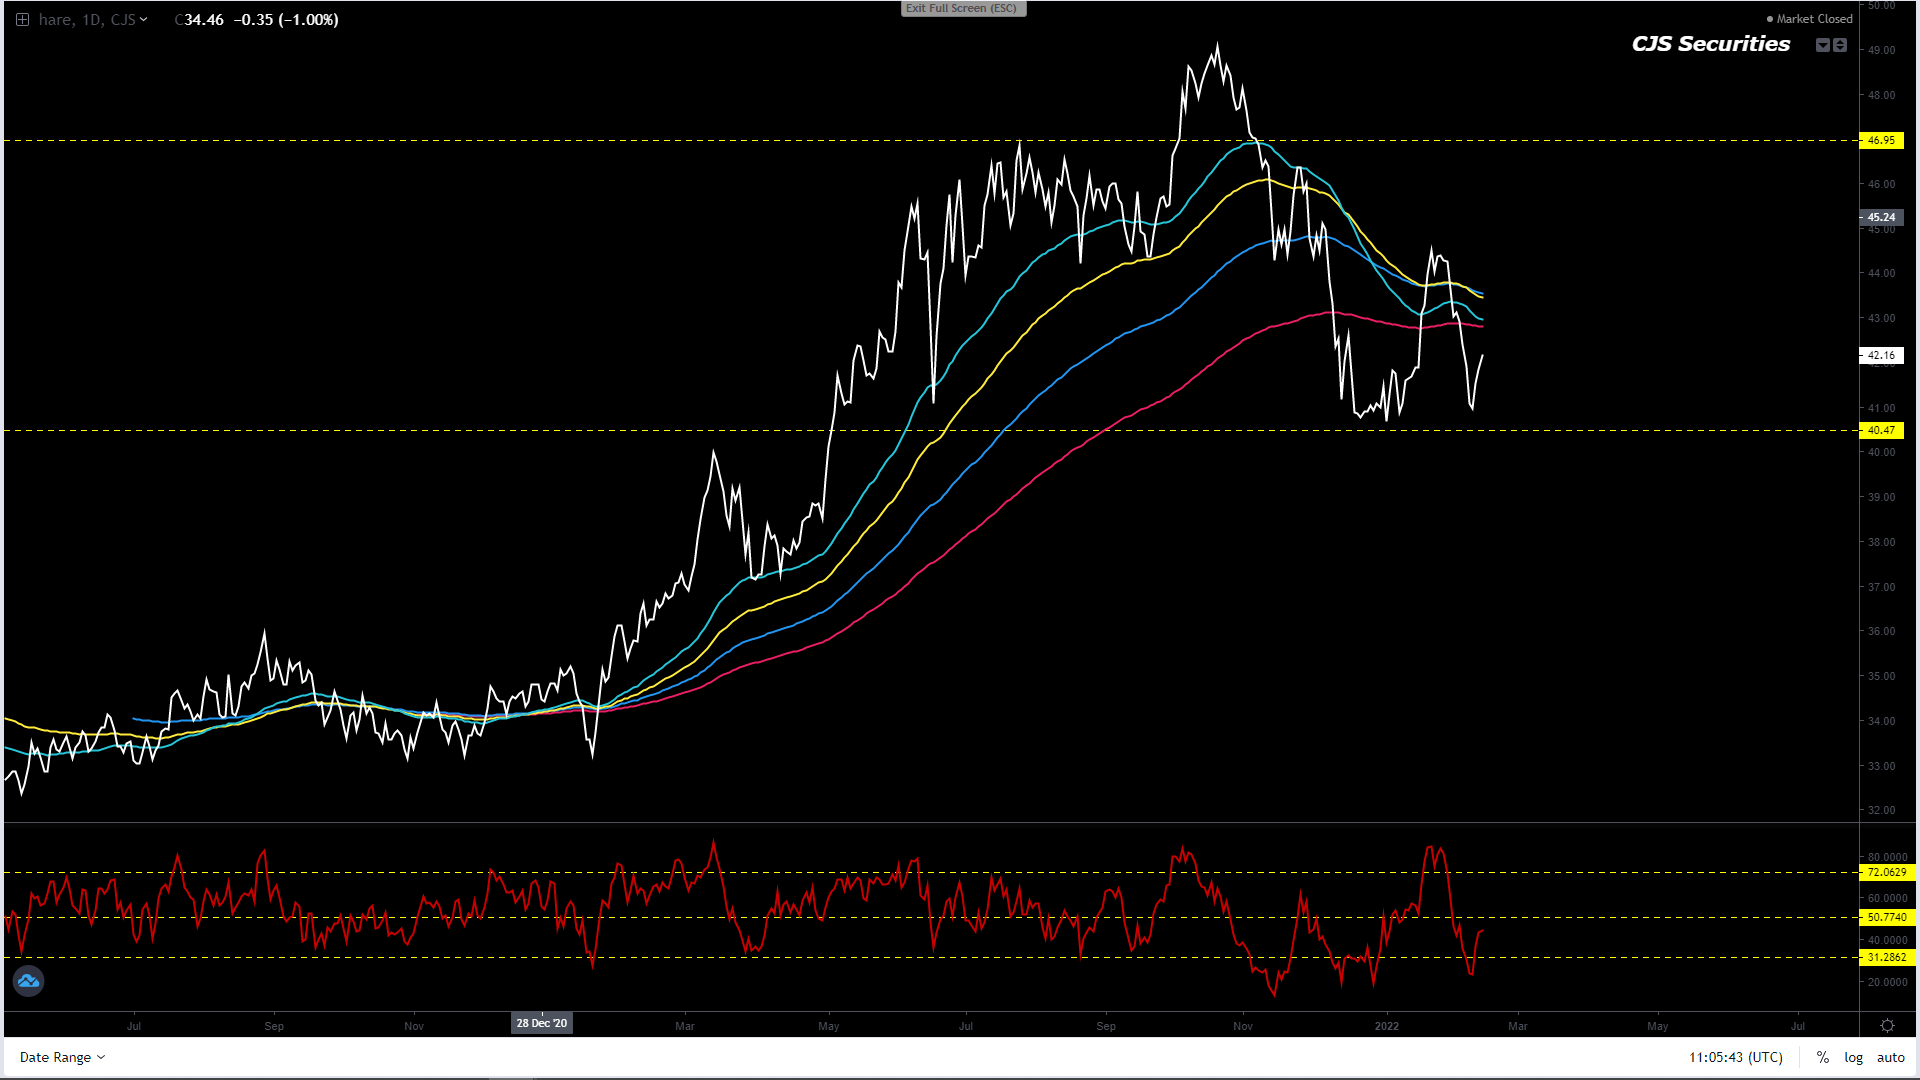
Board Crush Continuous Daily Close
This chart remains wild.
We patiently wait to buy a dip to the previous low at $1.22.
The chart is nearing oversold levels.
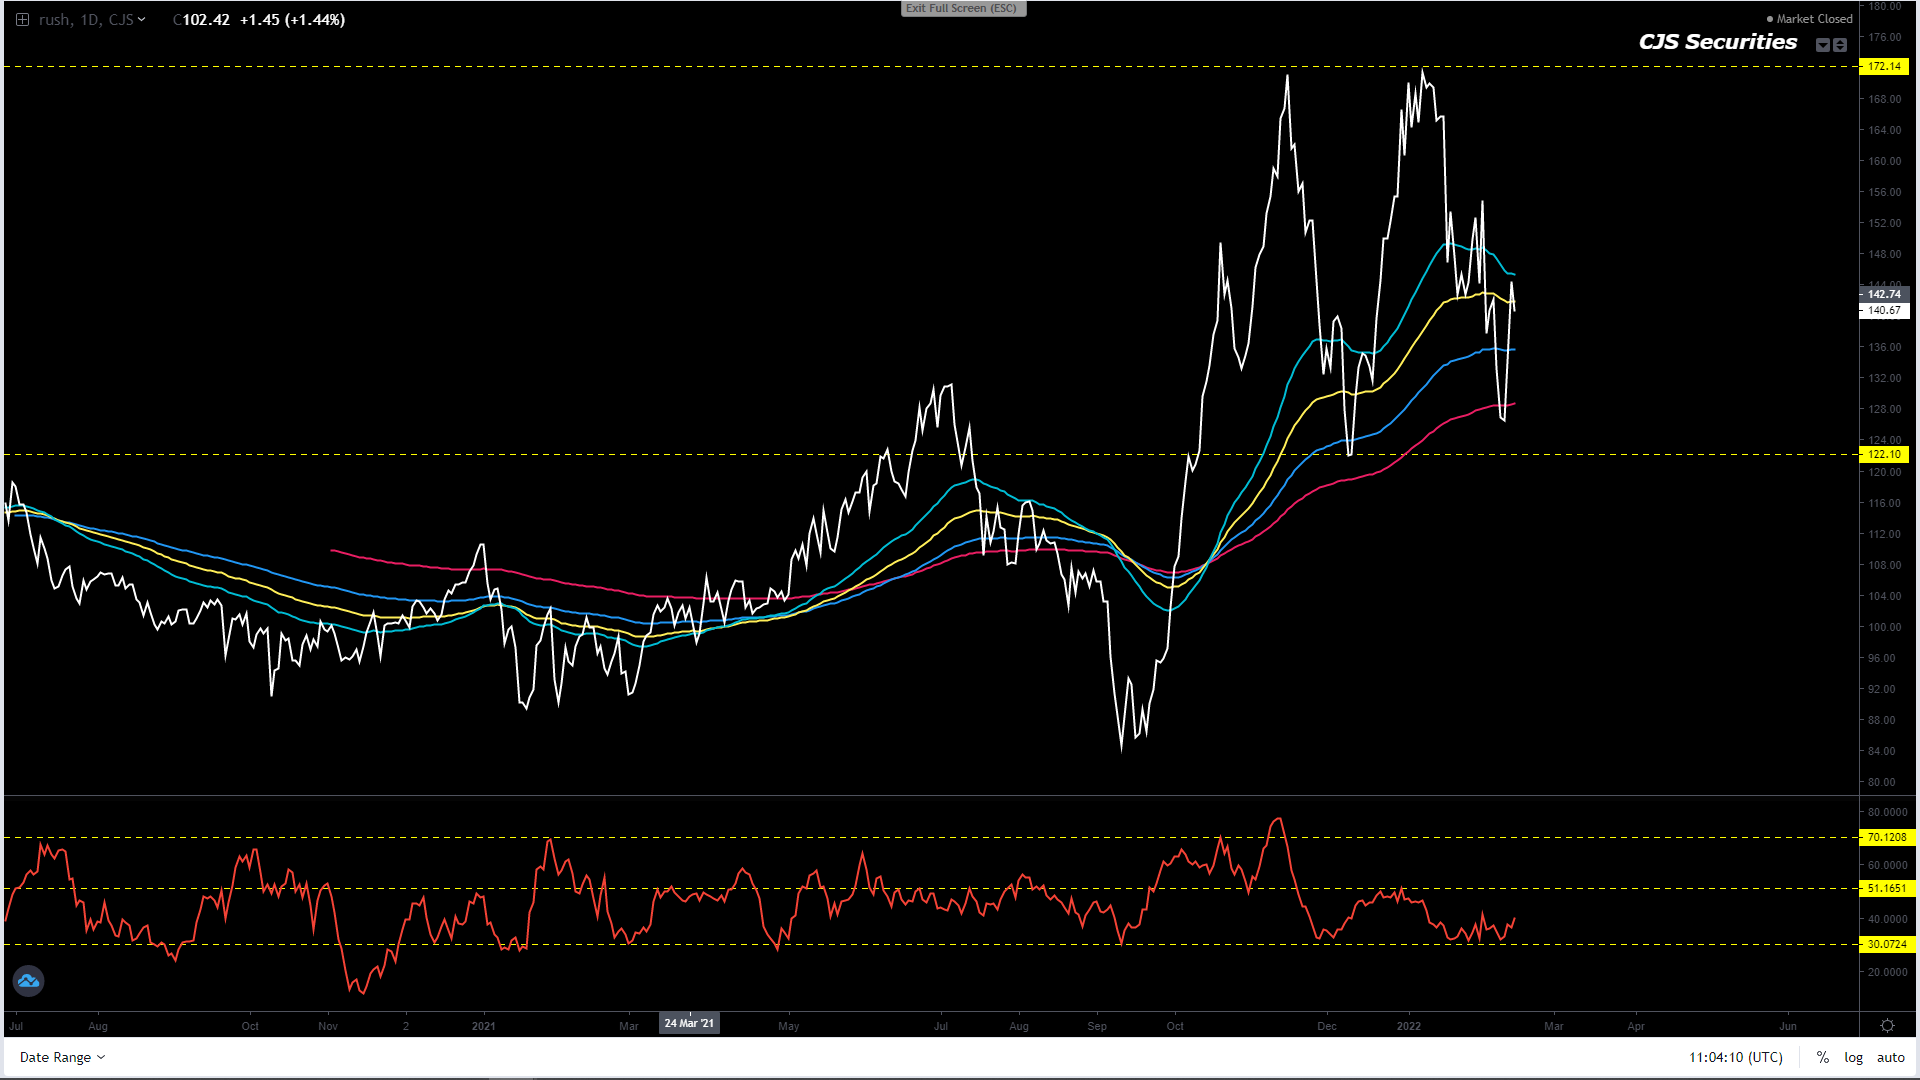
Oil Share Continuous Daily Close
#No Change in Commentary
We have not been stopped on the below view but will put in a stop under 40% as this chart is now highly overbought!
“After kicking off extremely oversold levels and making a new MT low, the chart remains at oversold levels and another leg lower to 42% will get me long. – lets see how this plays out.”
Weekly SAF Soy Continuous Close
To follow up on the below commentary, I can add that I would now take profit on my remaining longs.
I would take 50% of the cash and ride the balance as this chart still has decent upside in the coming weeks.
This chart looks great, and I expect a move to over R8000 in the coming weeks! – this played out very well.
Weekly SAF Suns Continuous Close
This chart is not a true reflection of the Suns market, and come closer to harvest it will likely print R8000.
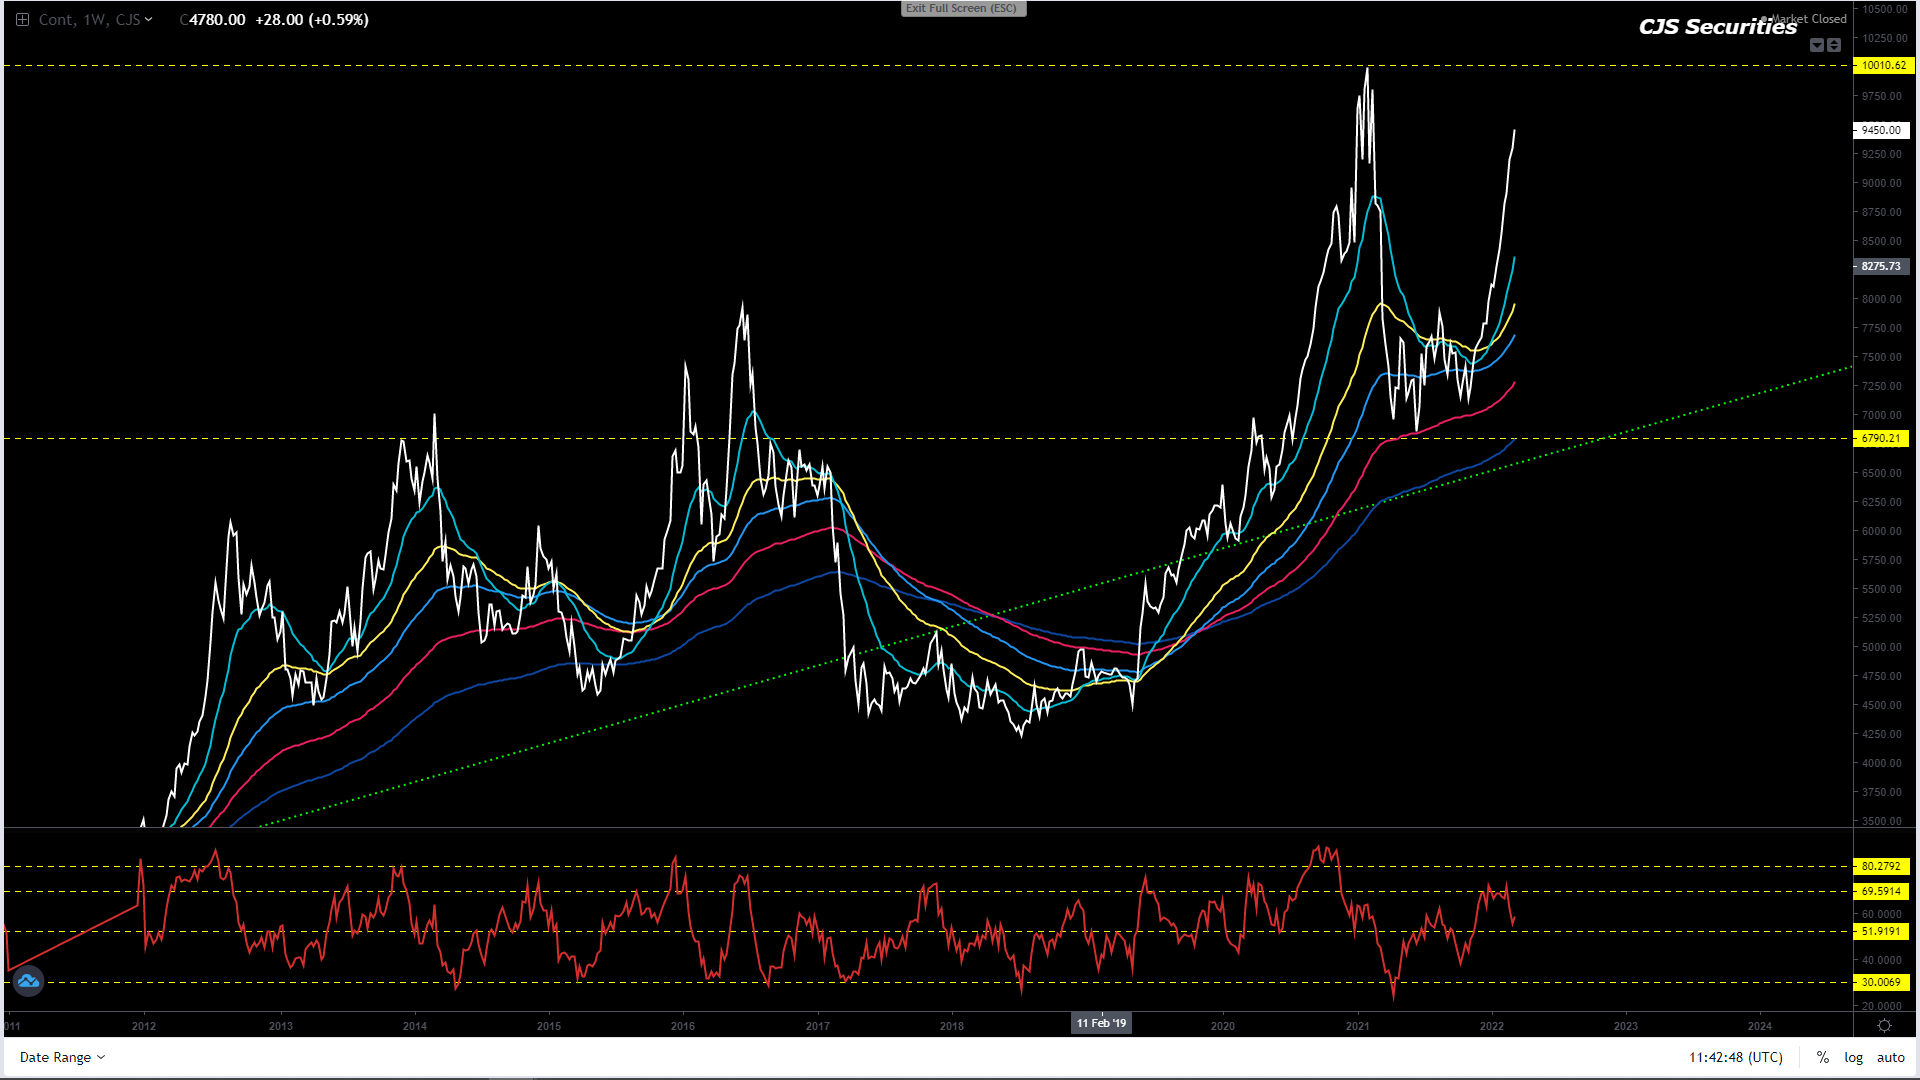
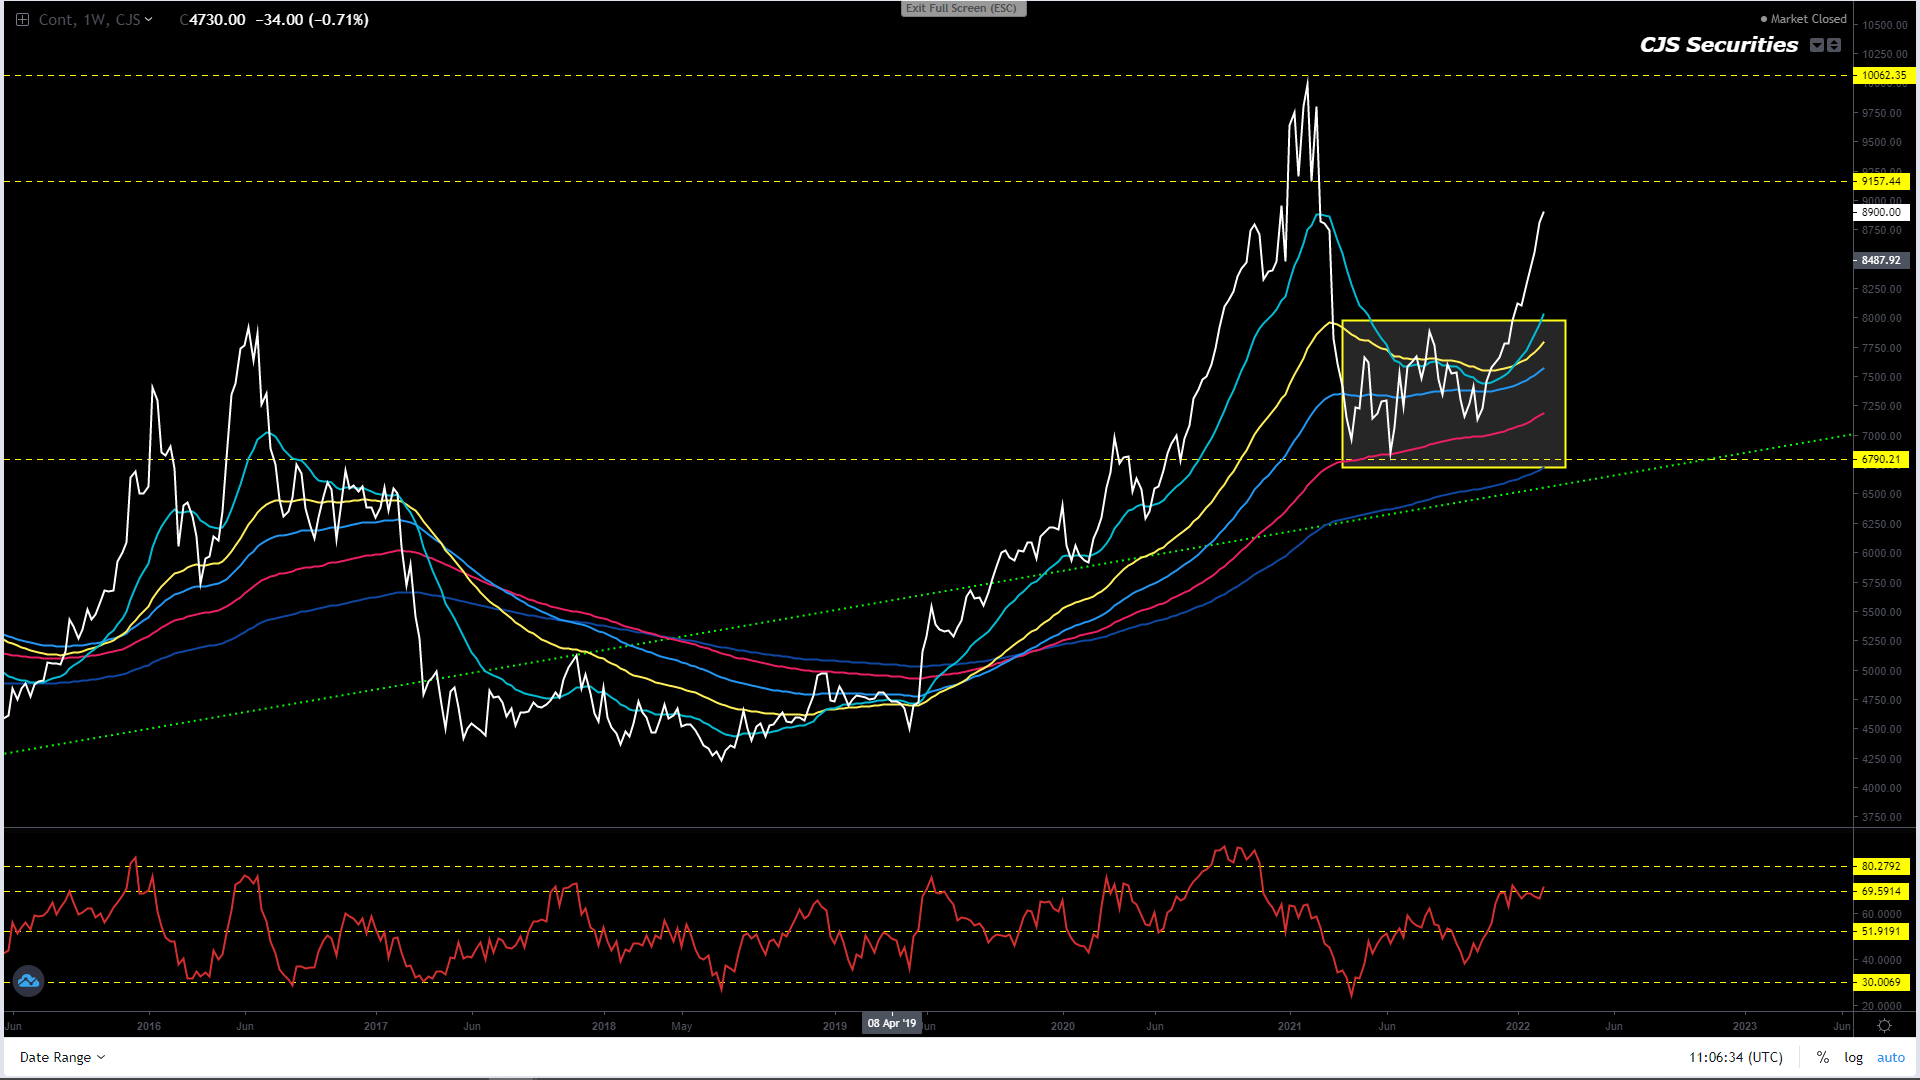
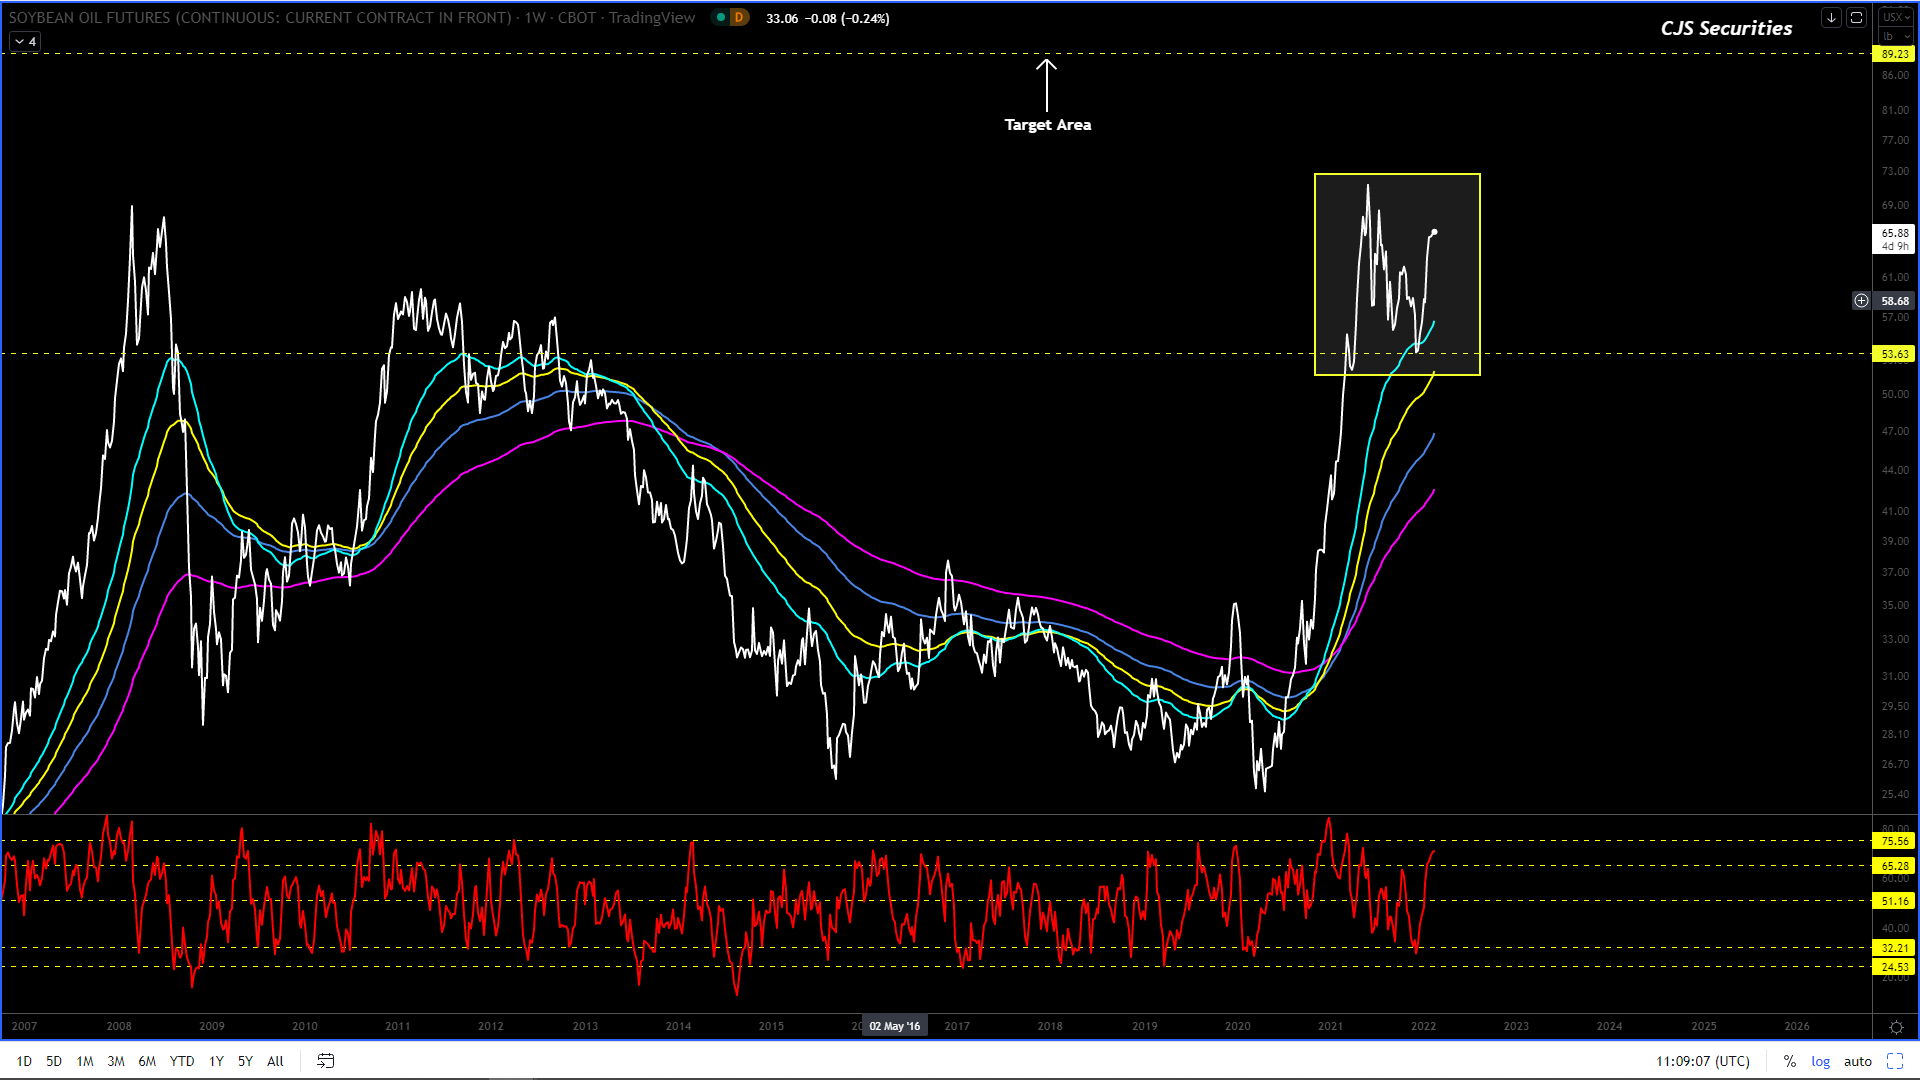
Weekly CBOT Soy Oil Continuous Close
The below has not changed, and we are riding this one into the sunset.
I seem to have this wrong and although we are long, this chart is now grossly oversold on a weekly basis and we need to dig deep and buy more scale down with a stop under $0.52 as the rally is coming, even if its only a kick!
I feel the correction is done (it had another leg lower), and all the pullbacks from here are buying opportunities with upside targets between $0.85 -$0.89! – the correction was obviously not done.
I almost feel that we don’t have enough cash to get as long as we should, buy at best and scale down, this is budget making stuff with sprinkling of retirement!!!! – hope we don’t go broke before retiring.
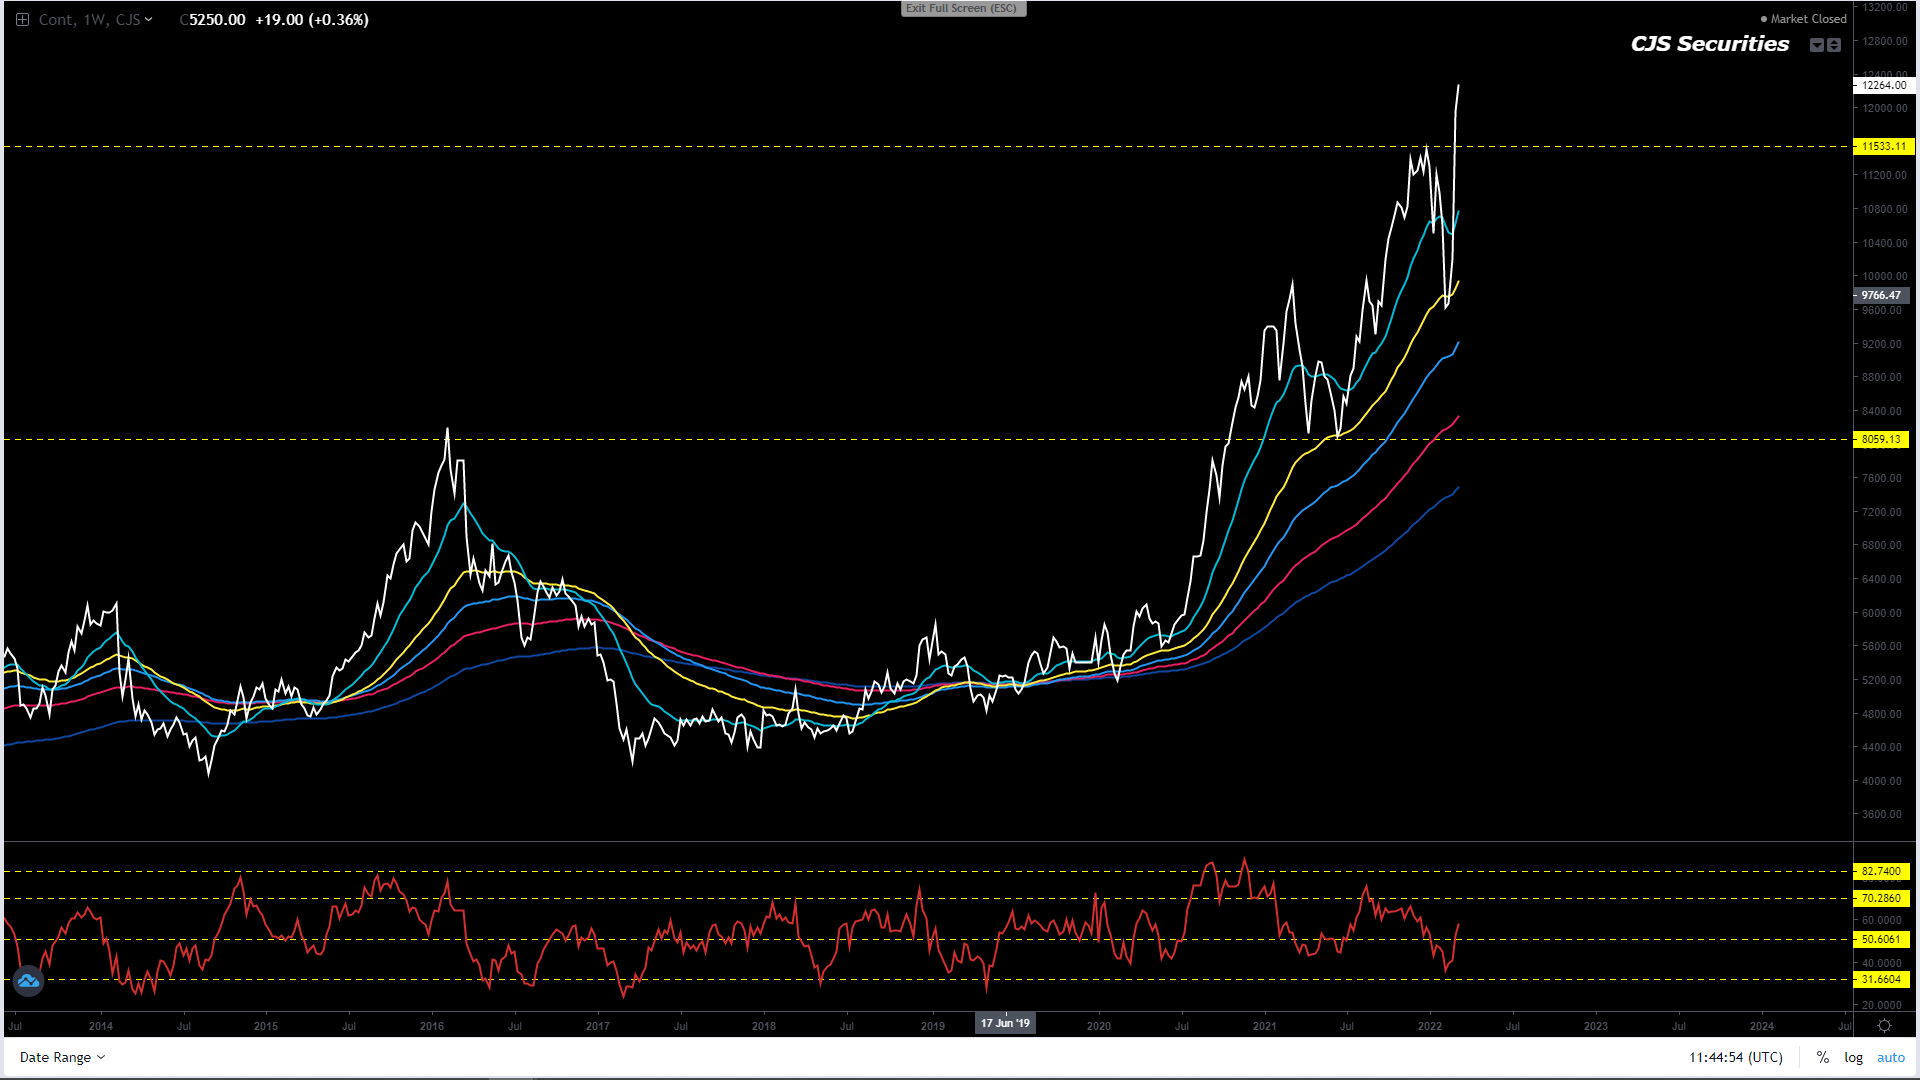
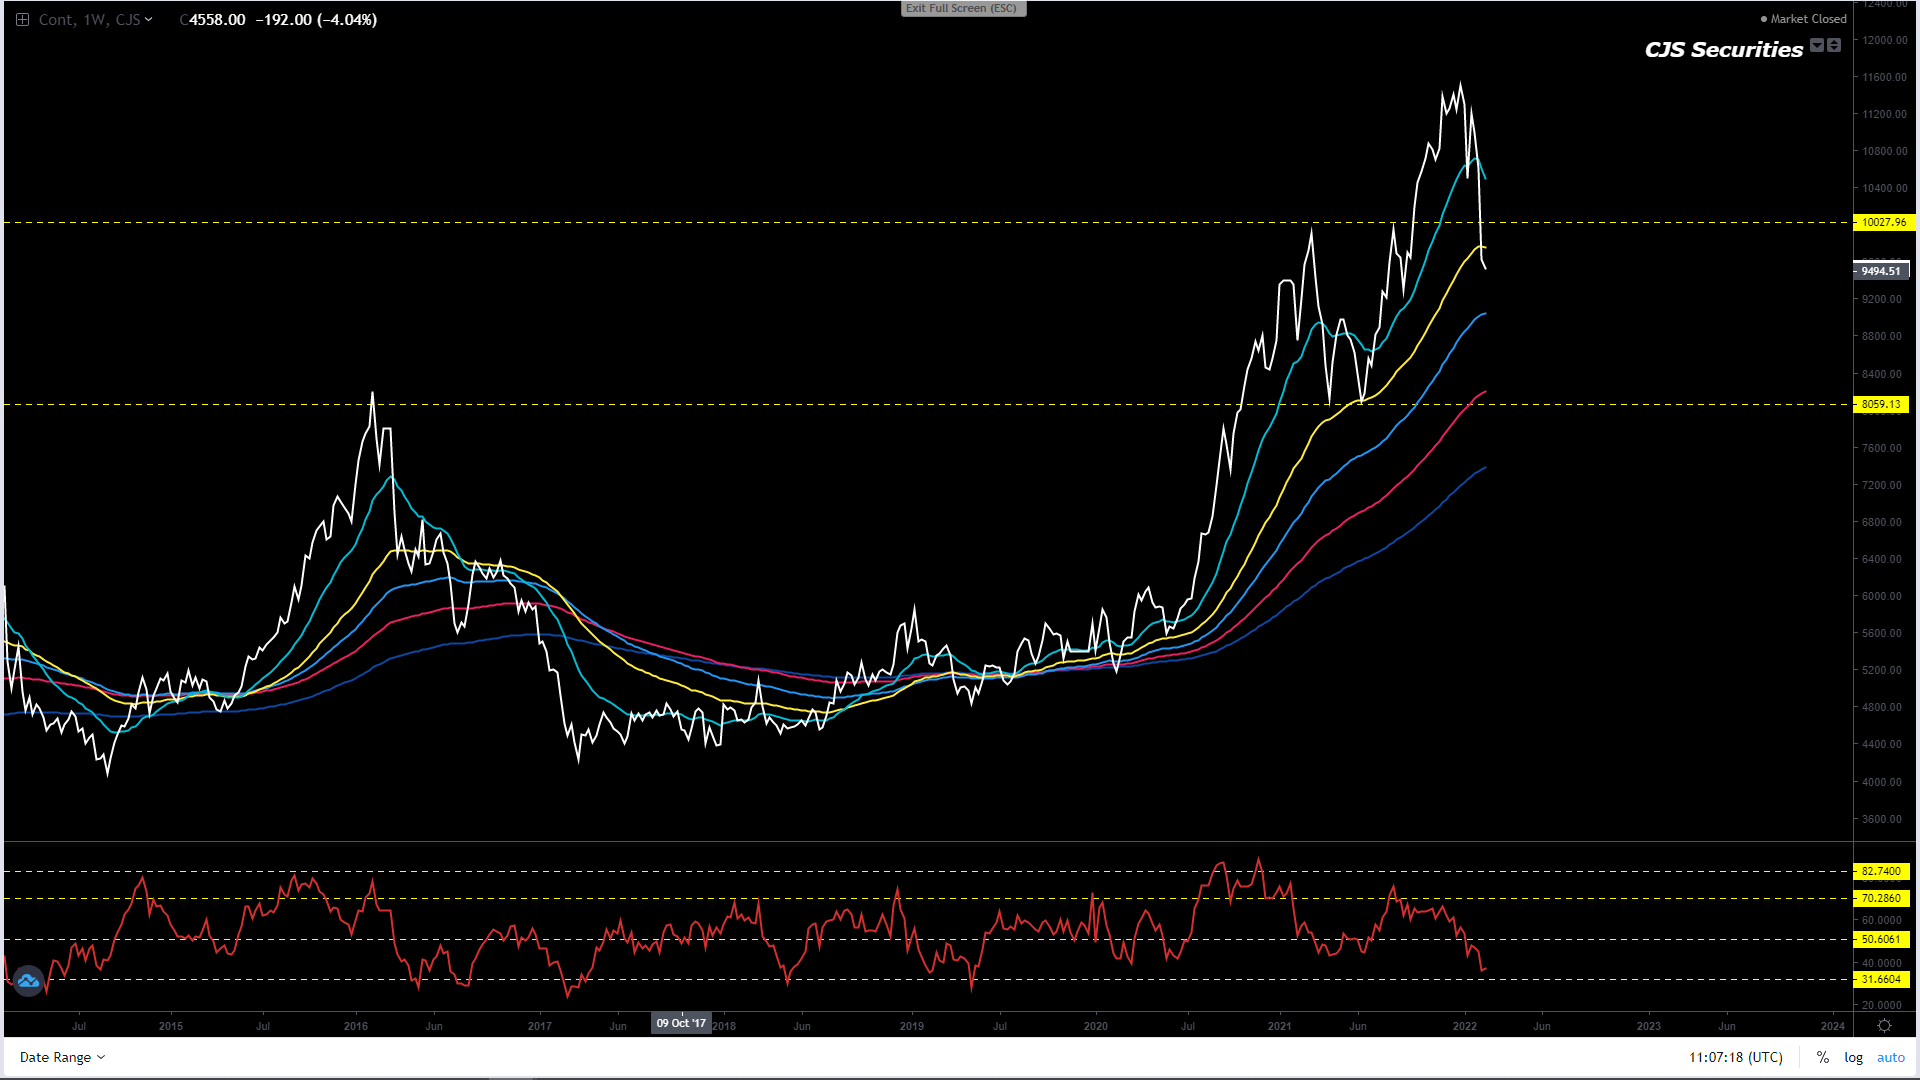
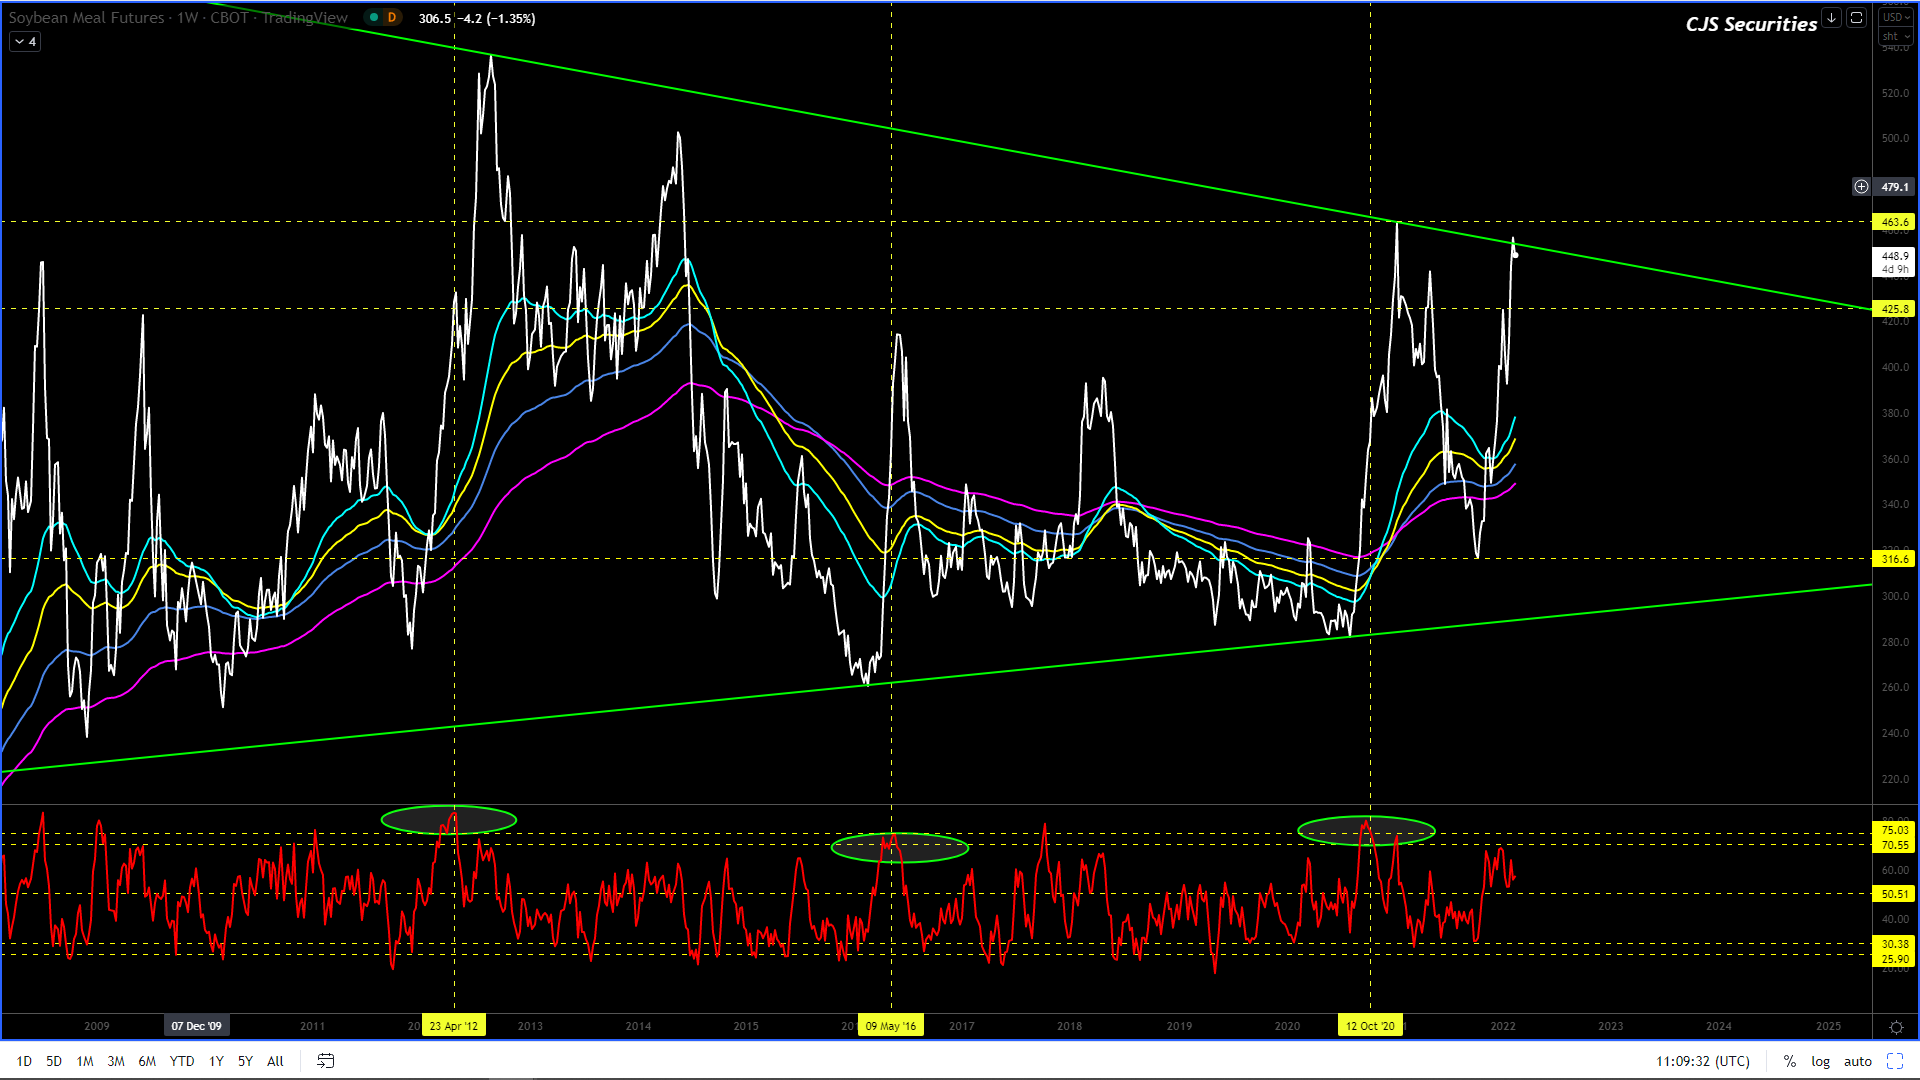
Weekly CBOT SBM Continuous Close
To everyone who is square and made some dark ash, stay square until
further notice.
To the rest that are short, this chart is designed to get you long at
the top, take about 5 years off your life and finally take most of your cash.
Beware!