Good Afternoon all.
After making my bold
prediction yesterday the Dollar Rand will trade towards the R11.50 level over
the next 17 – 24 months, I have been inundated with messages asking me why and
hence I have decided to send this out to explain my view.
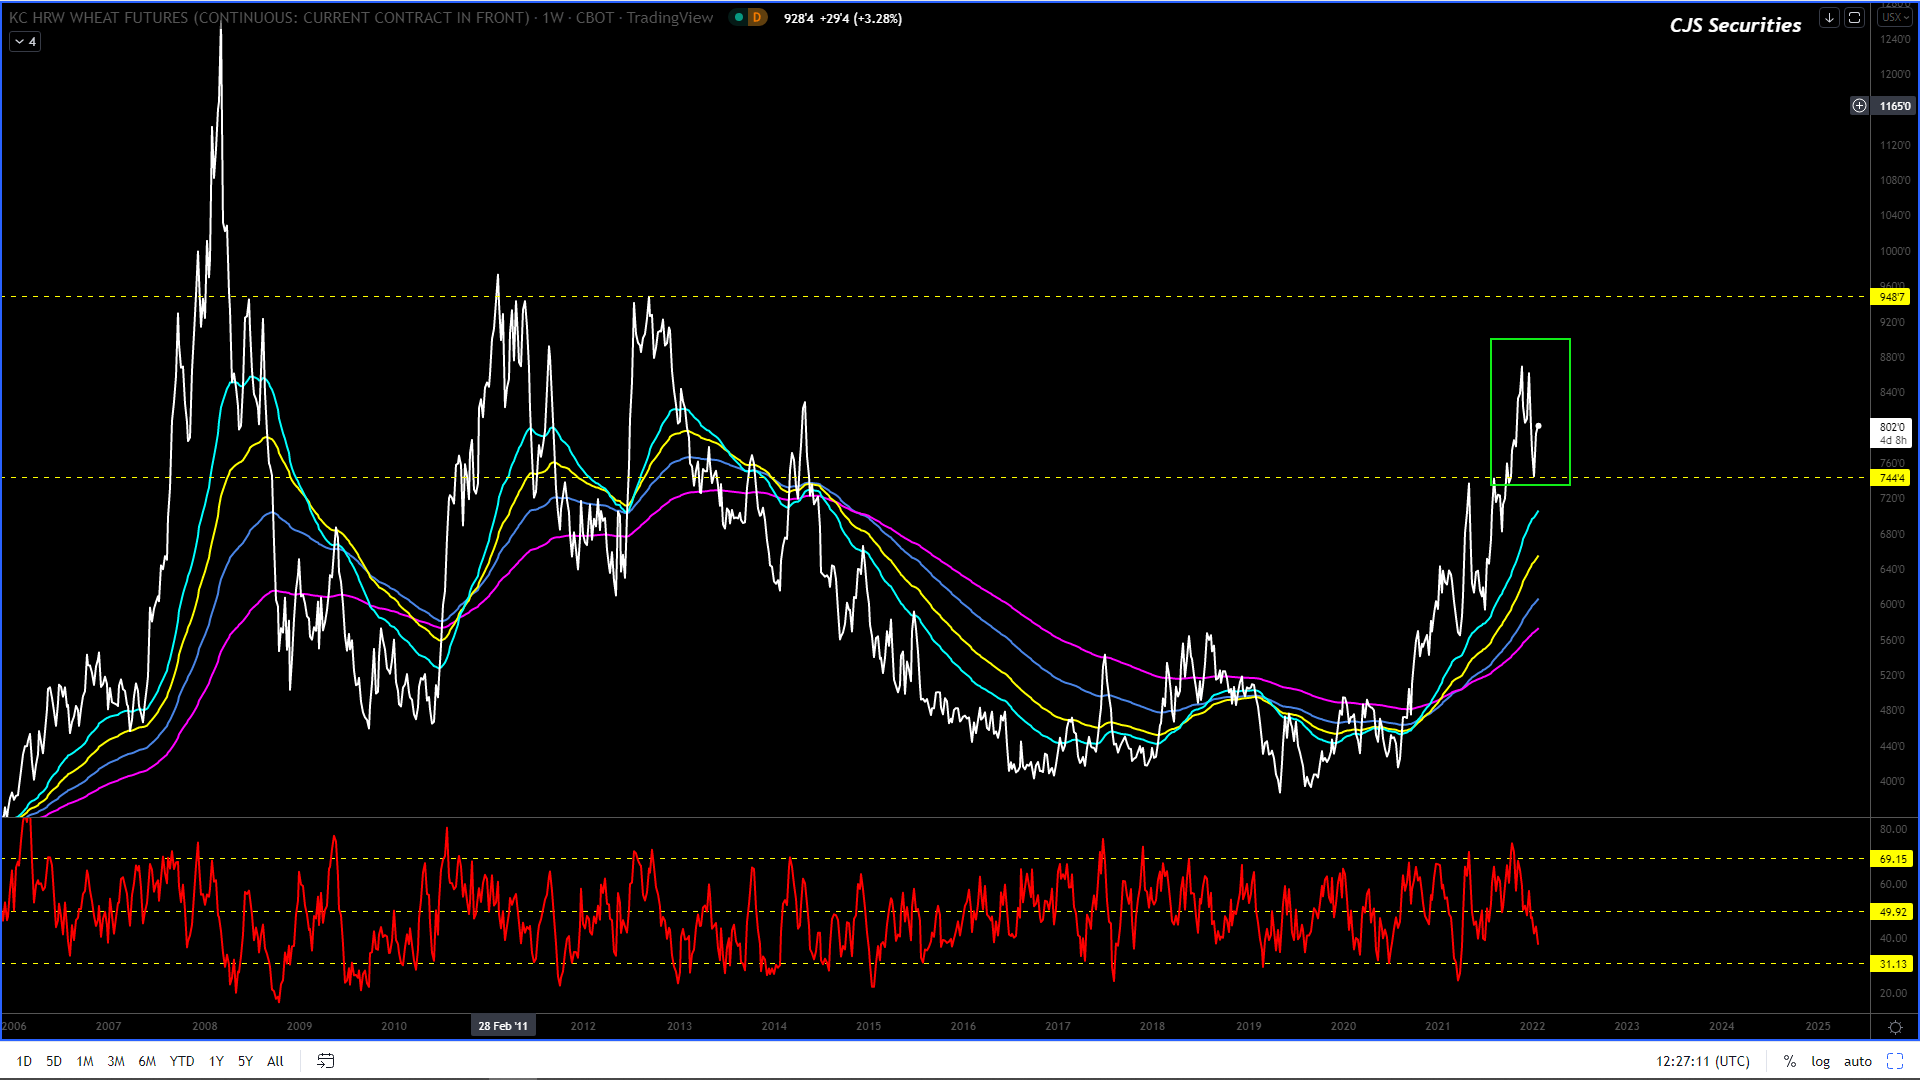
Firstly, the weekly
report that I send out is purely technical, although I am very cognisant of the
macro factors.
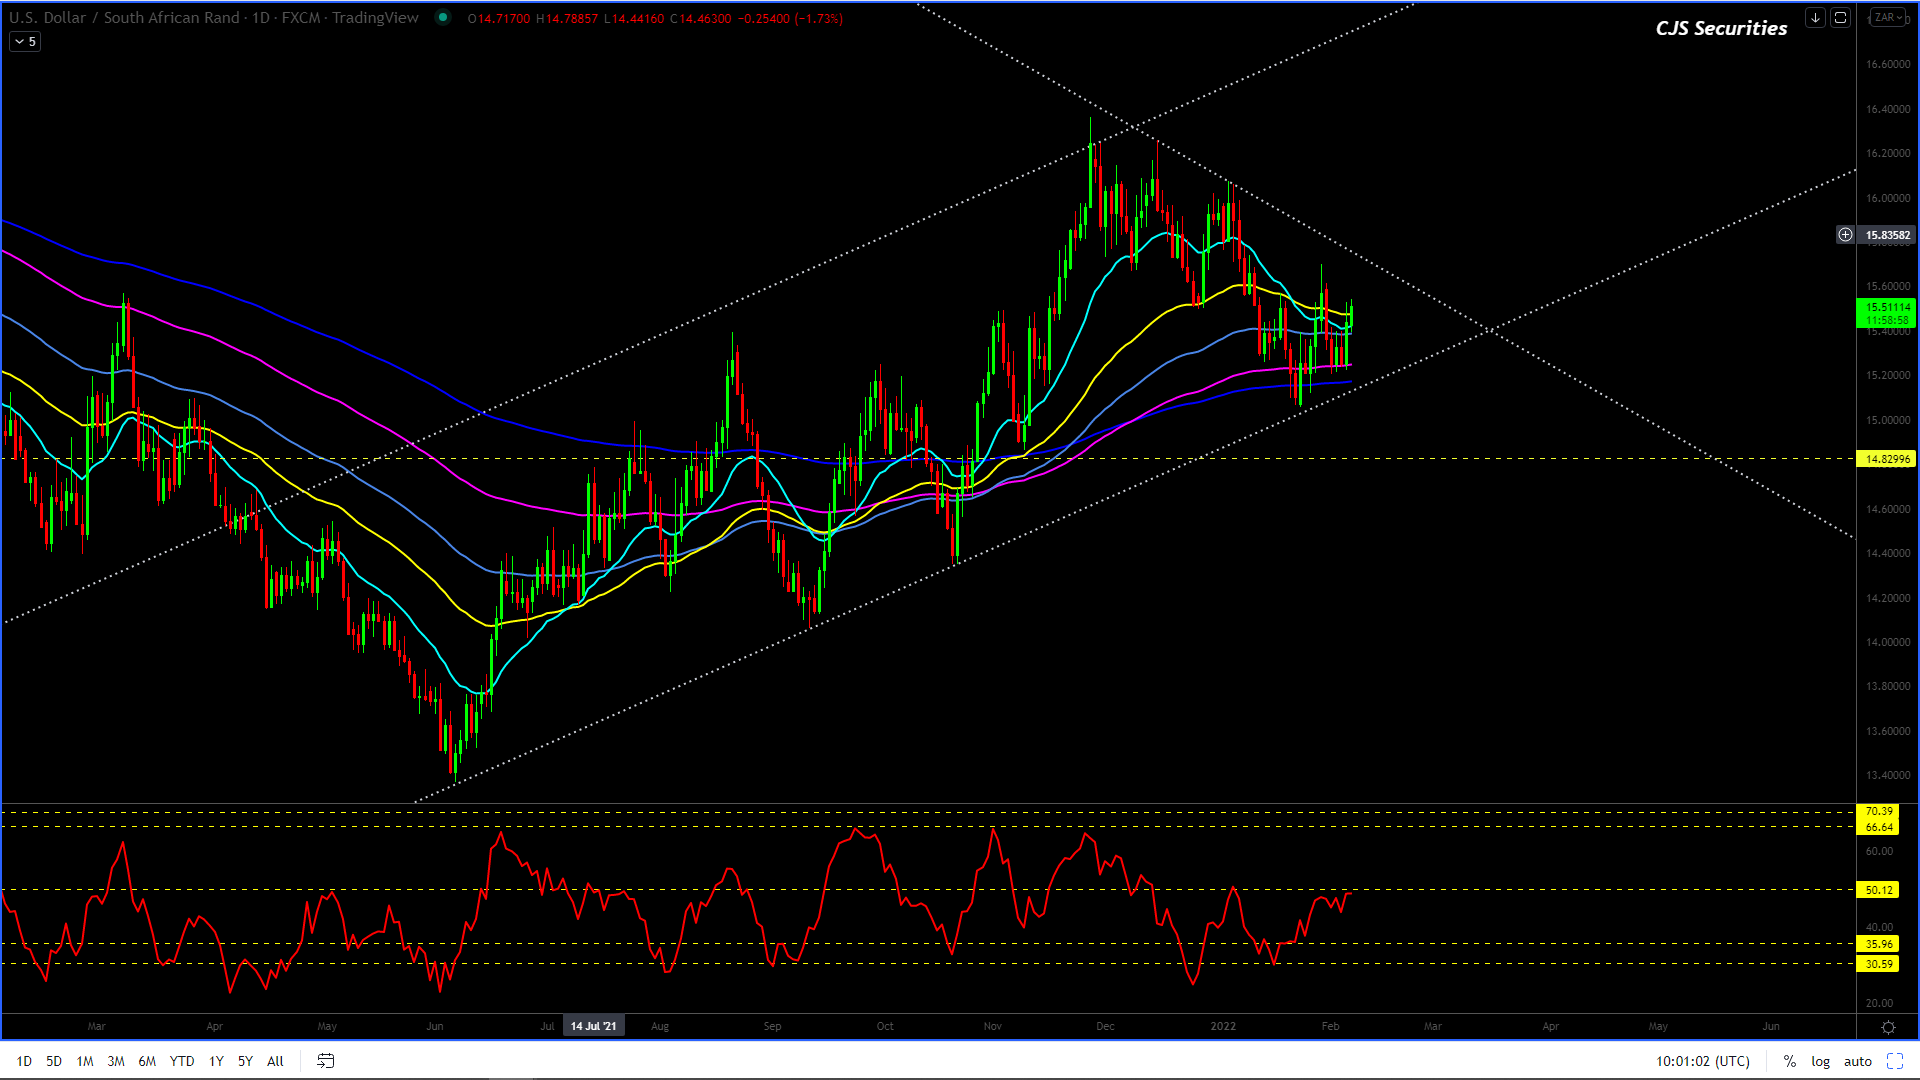
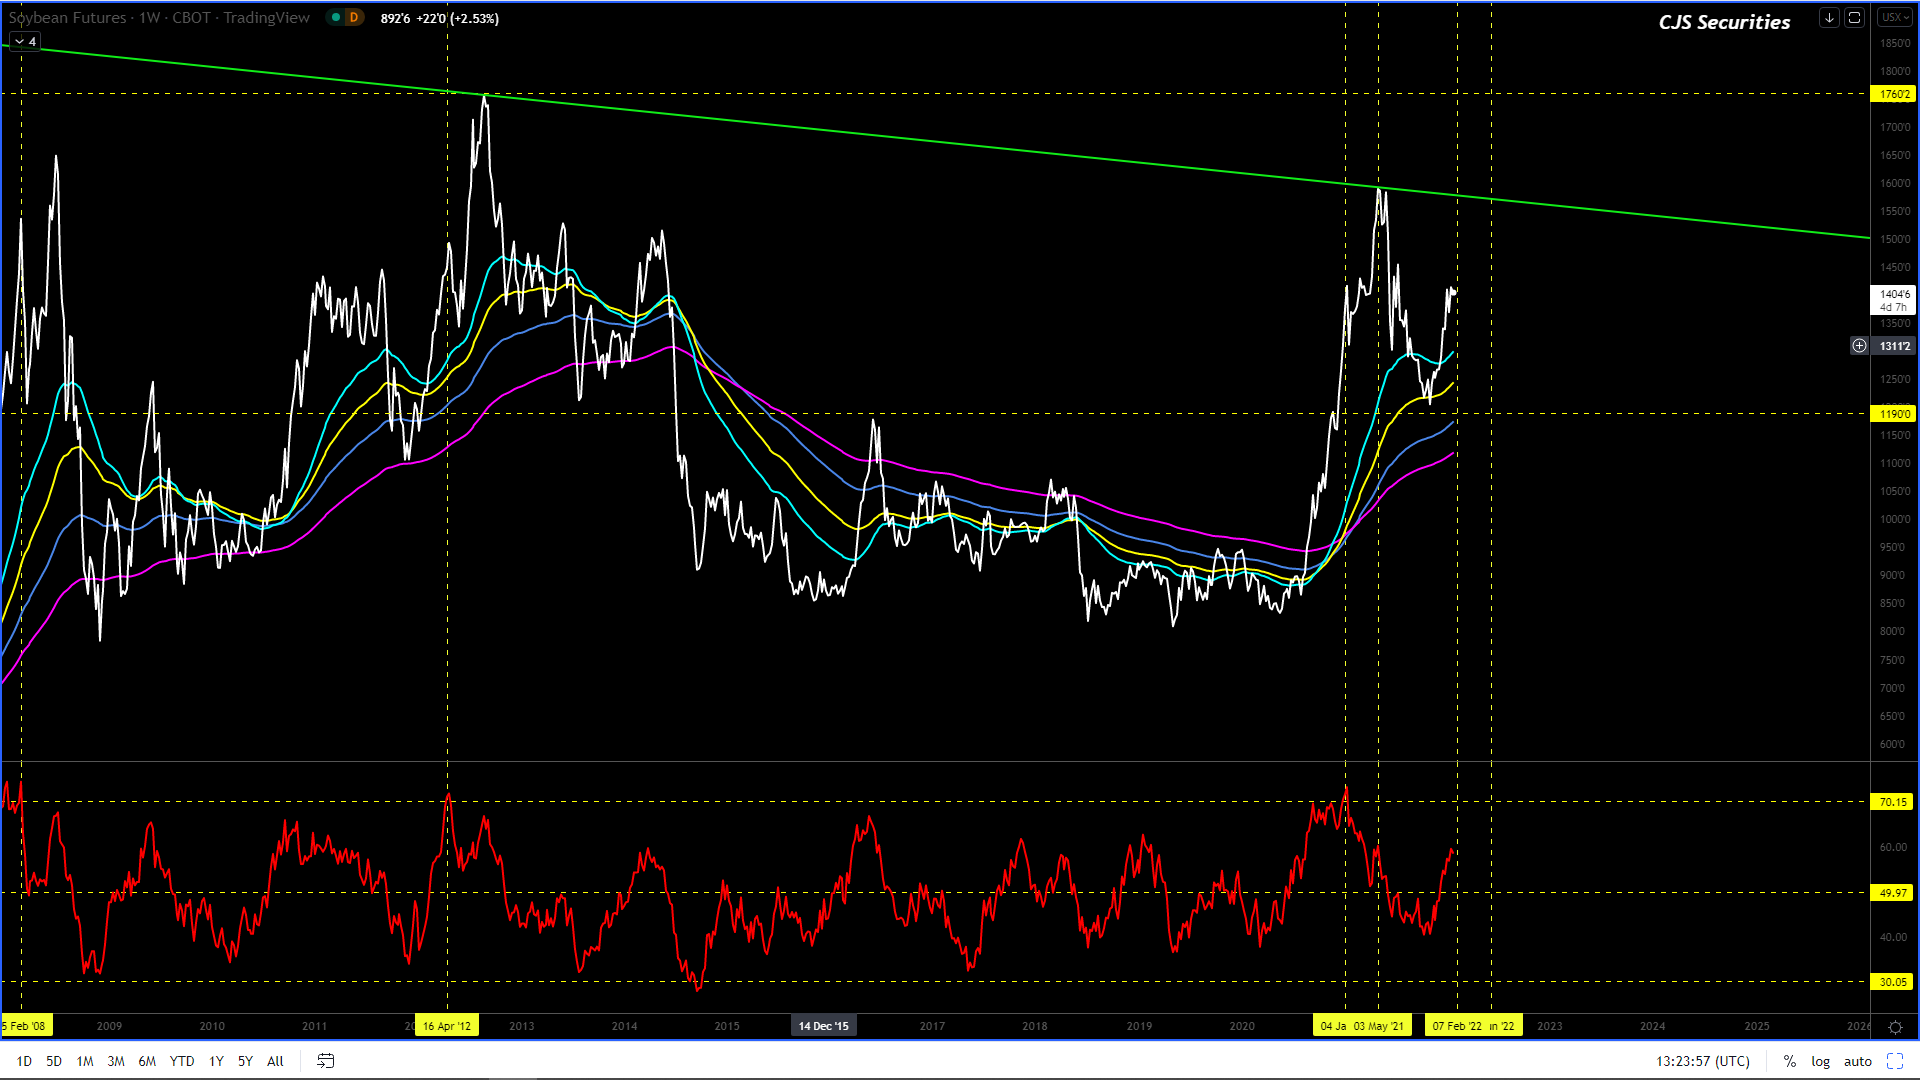
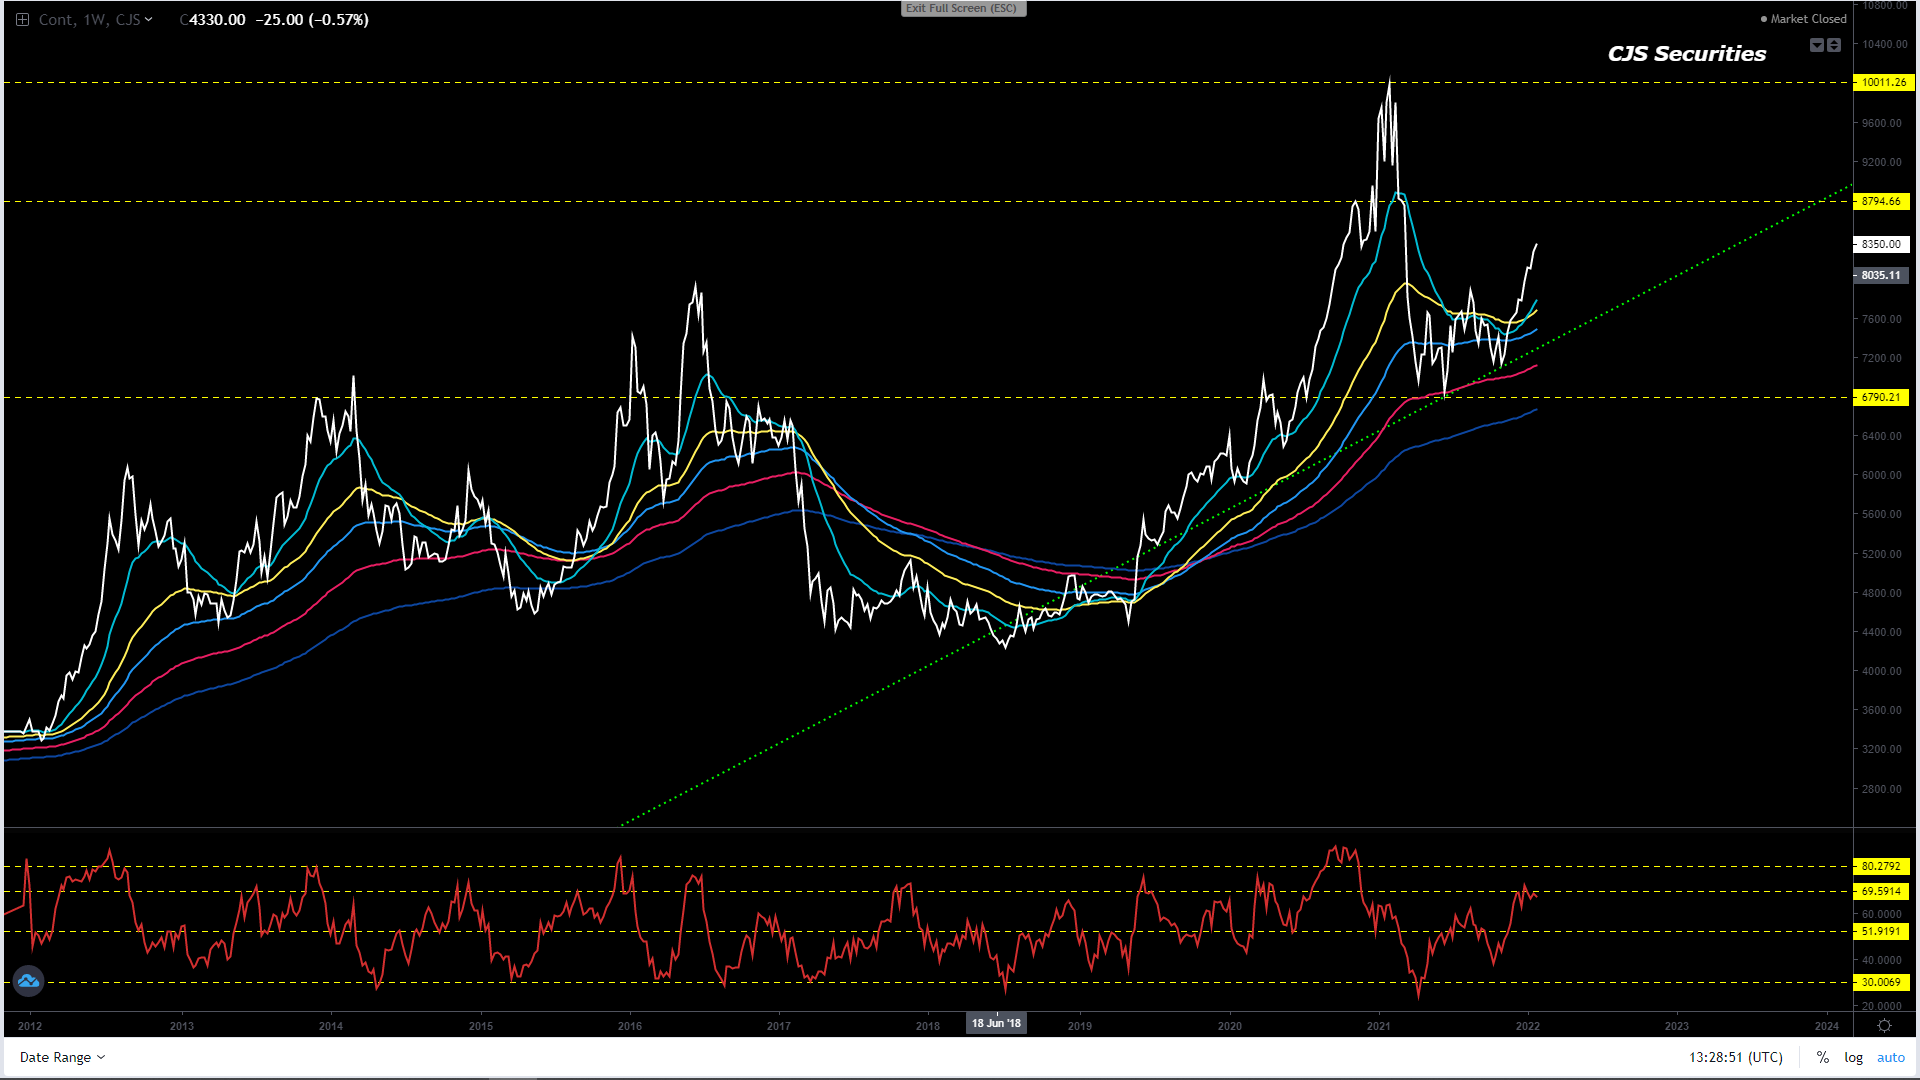
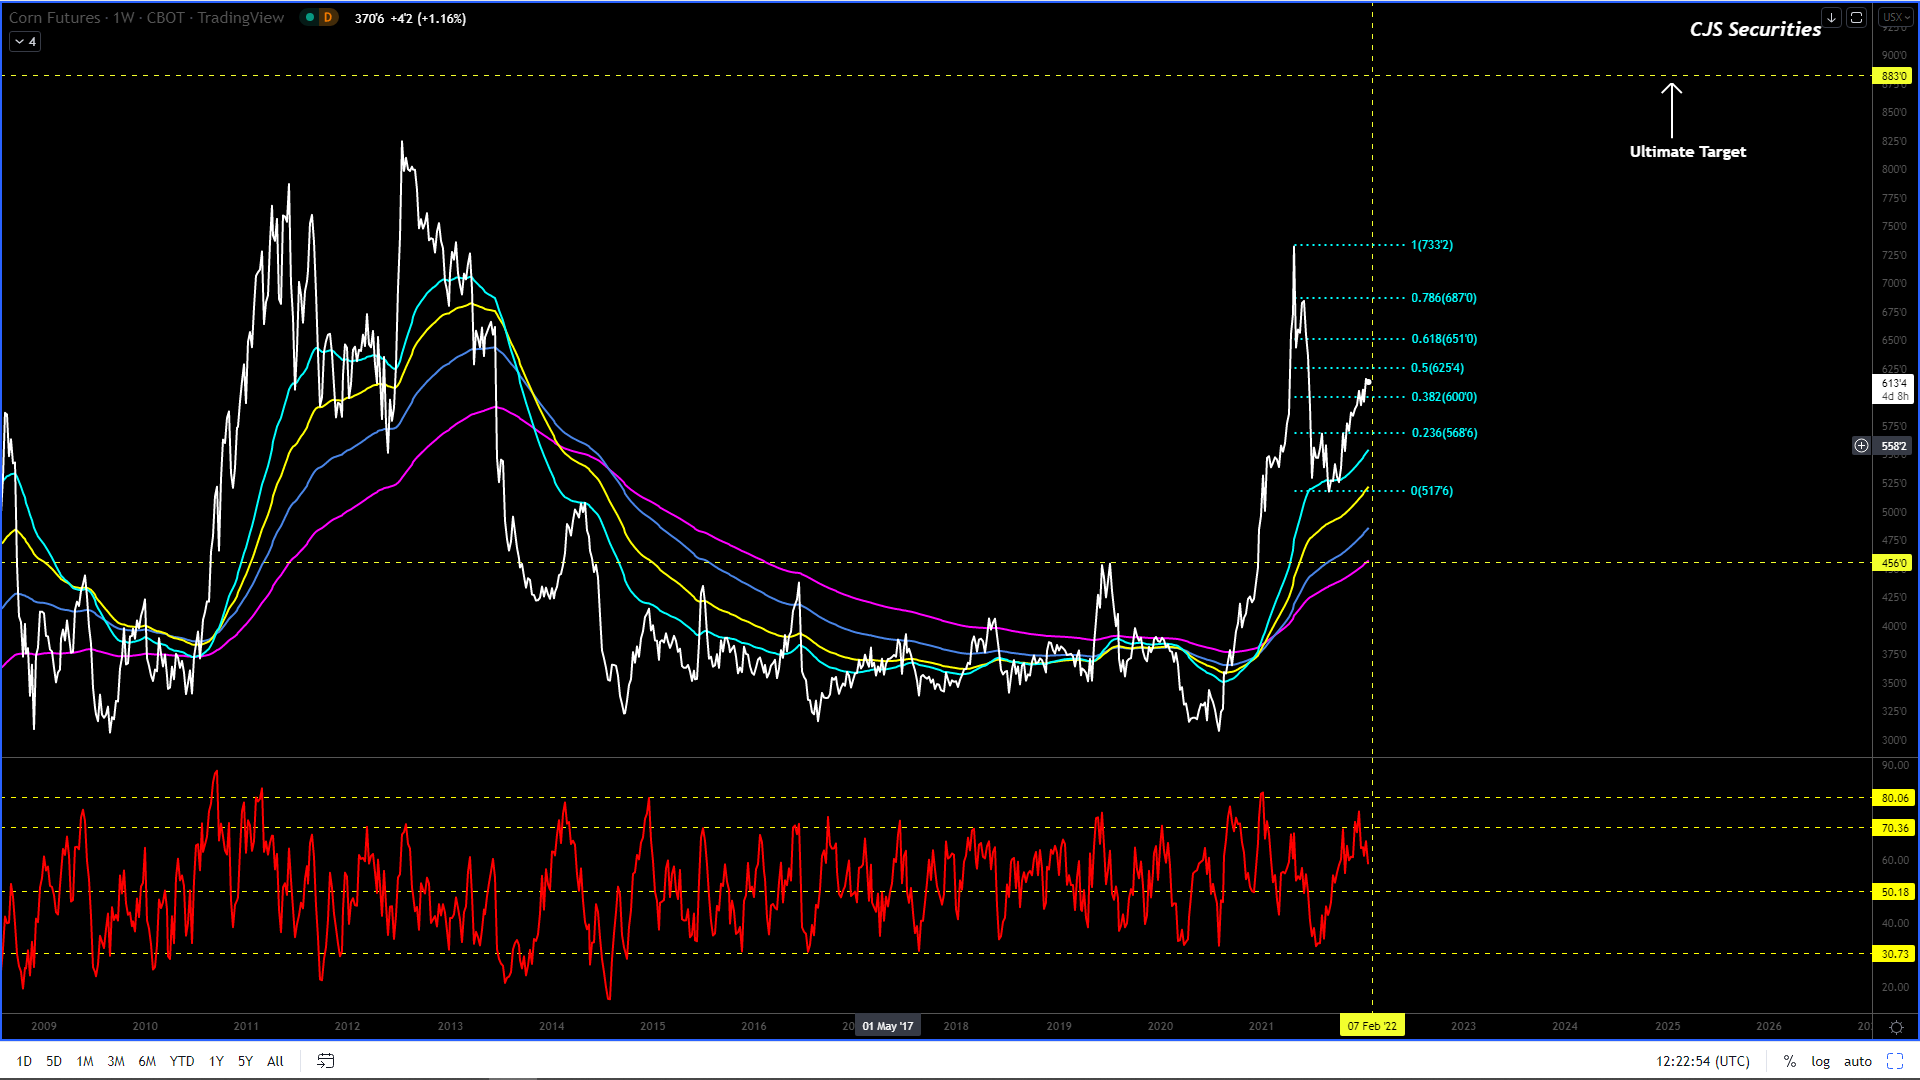
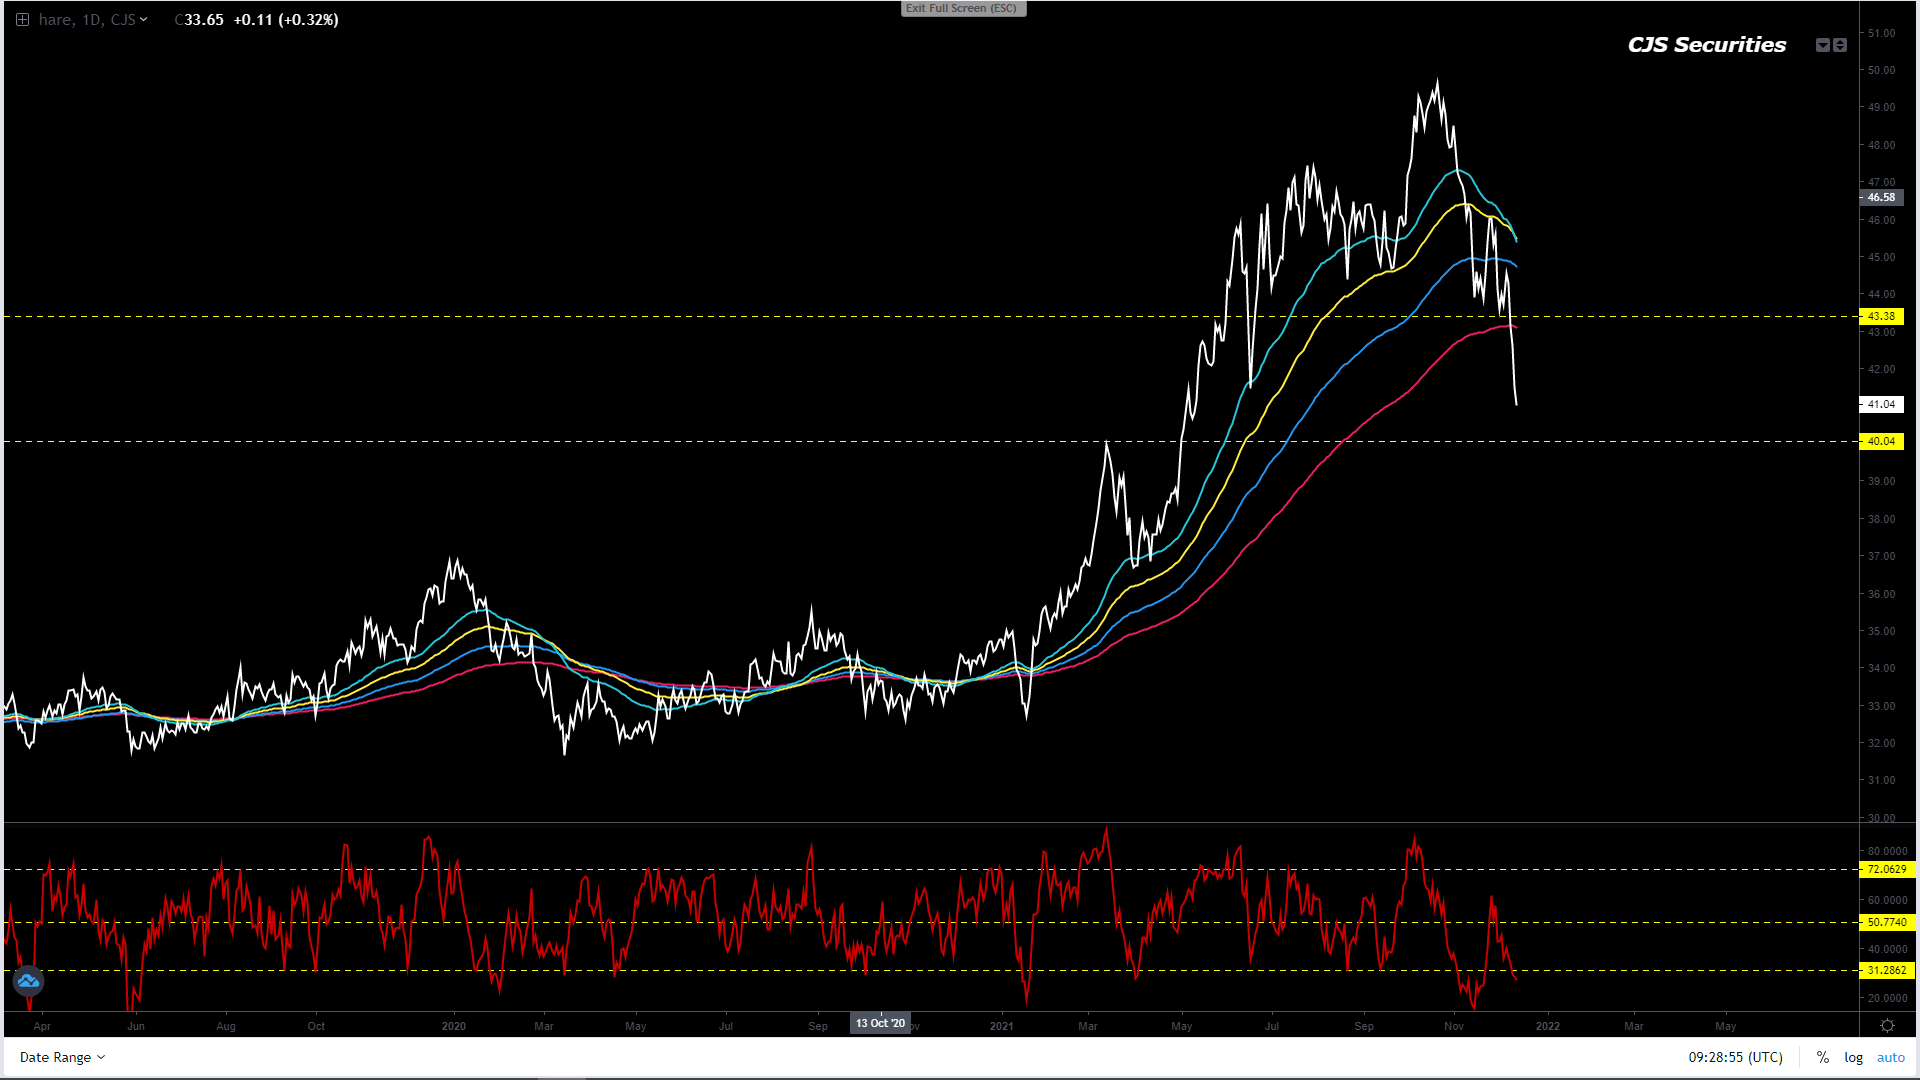
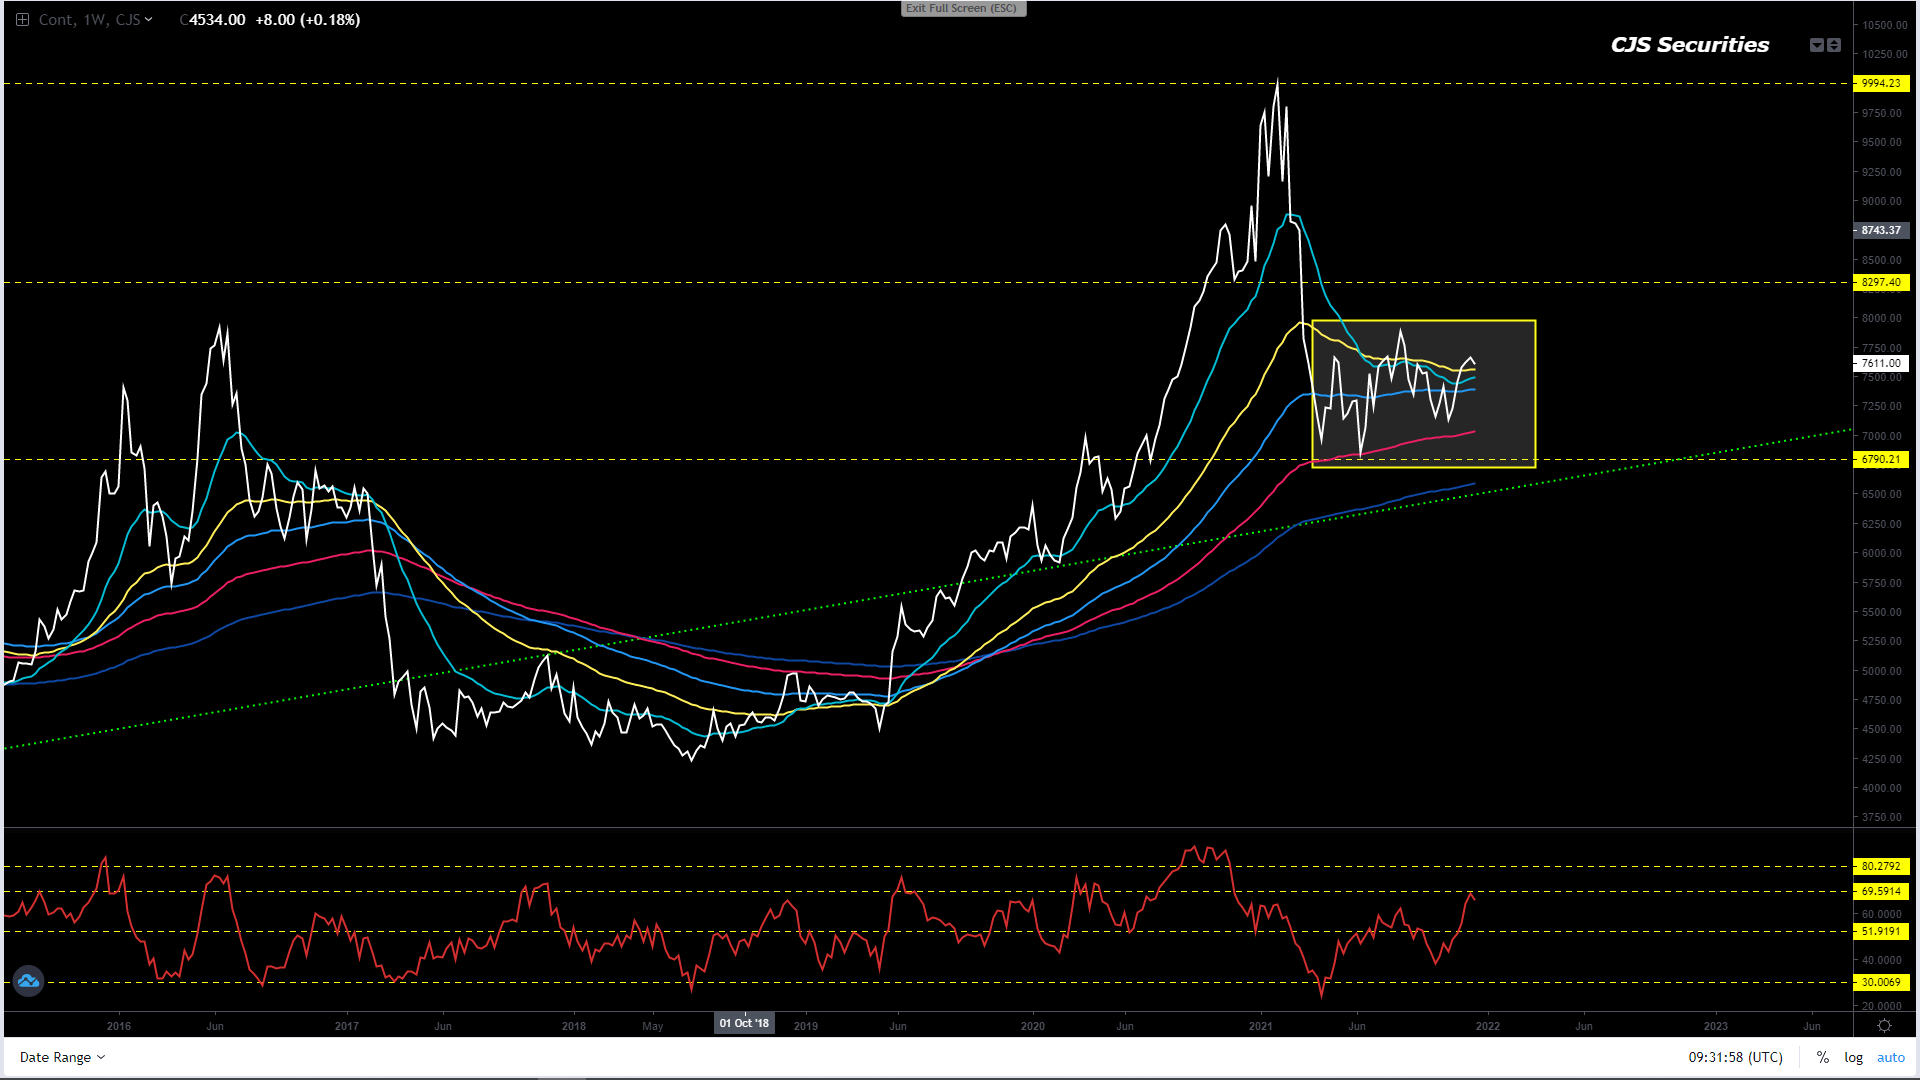
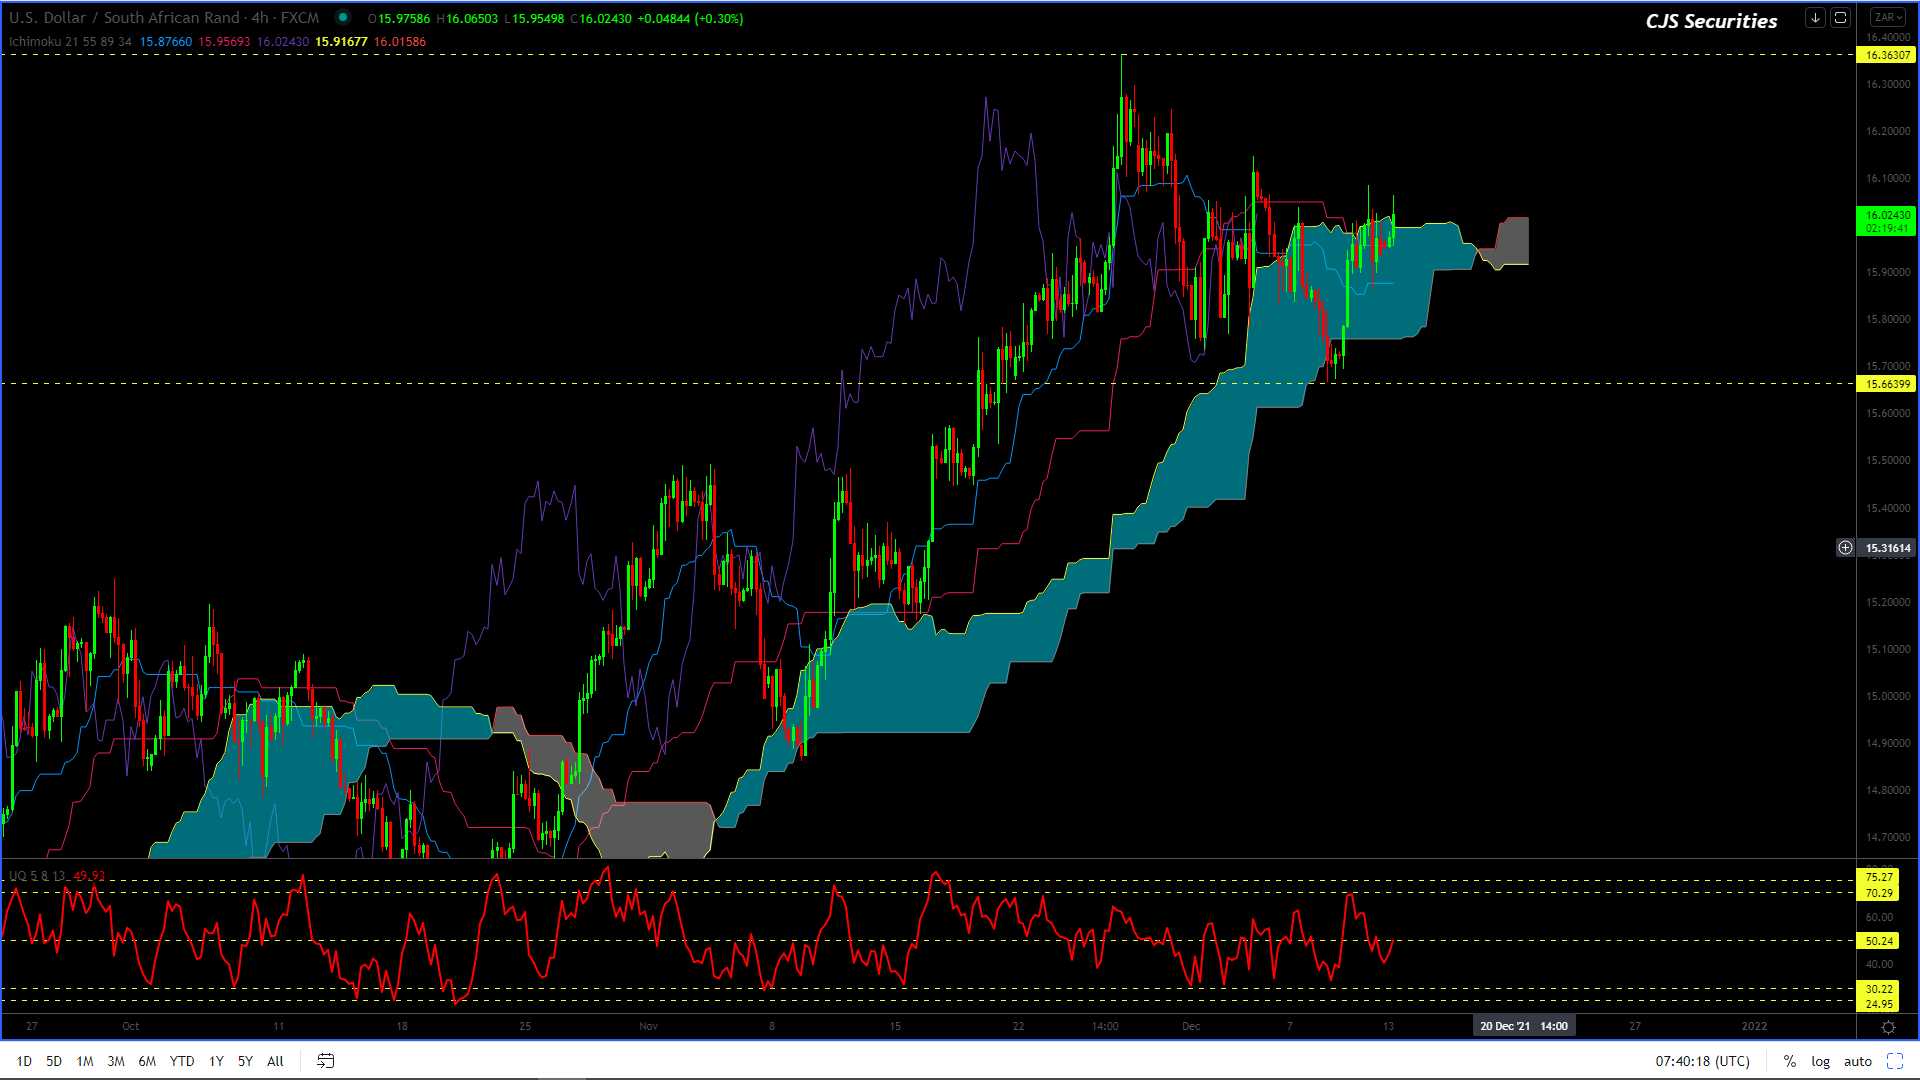
After making a
significant pullback from the Covid high, the Dollar Rand looks very much to be
making what I refer to as an “irregular flat” formation.
This formation will be
complete at R11.57 in a perfect technical scenario, while the actual range is R13.00 – R11.57.
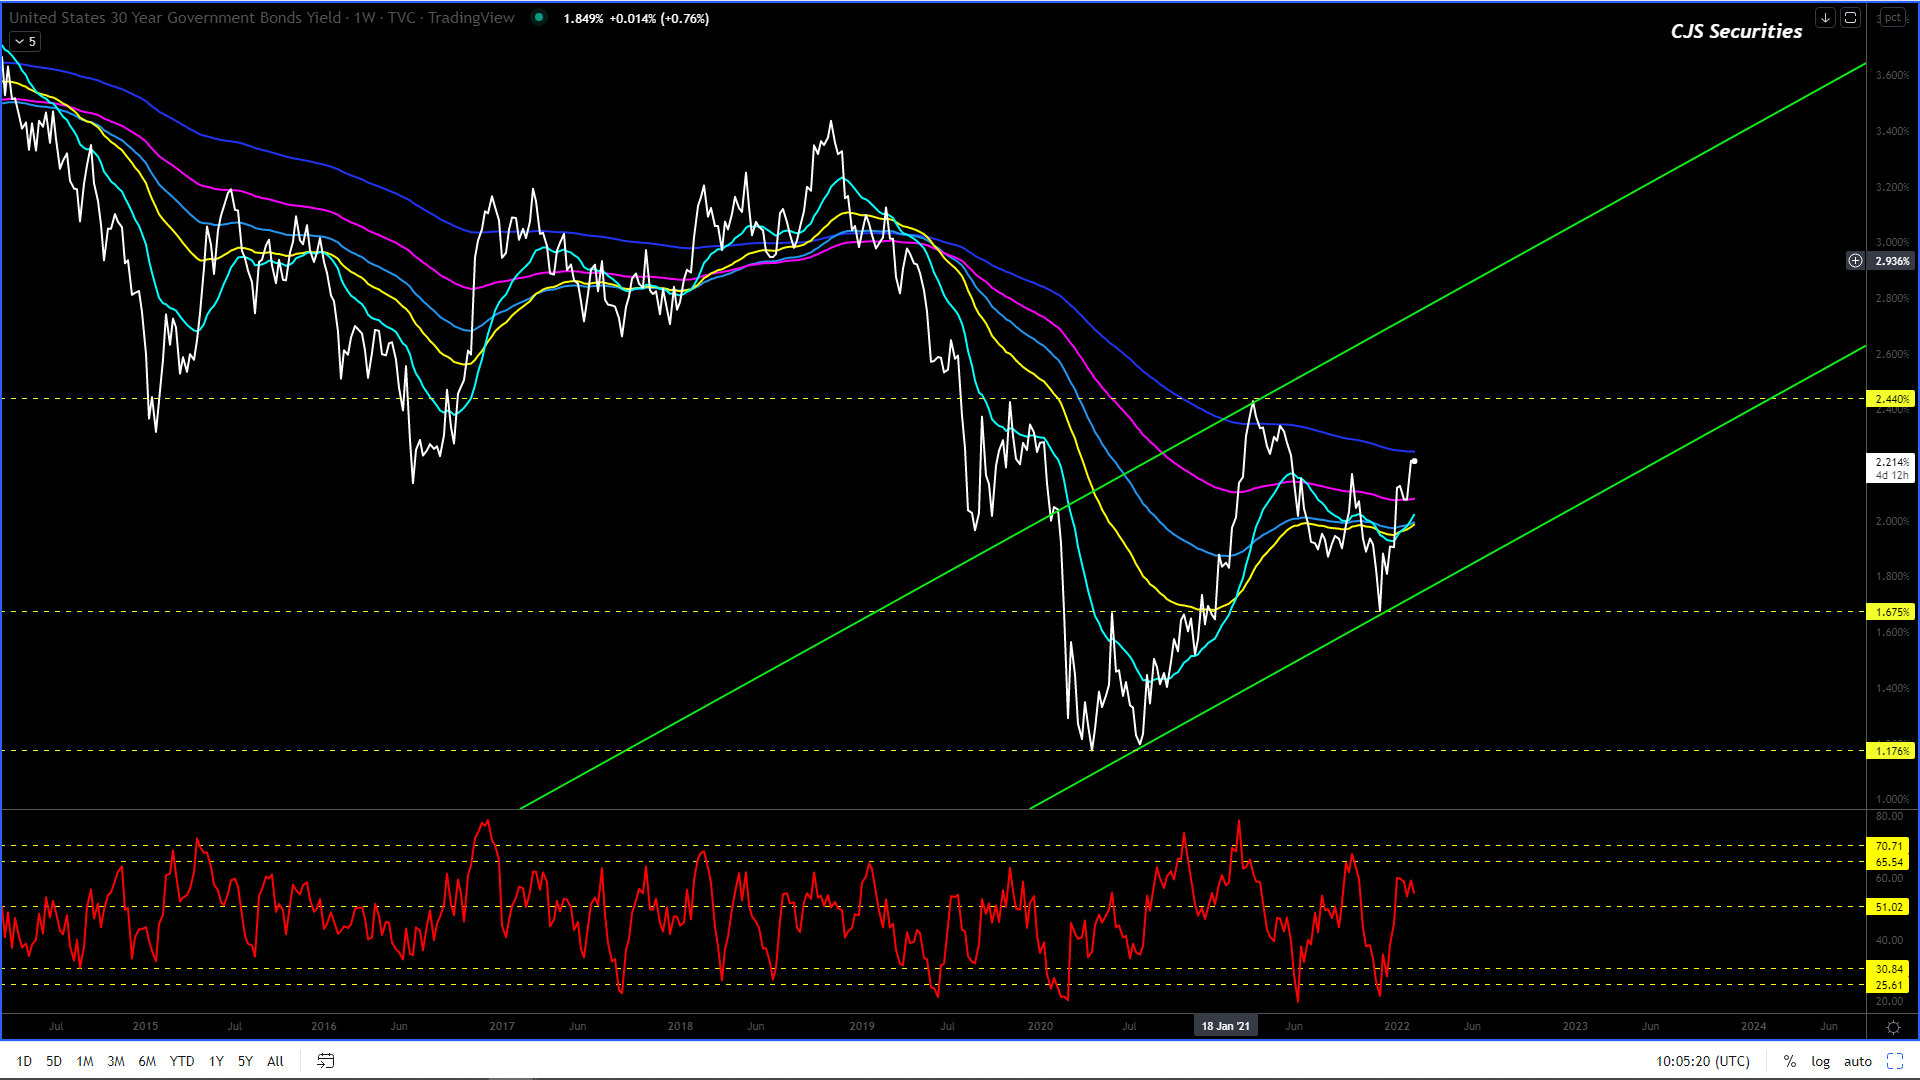
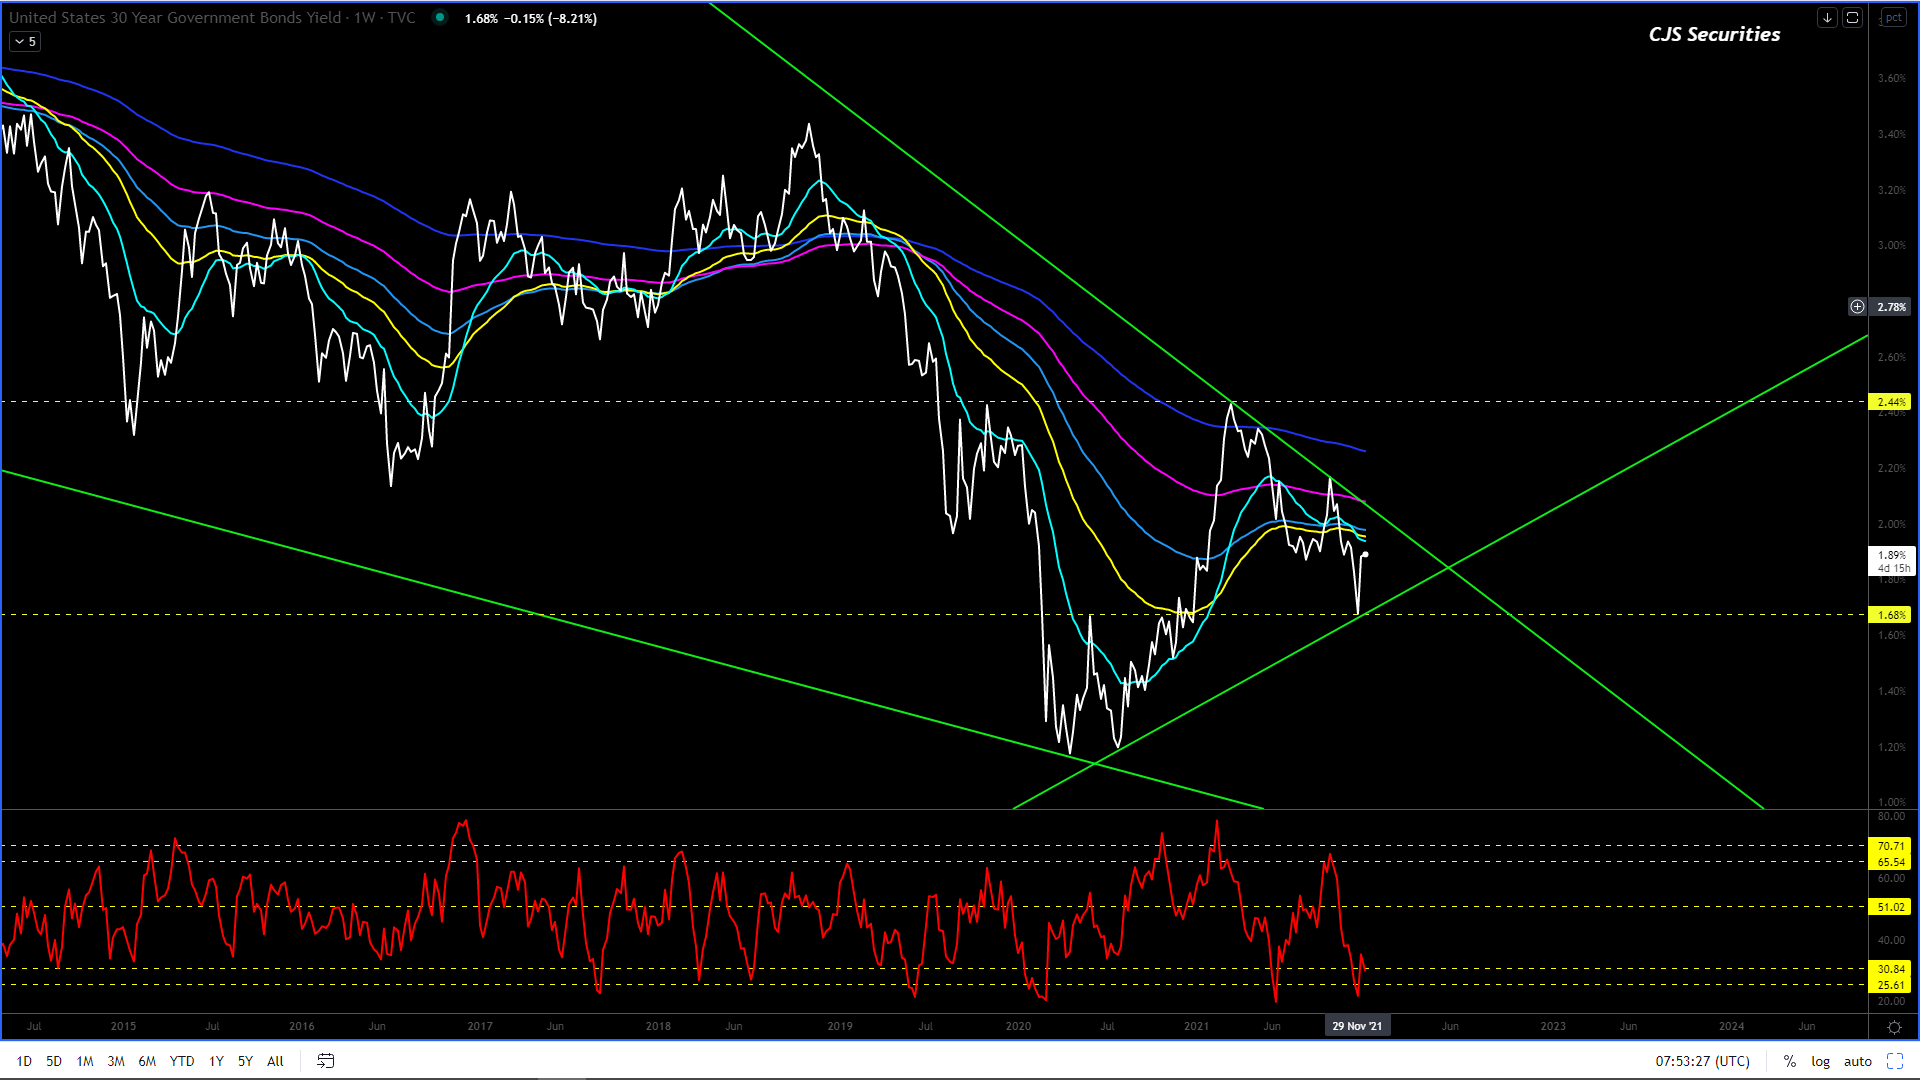
I have been perplexed
as to why the ZAR could become this strong, especially in a world where the Fed
has turned Hawkish, but alas, I believe my charts first and foremost.
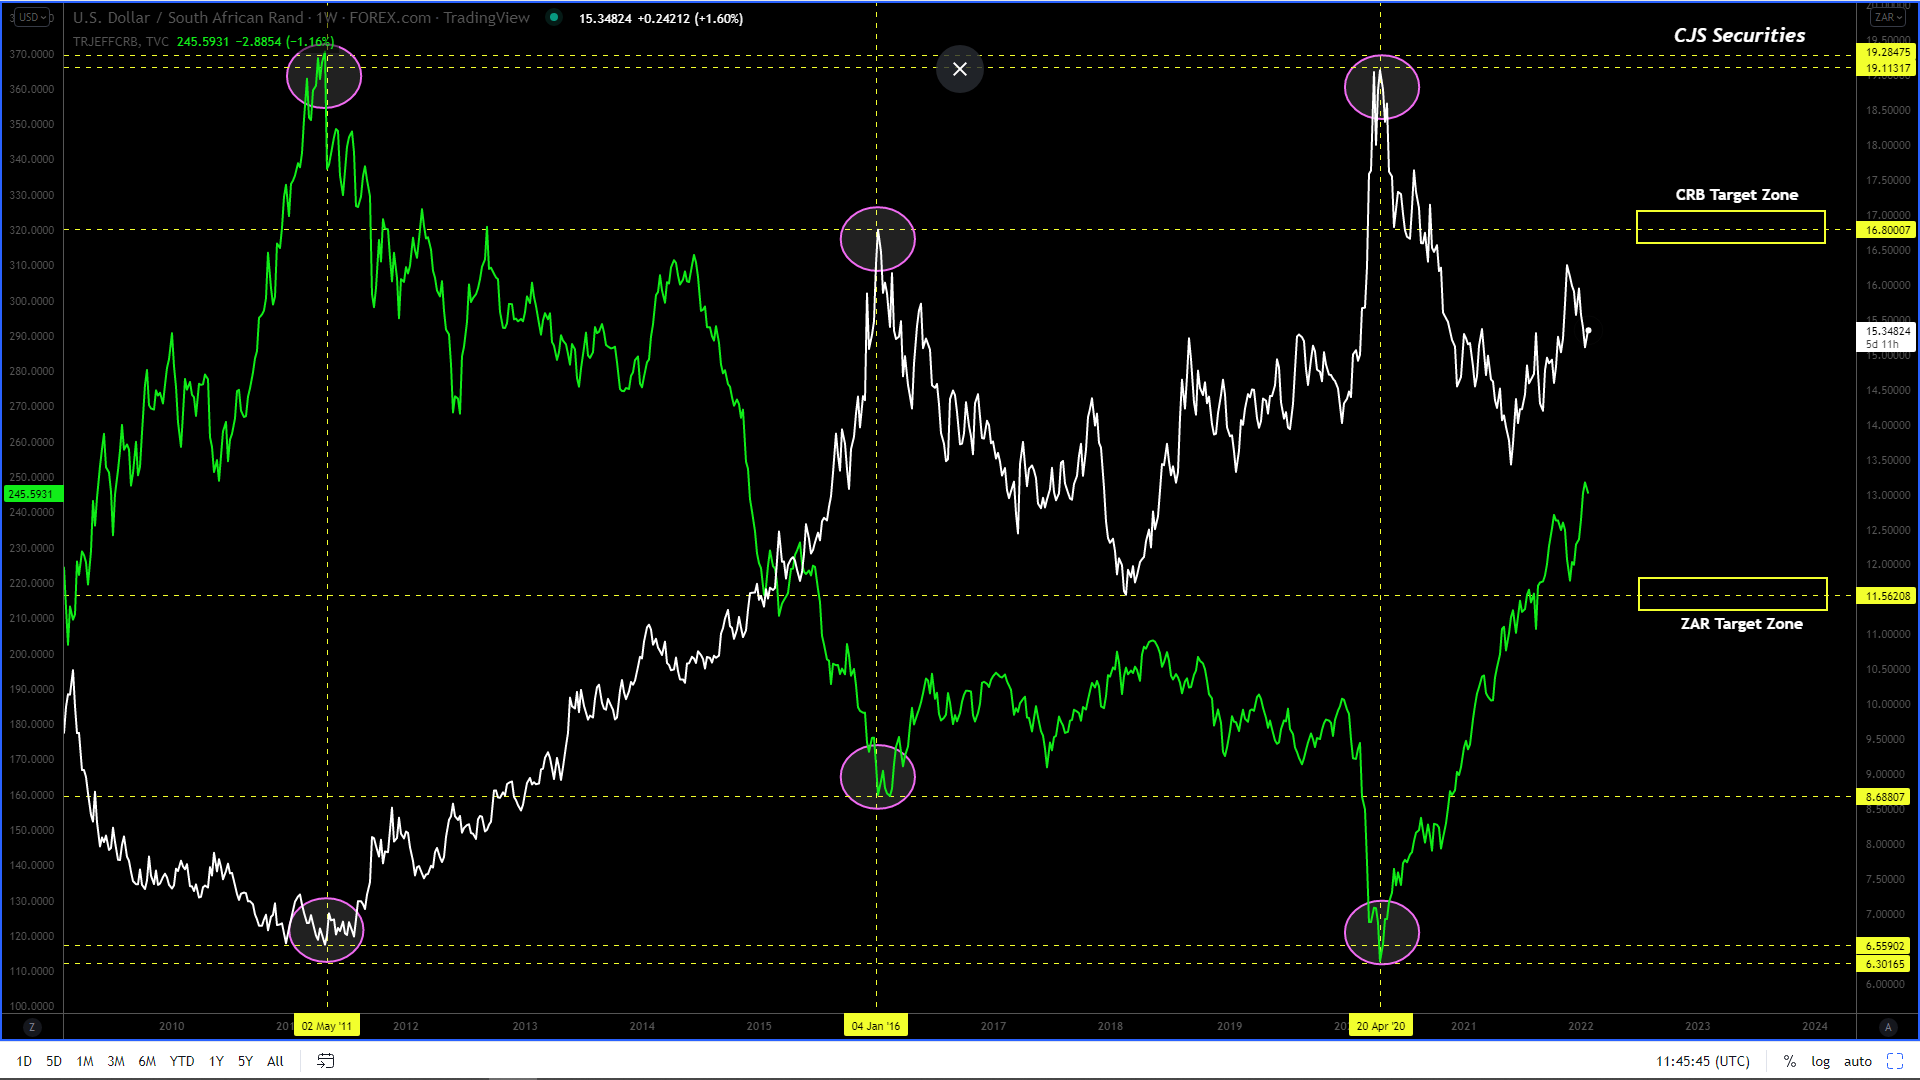
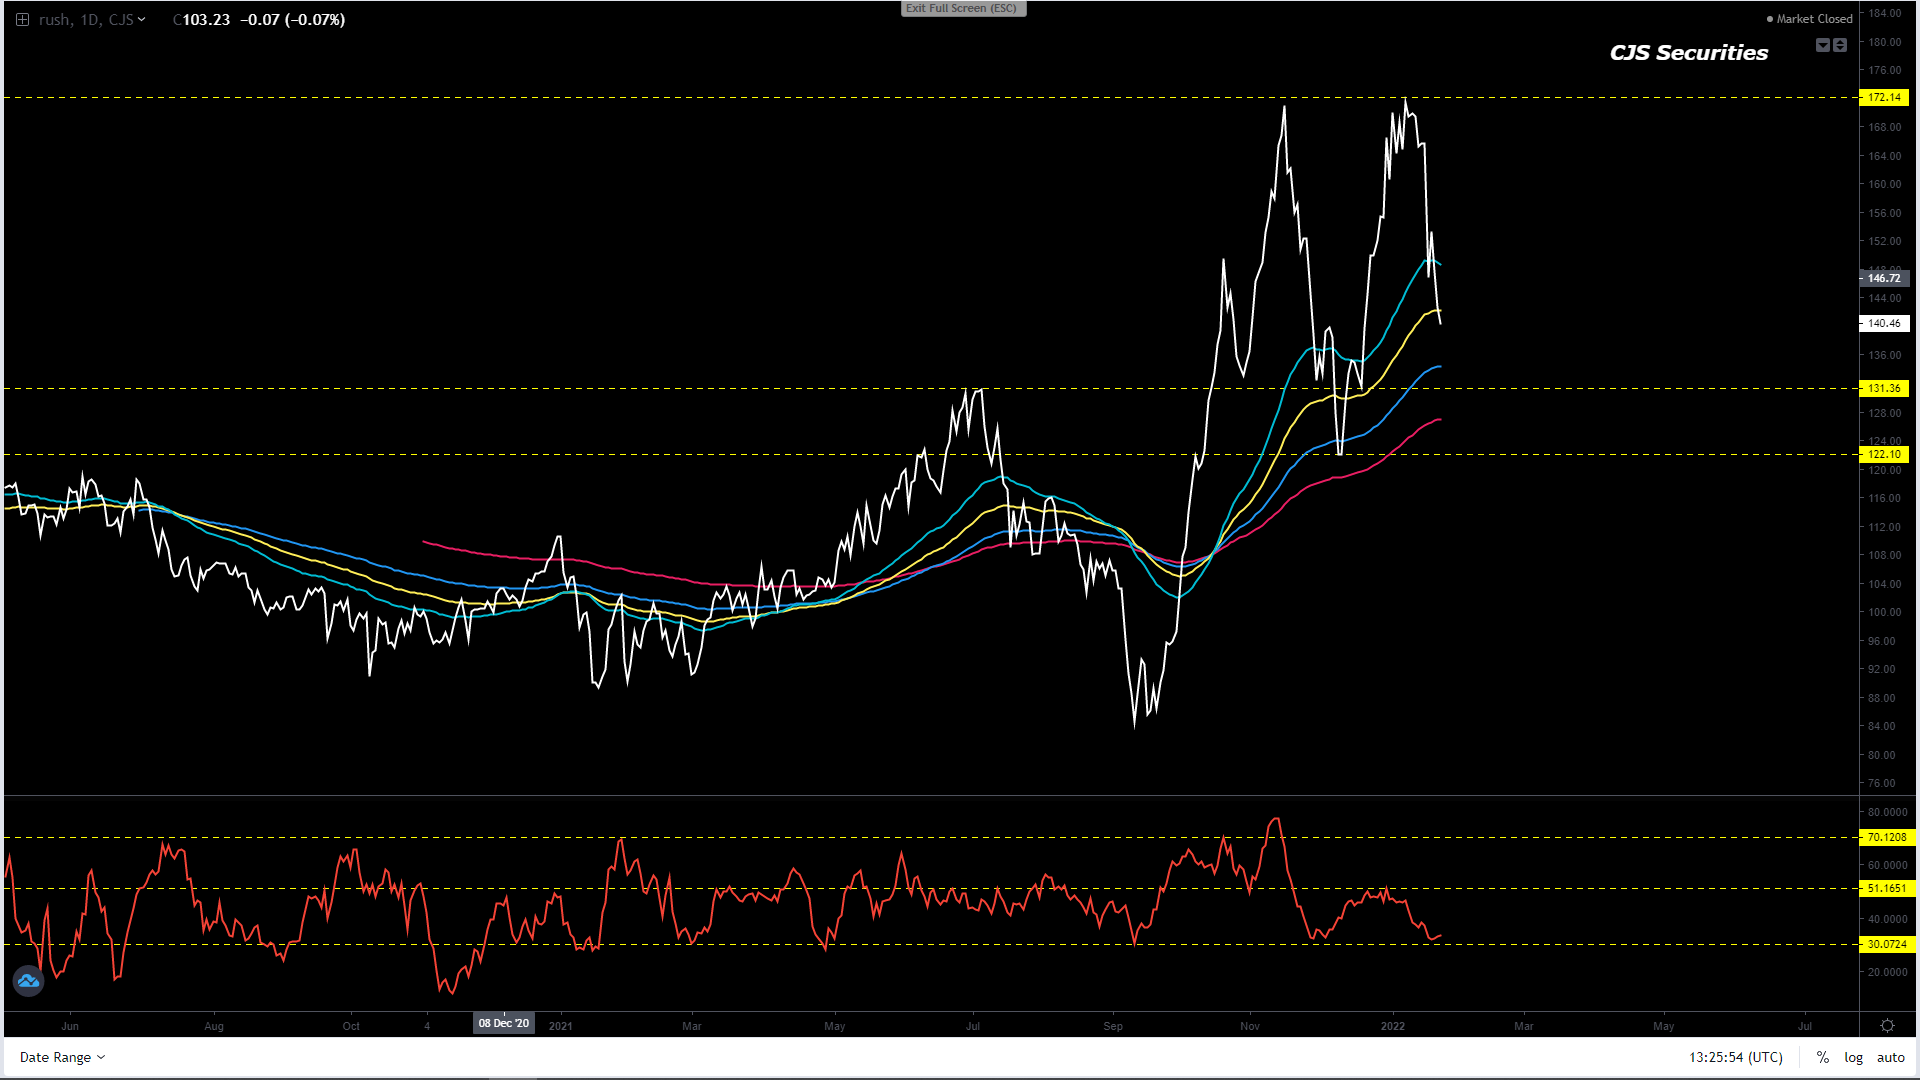
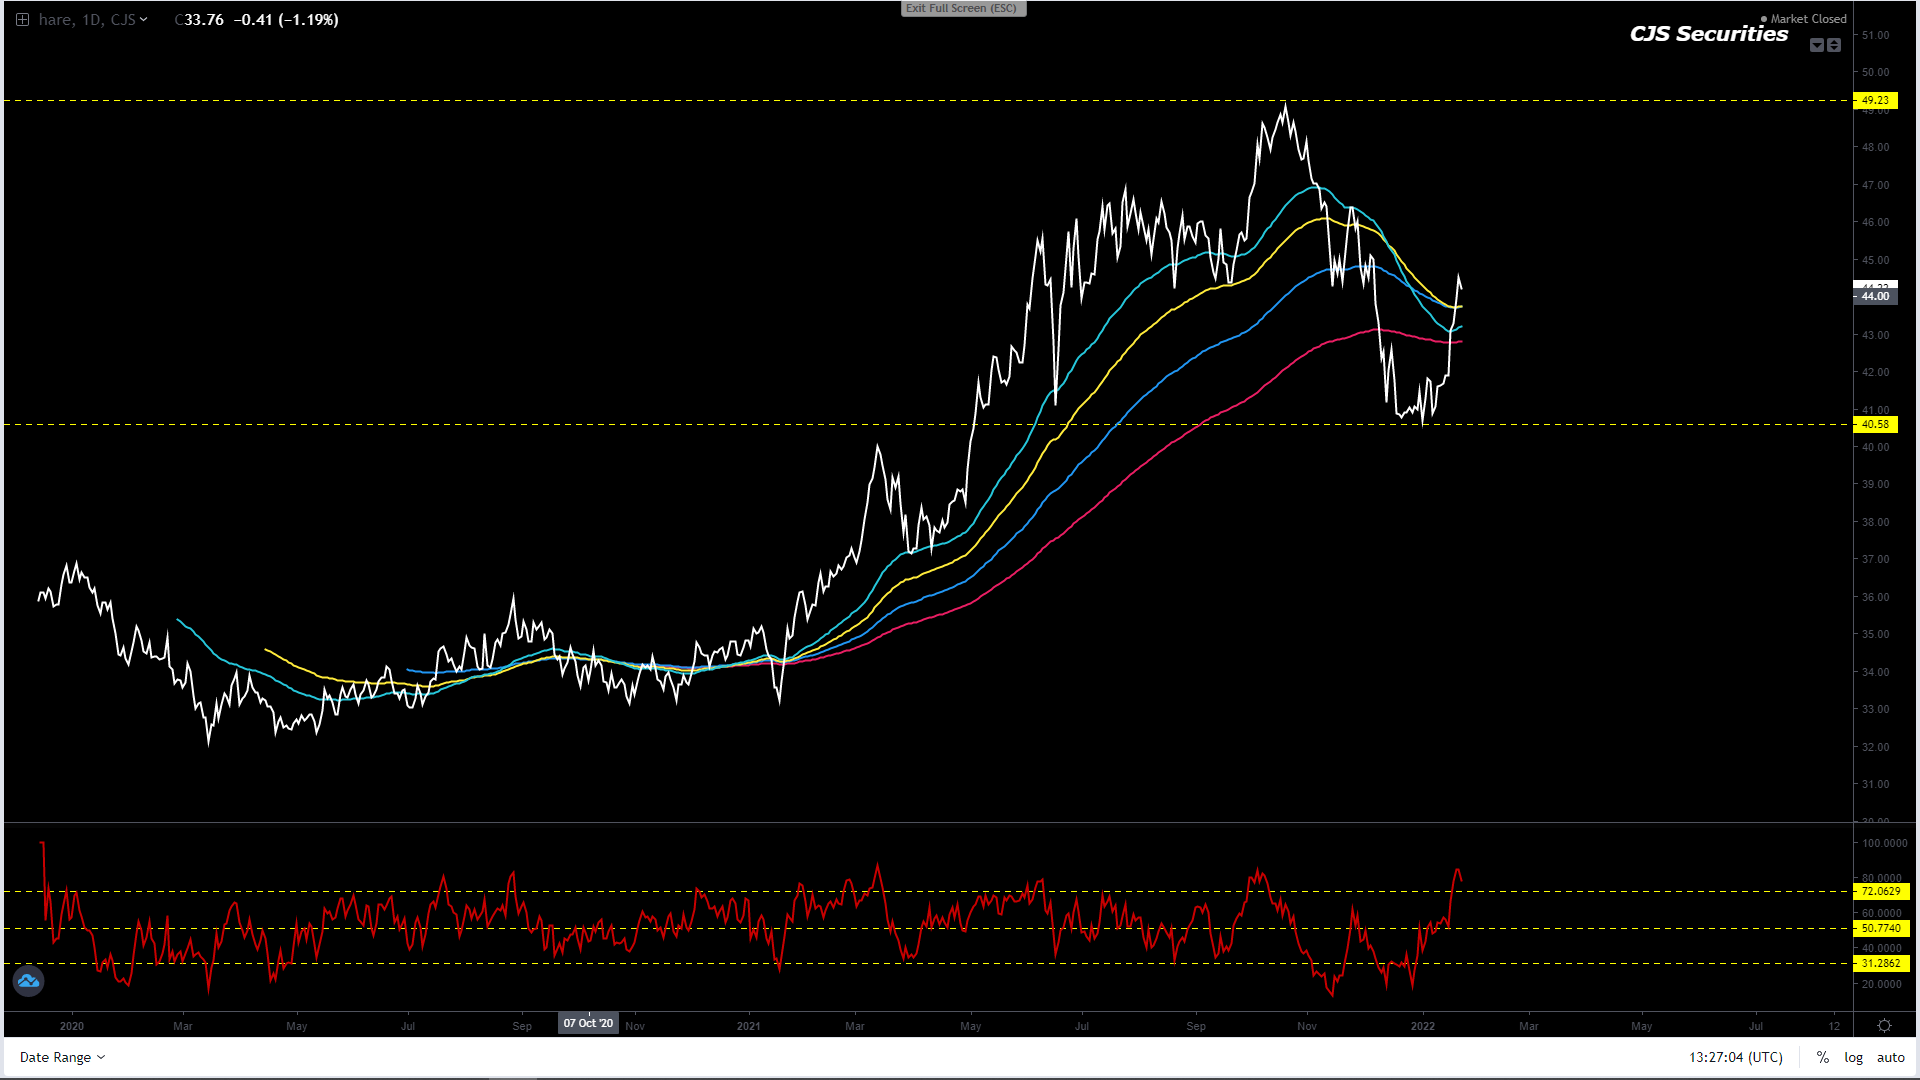
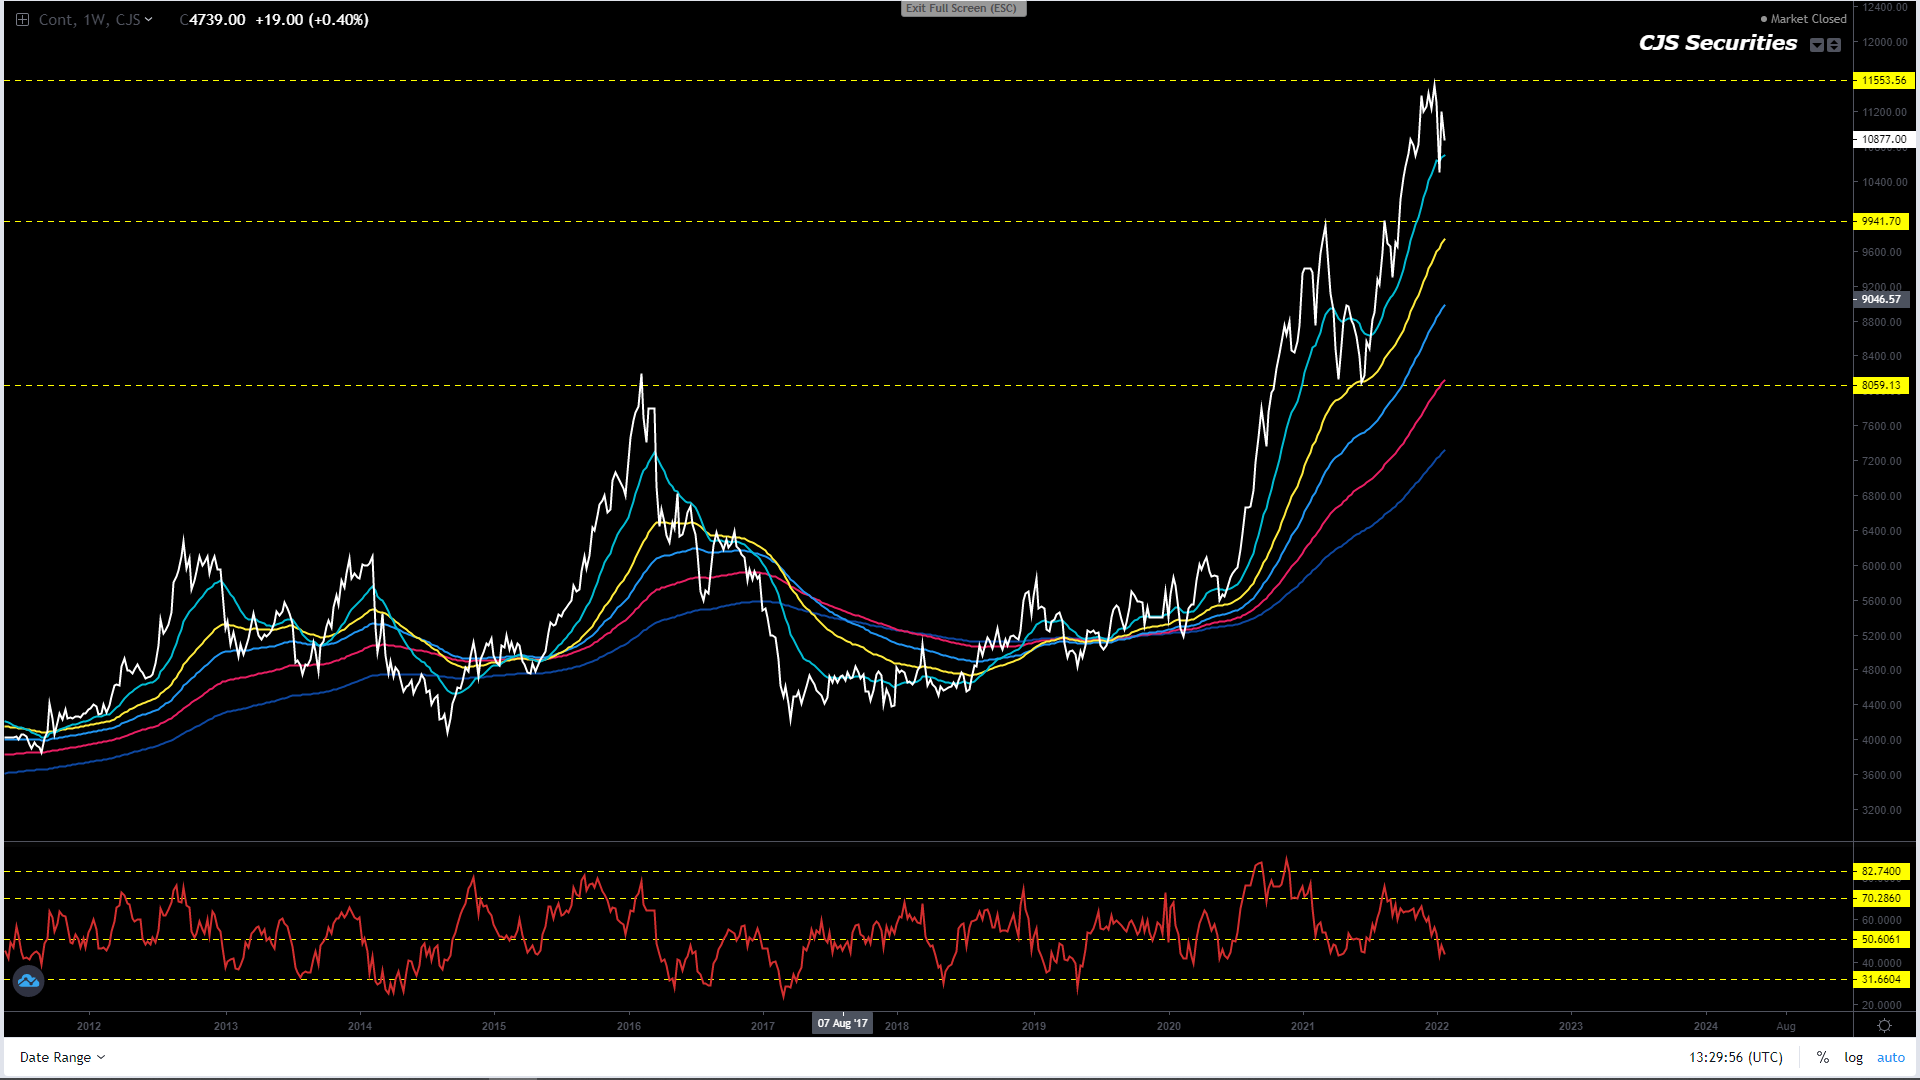
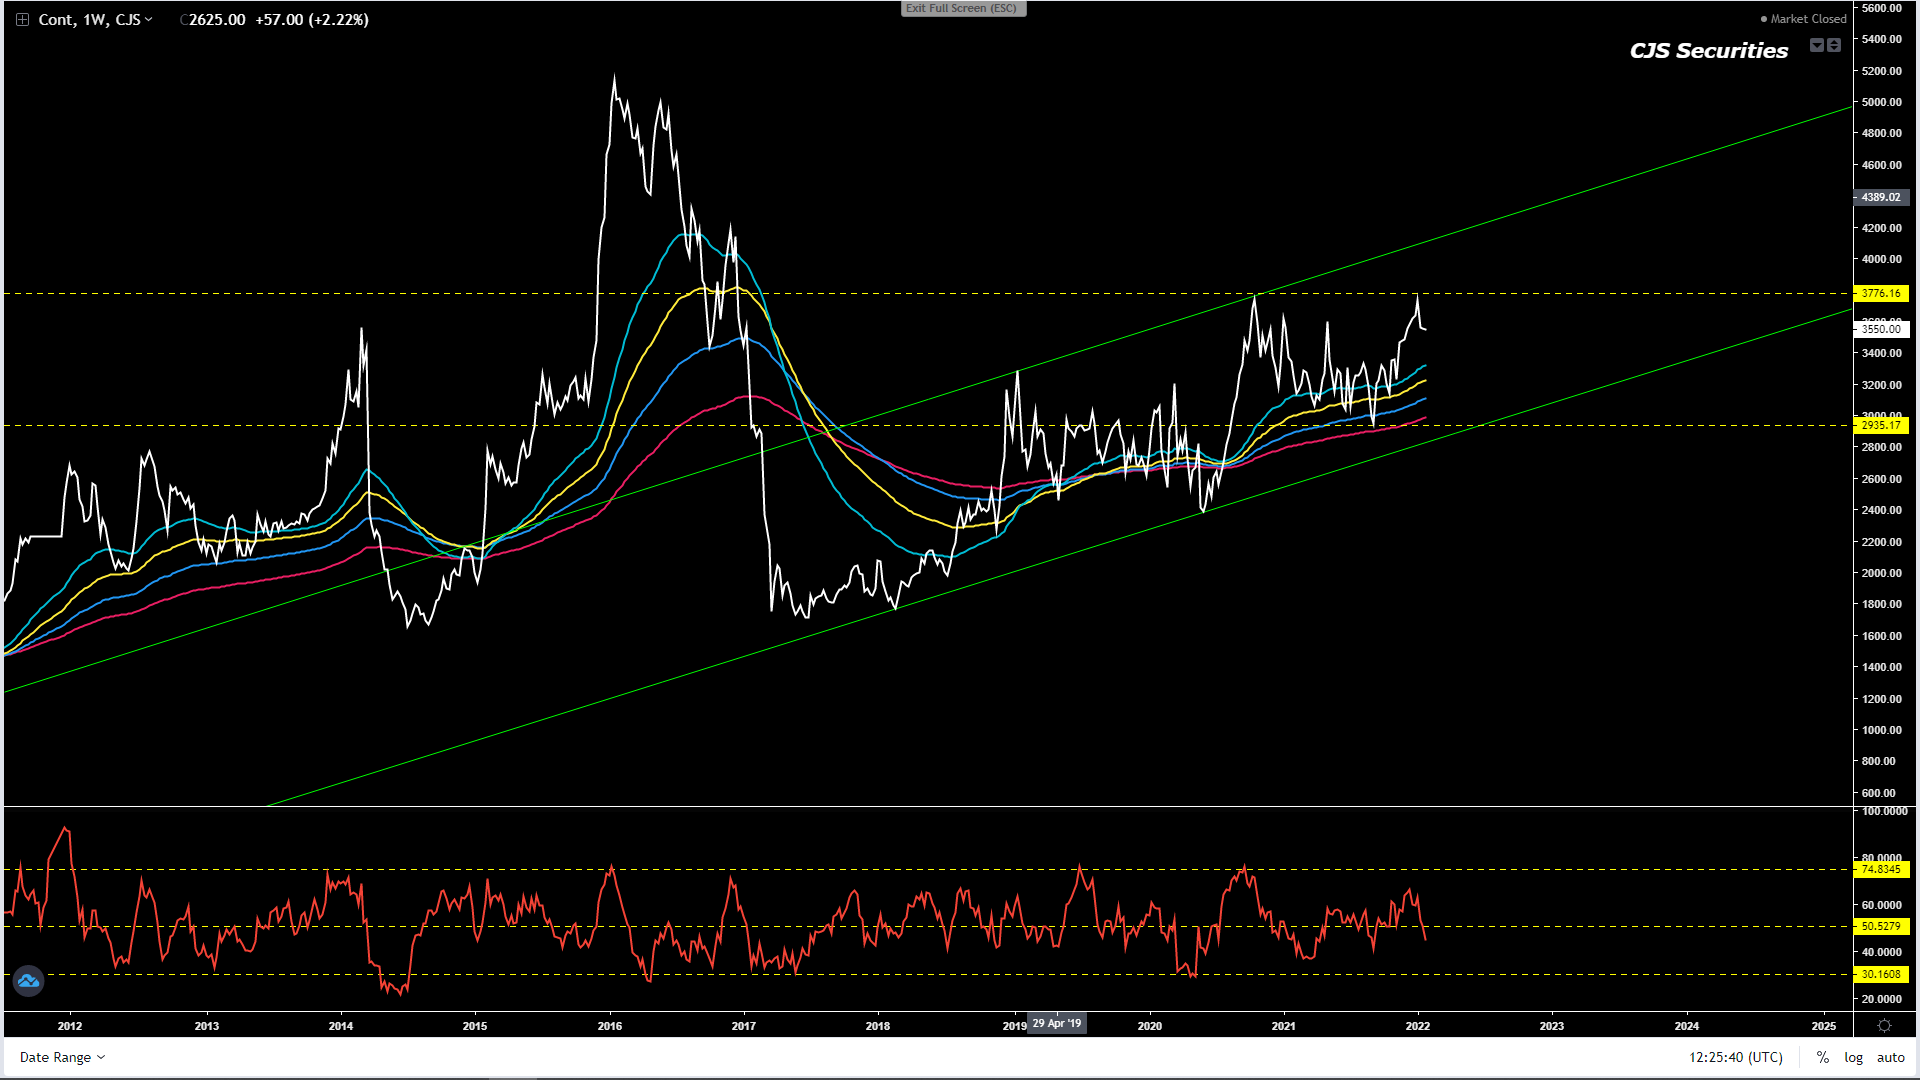
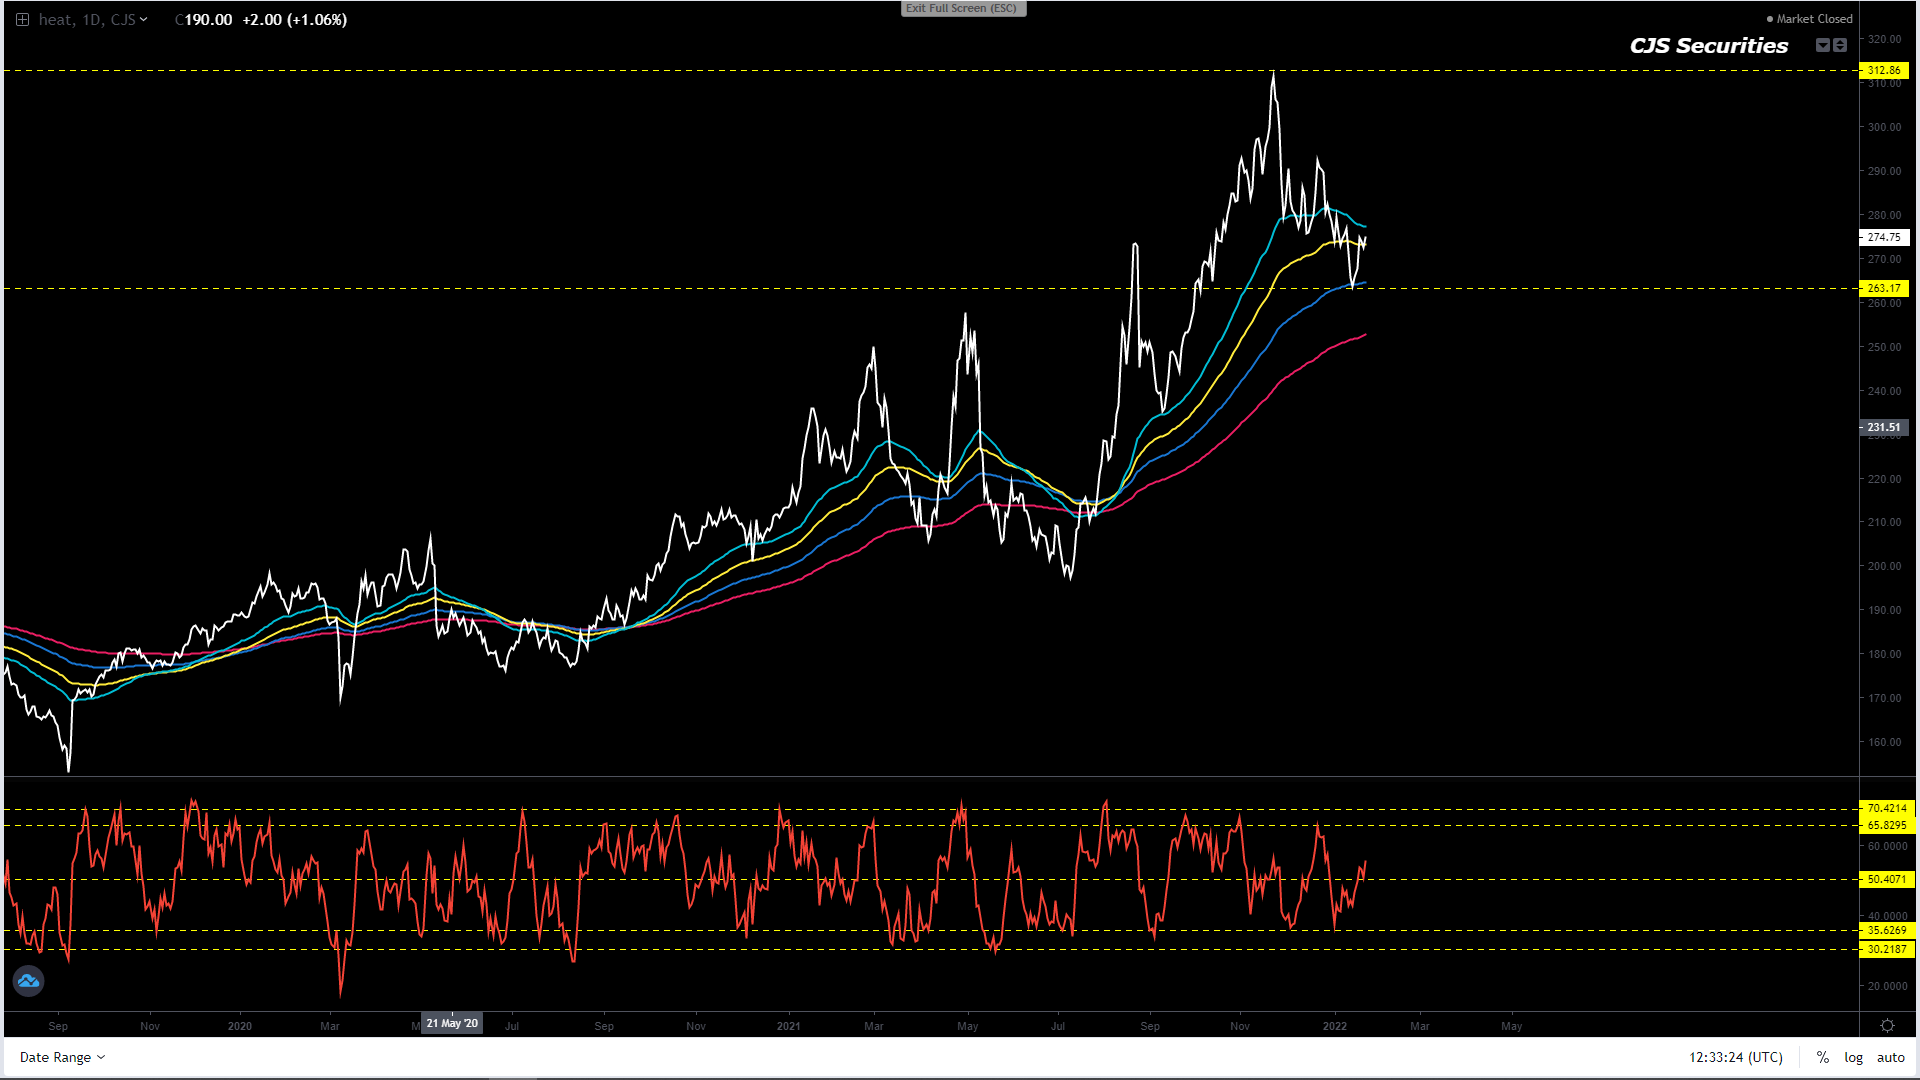
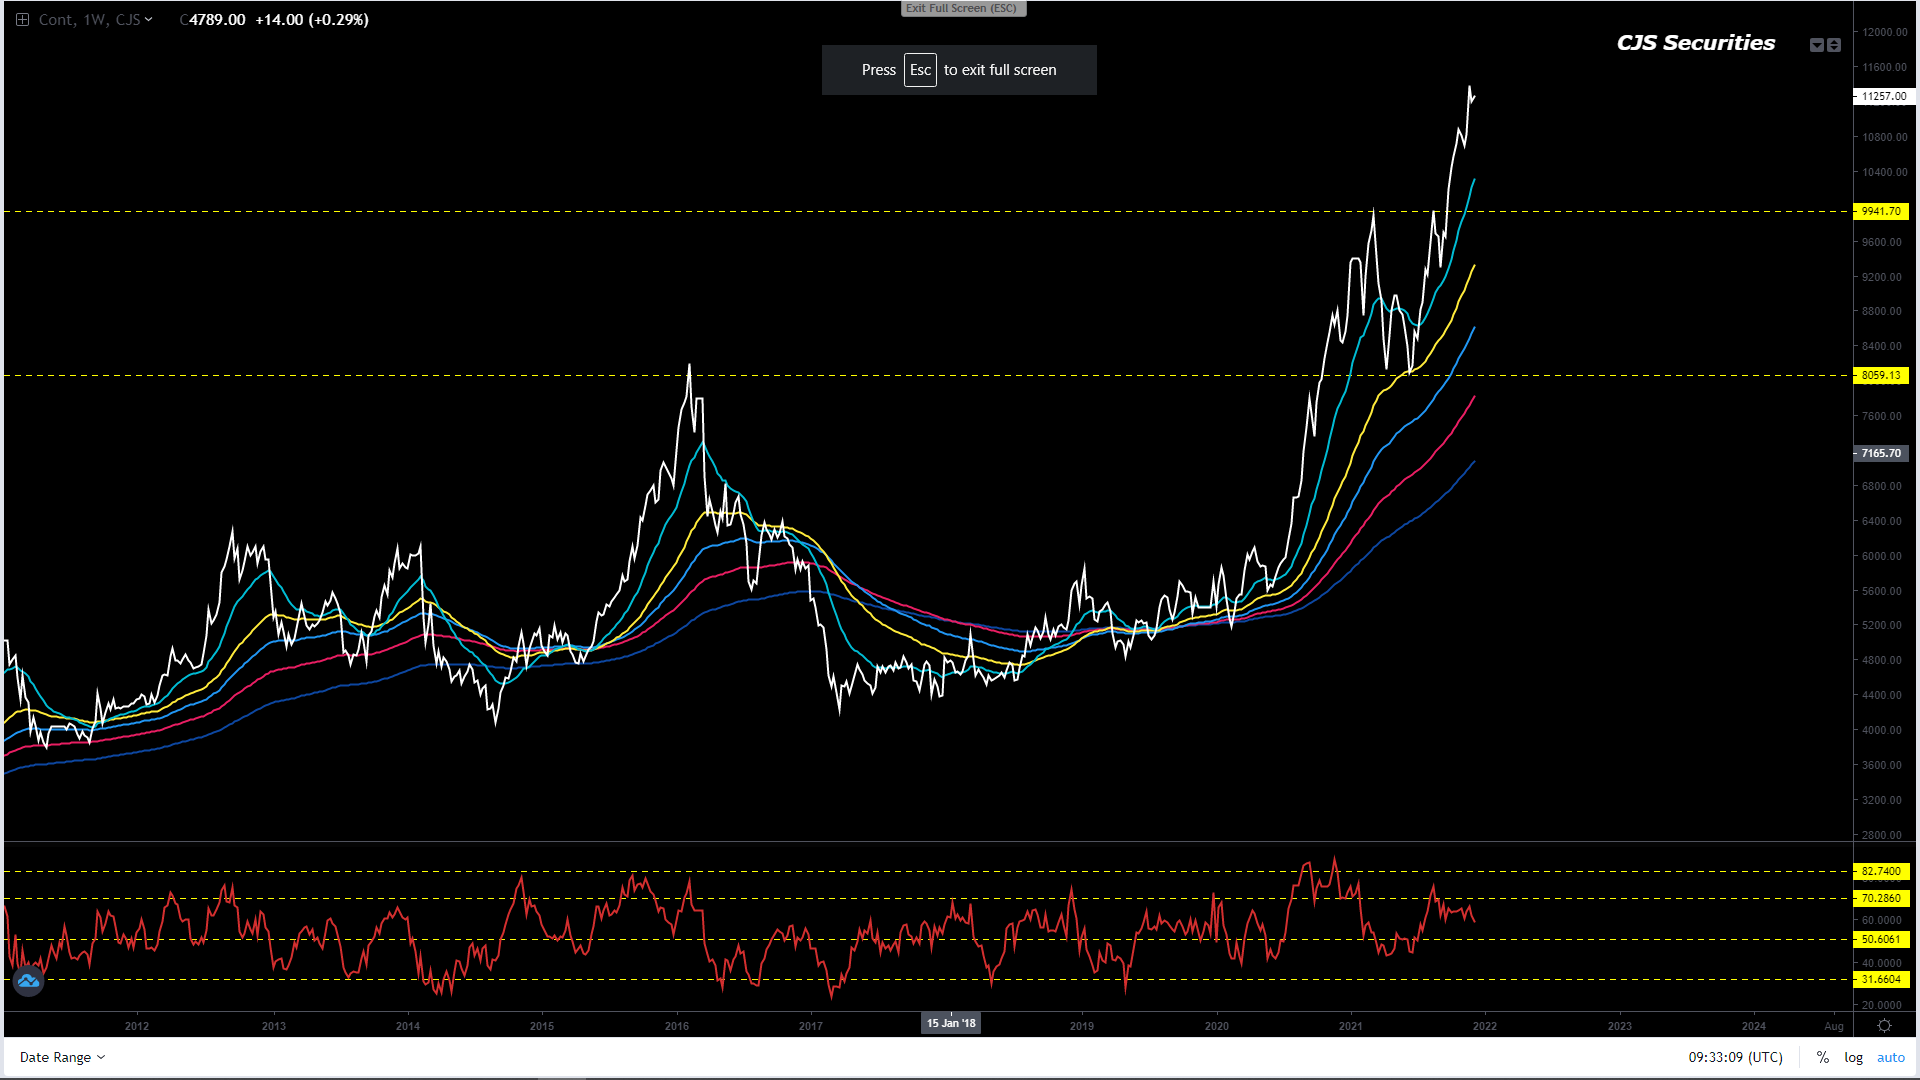
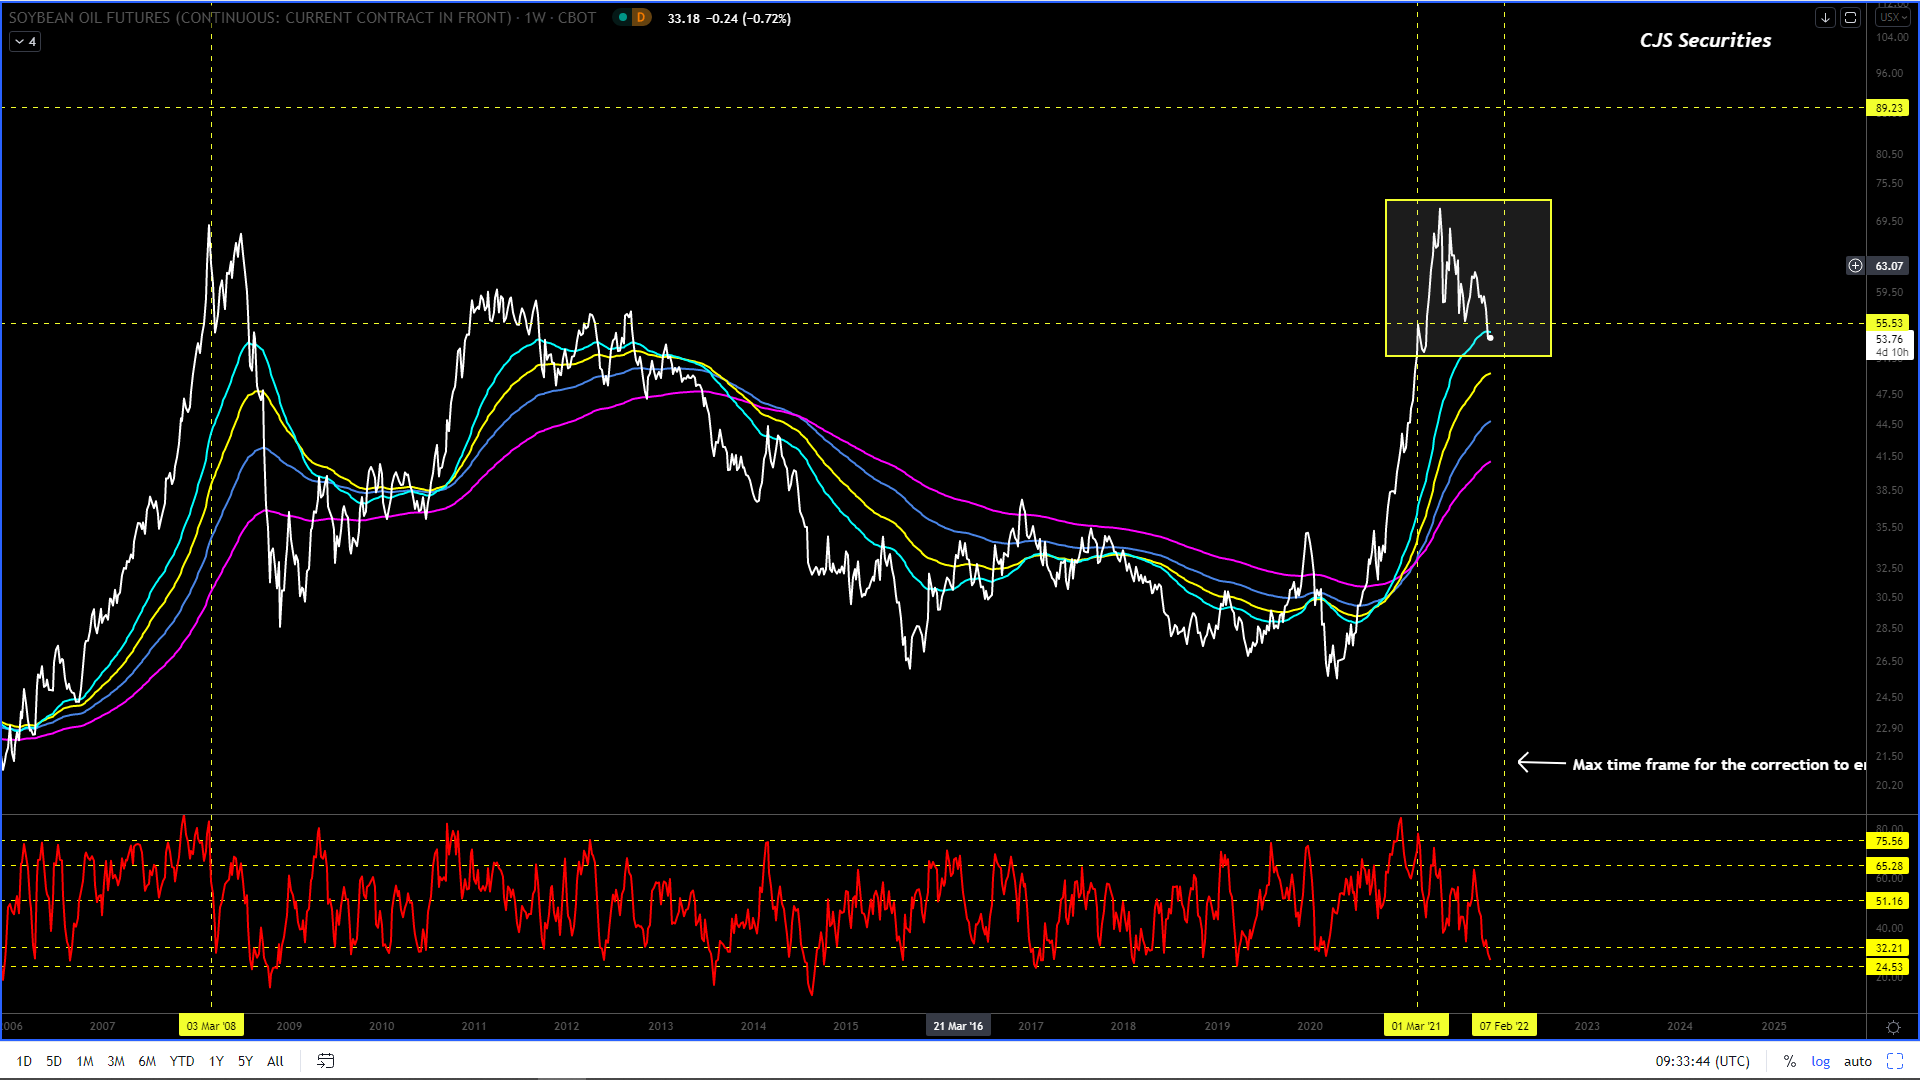
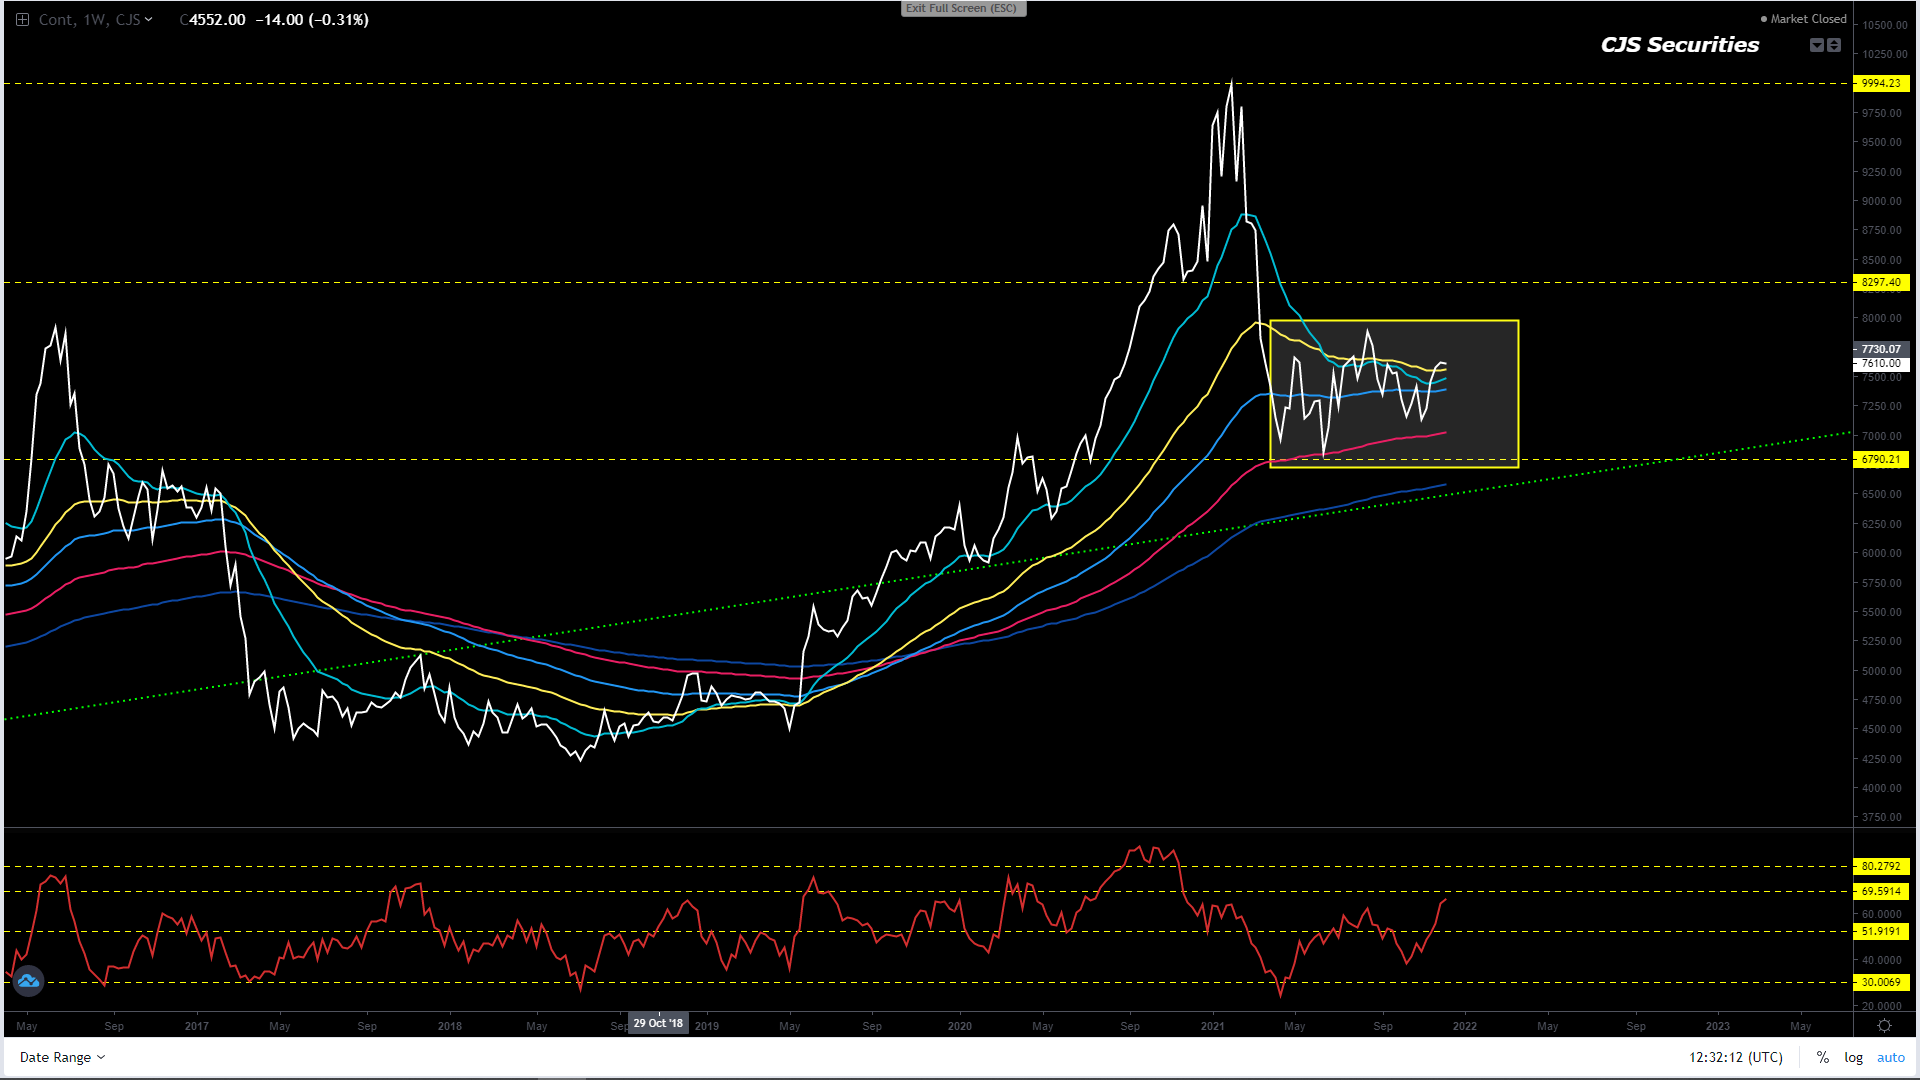
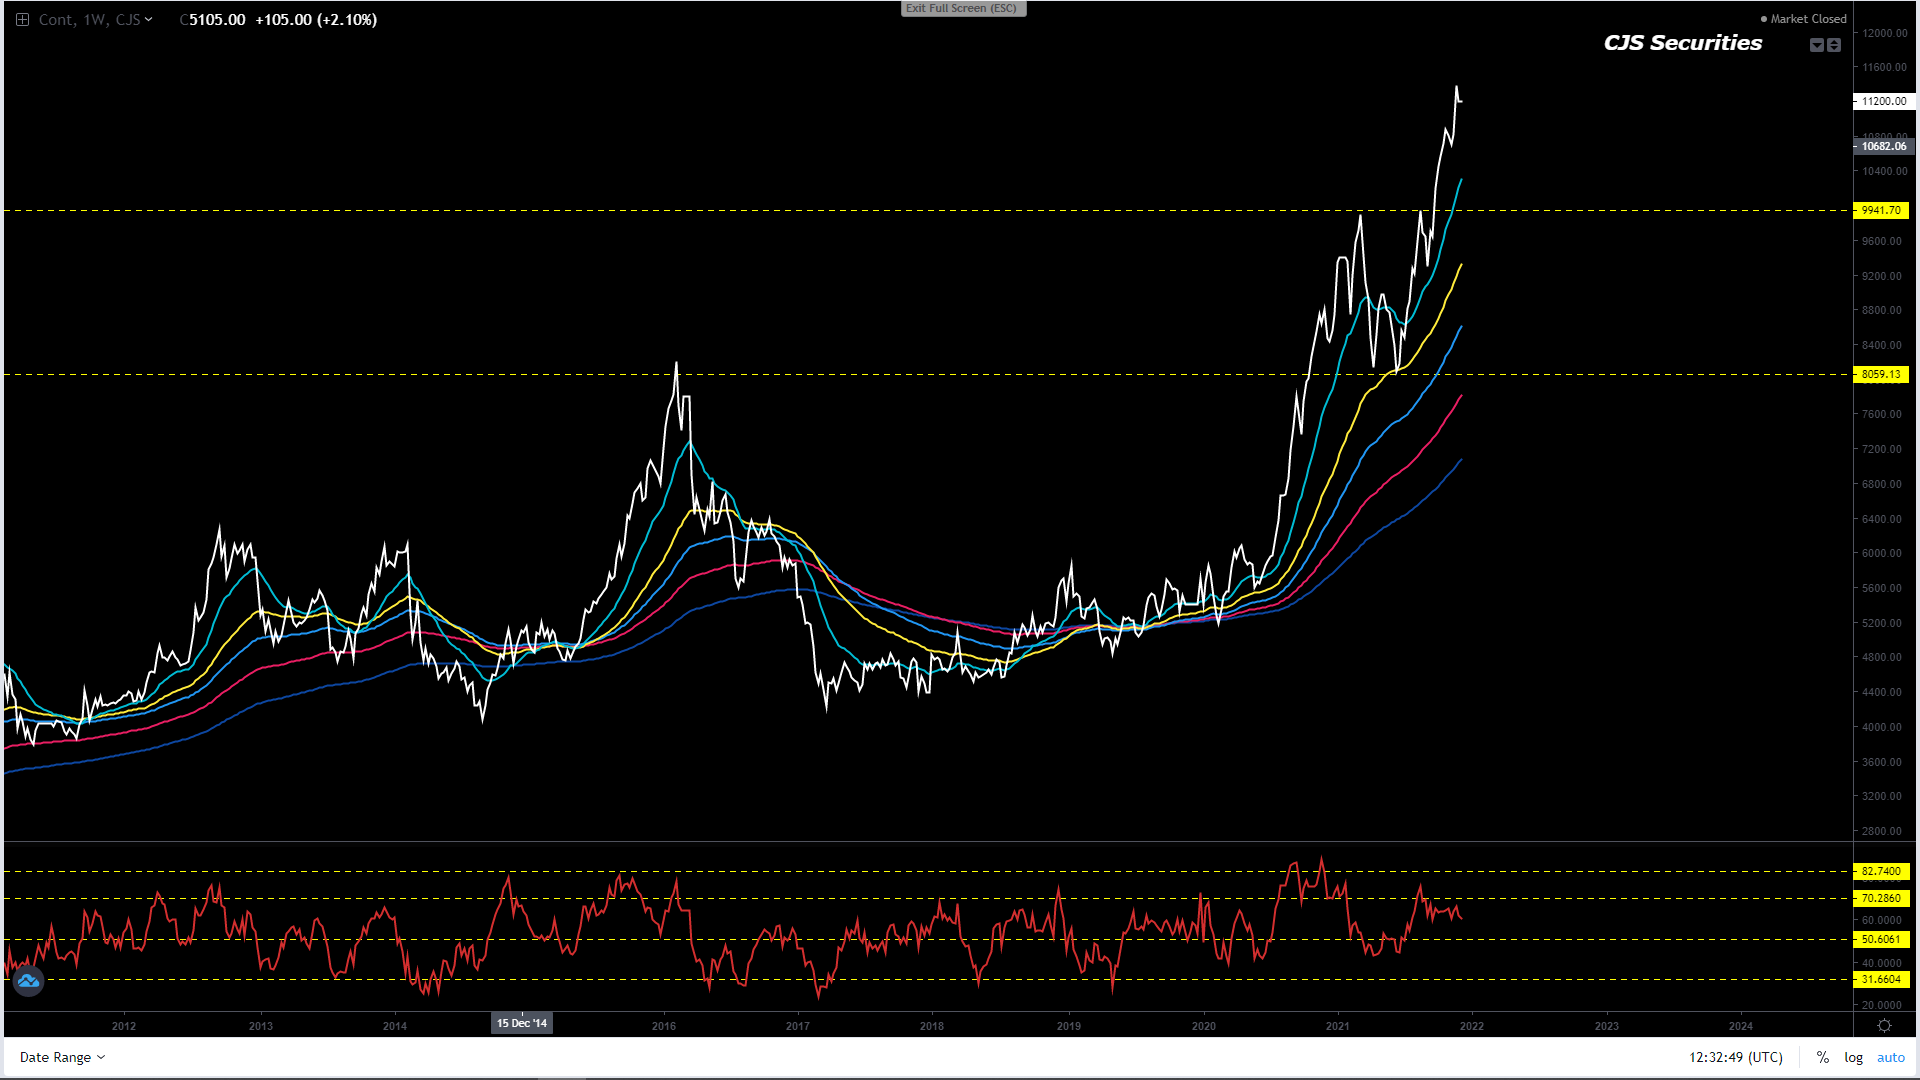
Last week I stumbled
on some research showing the ZAR’s 87.39% correlation to the CRB Index over ten years.
I decided to overlay
the ZAR & the CRB Index (see chart), and one can see that the correlation
is strong.
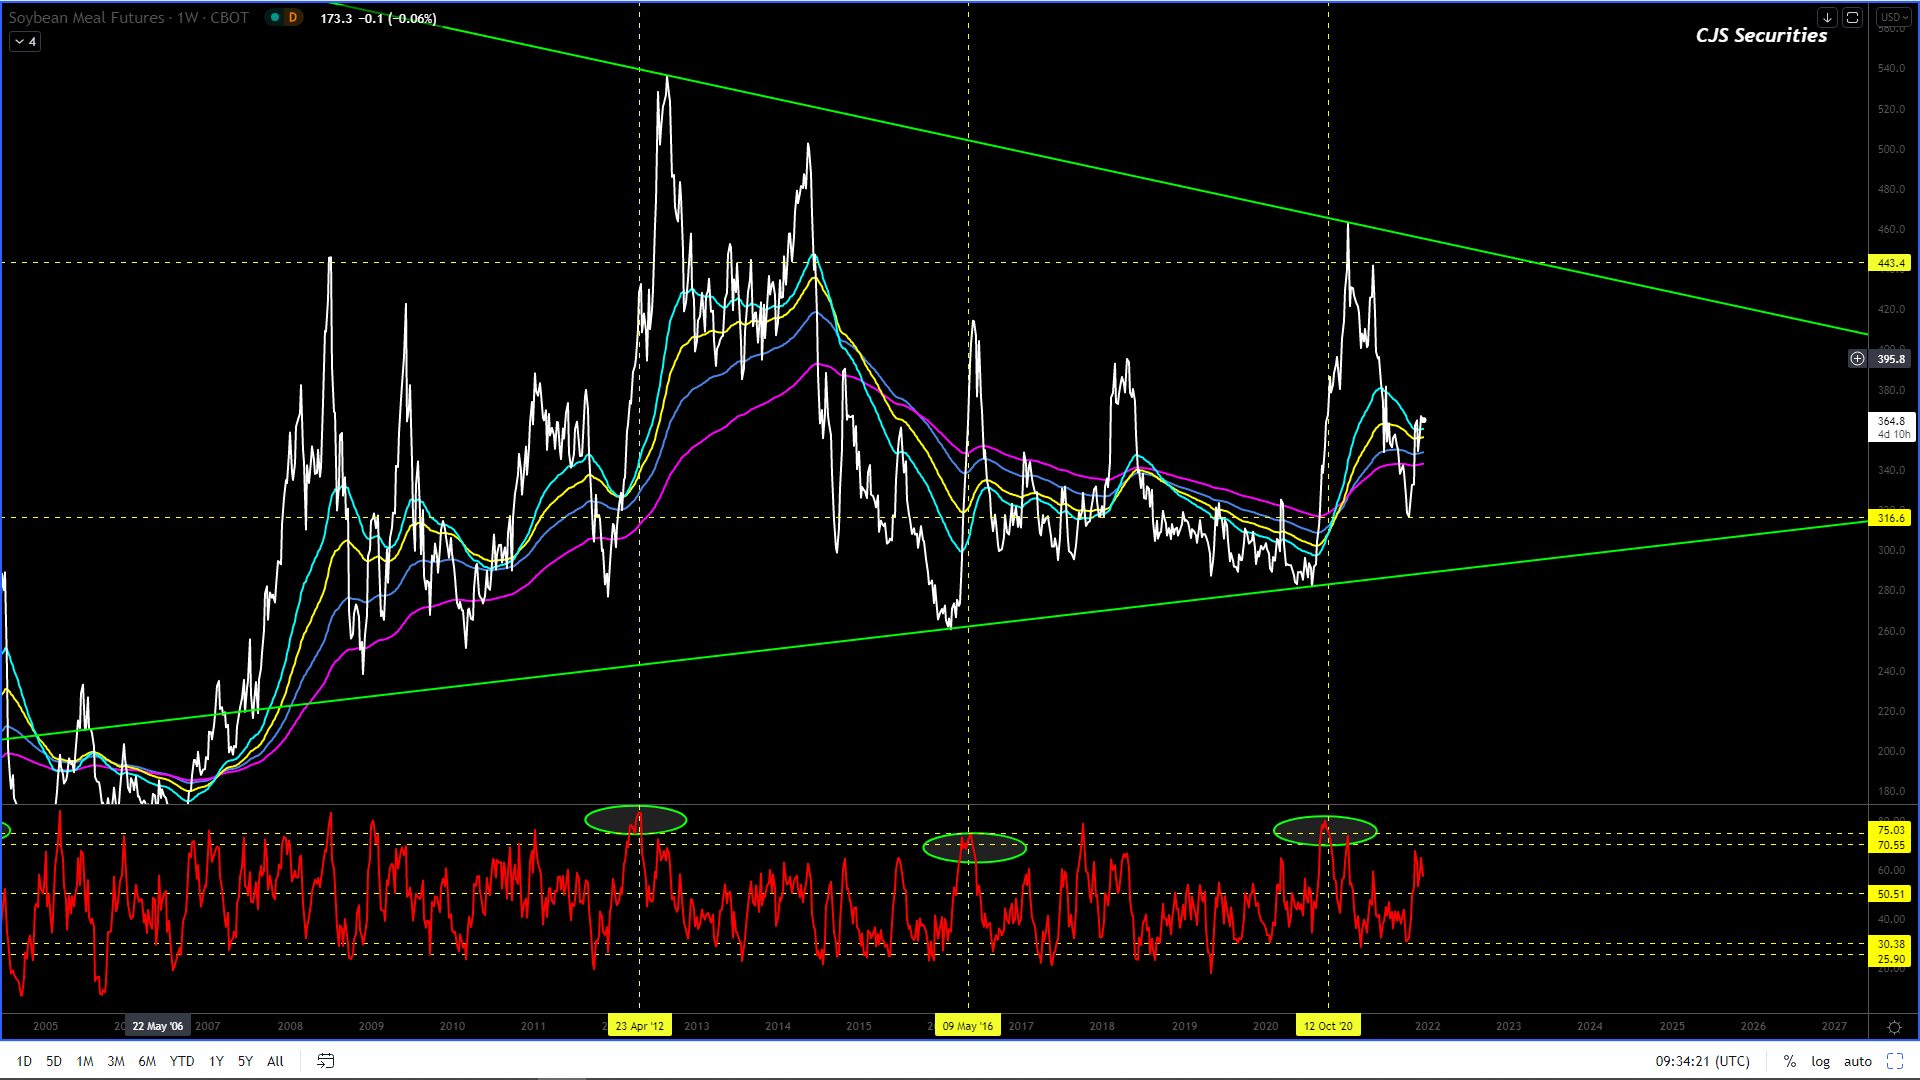
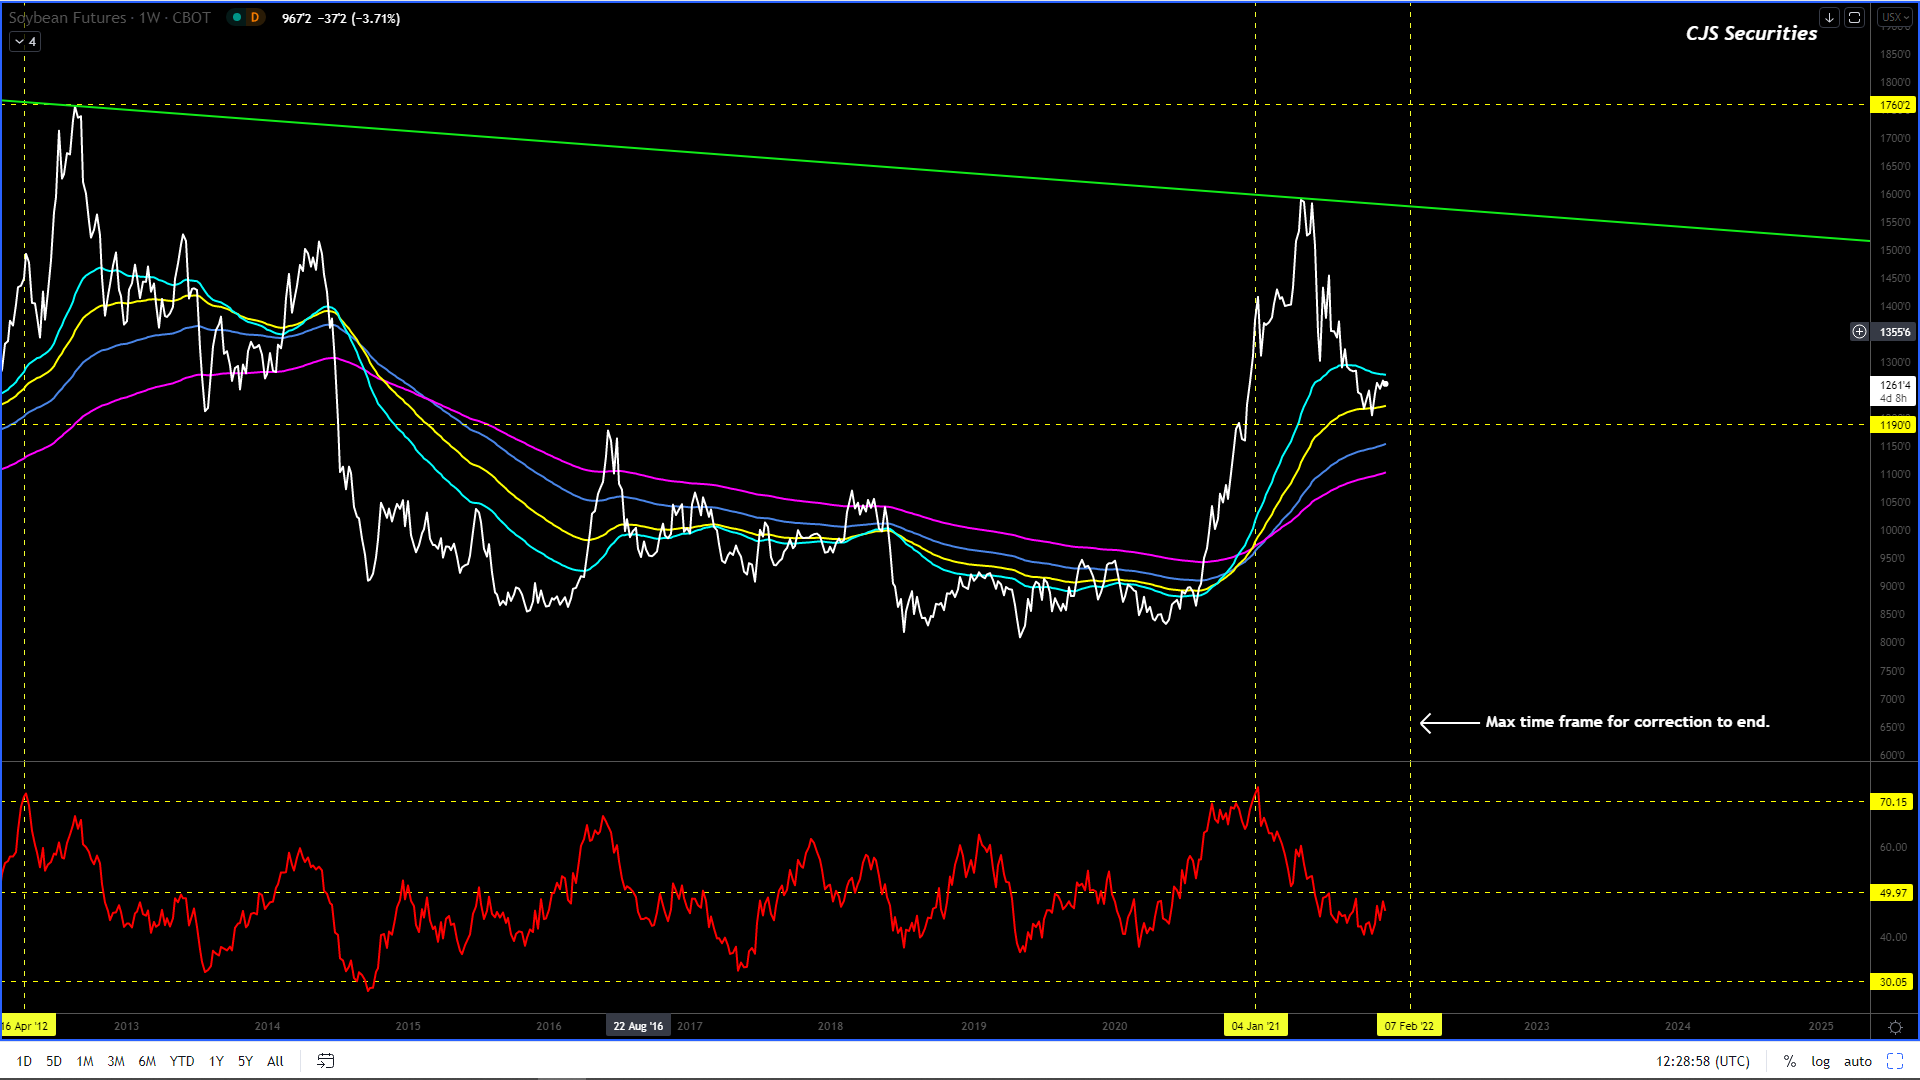
If one believes in the
commodity bull market, one cannot ignore the fact that the ZAR should
strengthen significantly over the next 24 months.
Please note that the
above view does not mean the ZAR cannot weaken as there are Black Swans that
could quickly raise their heads this year with geopolitical tensions that could
see the ZAR go through a risk-off environment before strengthening.
However, I can now
confidently say that all significant spikes relating to ZAR weakness would
constitute a short of the Dollar Rand chart.
In closing, the state
of the economy, the potholes in your suburb, and the general negativity you may
feel have nothing to do with the direction of the ZAR, and at this stage, the
ZAR is set to go where it hurts the most players!
Happy hunting, and may
2022 be the year of patience in your trading.