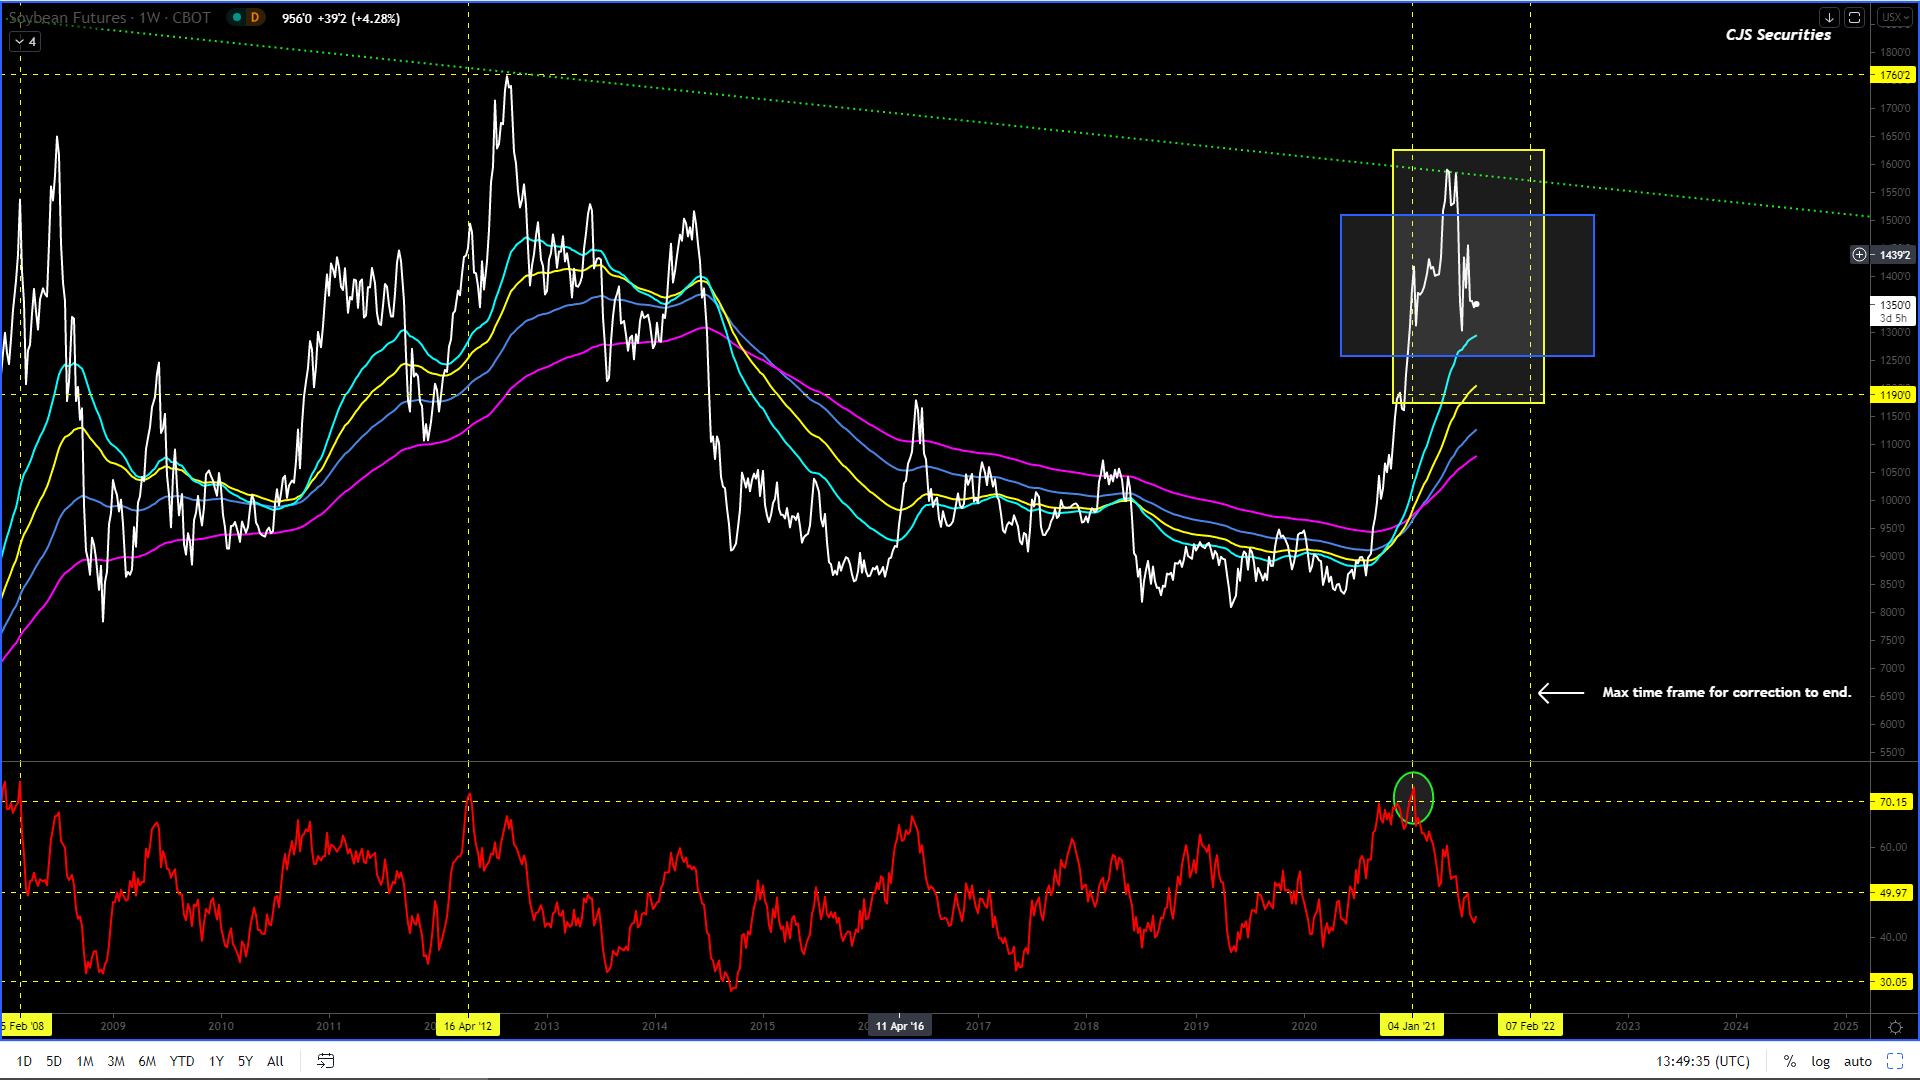
This correction remains far from over and could take a good few weeks, if not months, to complete.
Use all the rallies to take profit but keep a core long as the major trend/cycle is up.
Please don’t chase this market as technically there are BULL traps being set everywhere!
If you are lucky enough to see a move sub $12.40 on the November 21 expiry), own it for the LT.
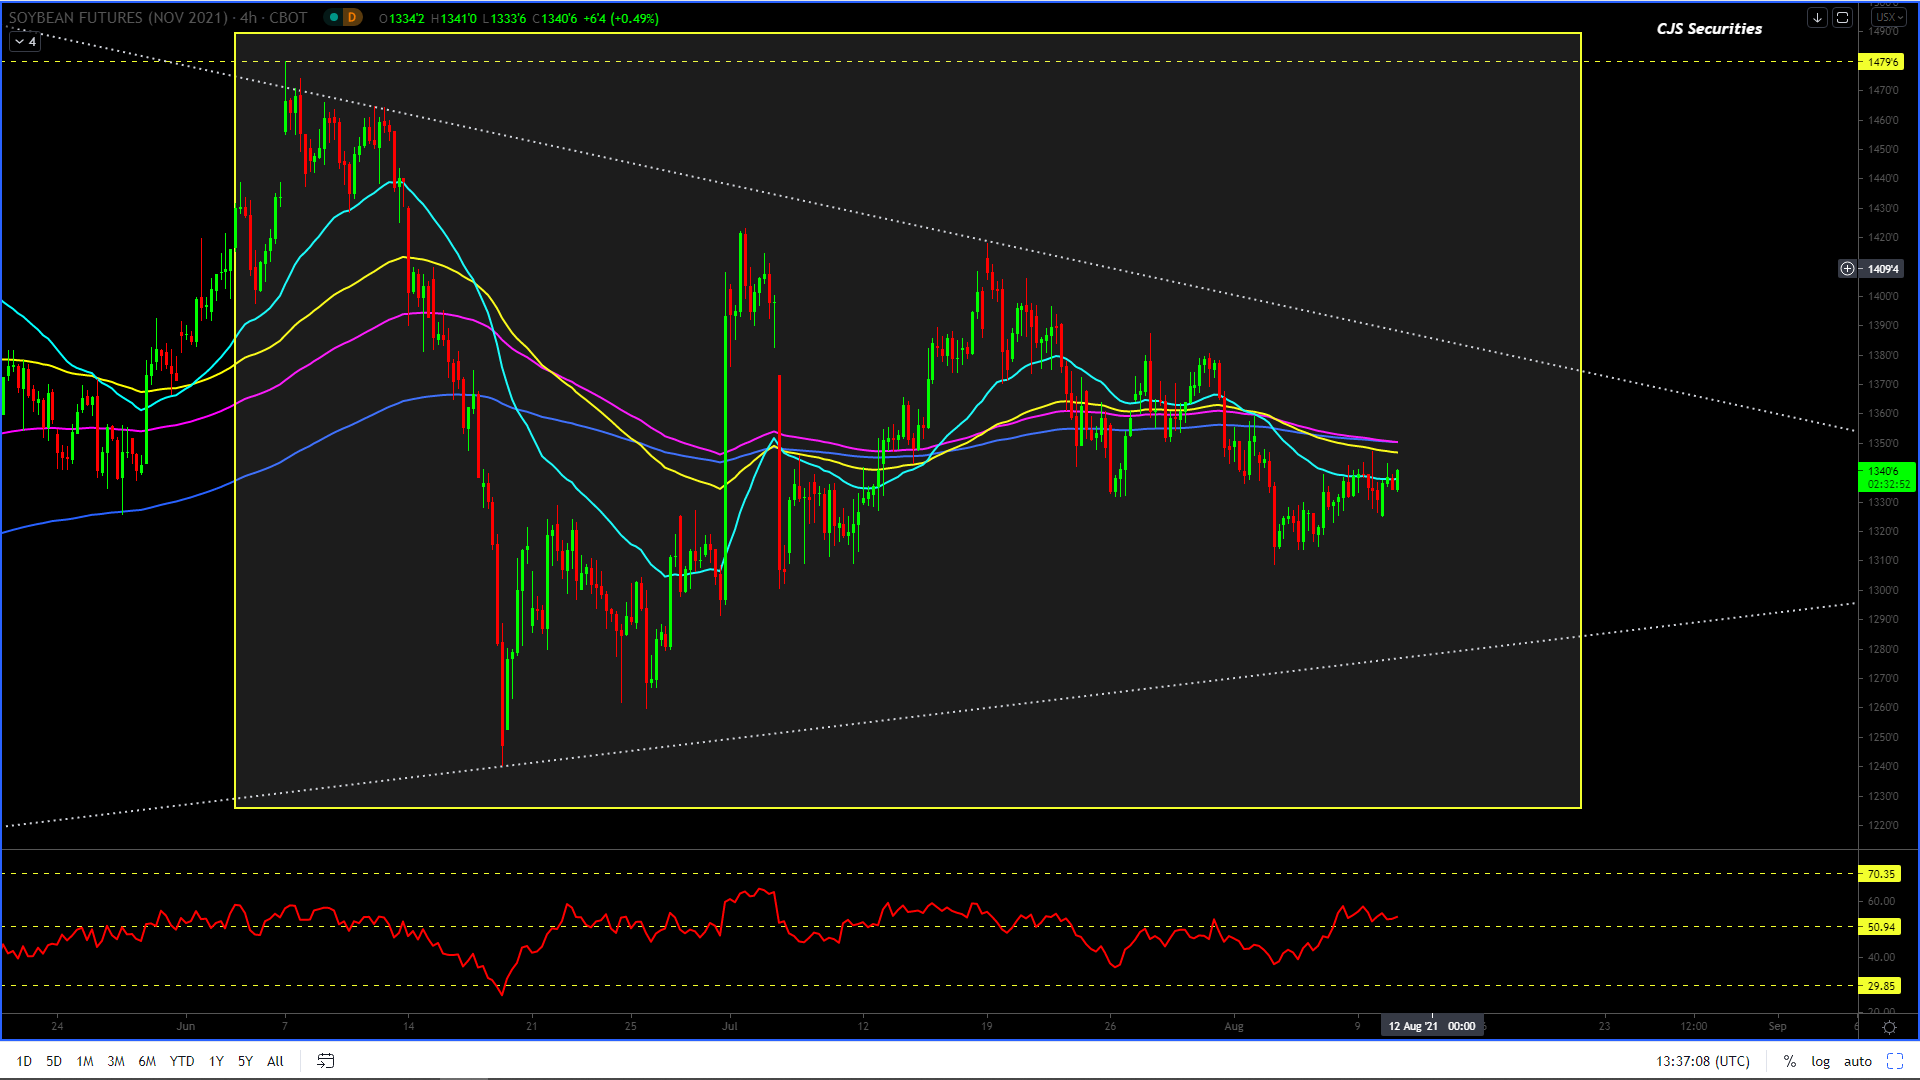
240 Min CBOT November 21 Soybean Candle Chart
The triangle formation is broken, the market is broken and it’s either looking to print $12.40 or $11.80.
It’s a real pity we never has a chance to implement the short trade over $14.00 but now all I will say is that this chart will be a BUY of mammoth proportions scale down from $12.50.
Should we see a trade sub $12.00, nothing will have changed other than some players will have REAL panic and should this transpire, own it all!
Board Crush Continuous Daily Close
This chart is a buy and a scale down buy with a stop under $0.88.
I feel that the ST correction is over and that this chart could easily rally to $1.20.
Oil Share Continuous Daily Close
This chart is still bullish and I would buy a dip as 50% is well on the cards!
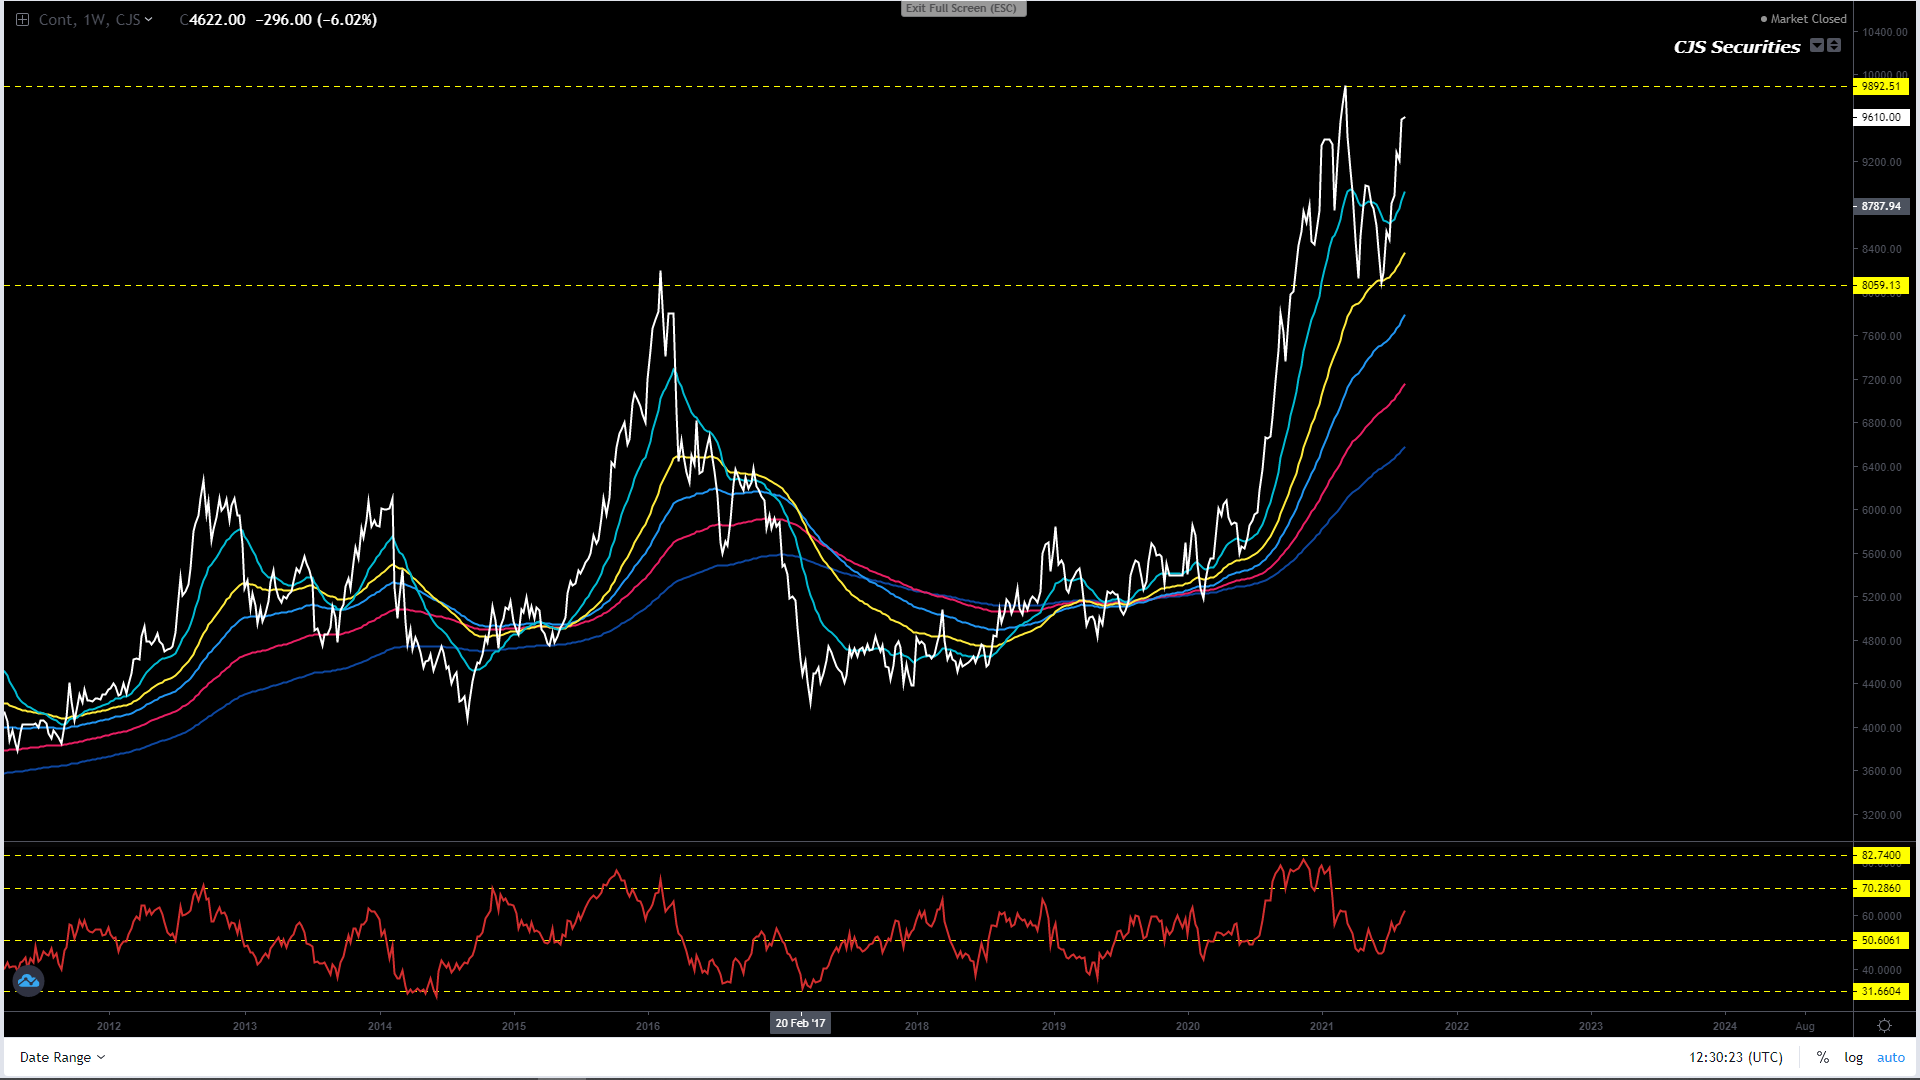
Weekly SAF Soy Continuous Close
I
have not been sold on this chart breaking much higher and as it stands I am
still not that bullish.
The
level we all need to watch closely is R7600
as a move under this could see the chart drop with R300
– R500.
Weekly SAF Suns Continuous Close
The chart has nice weekly double tops and we should see a decent pullback from current levels.
However this pullback will be a buying opportunity as the bull market is far from over.
I would to buy scale down from R9550.
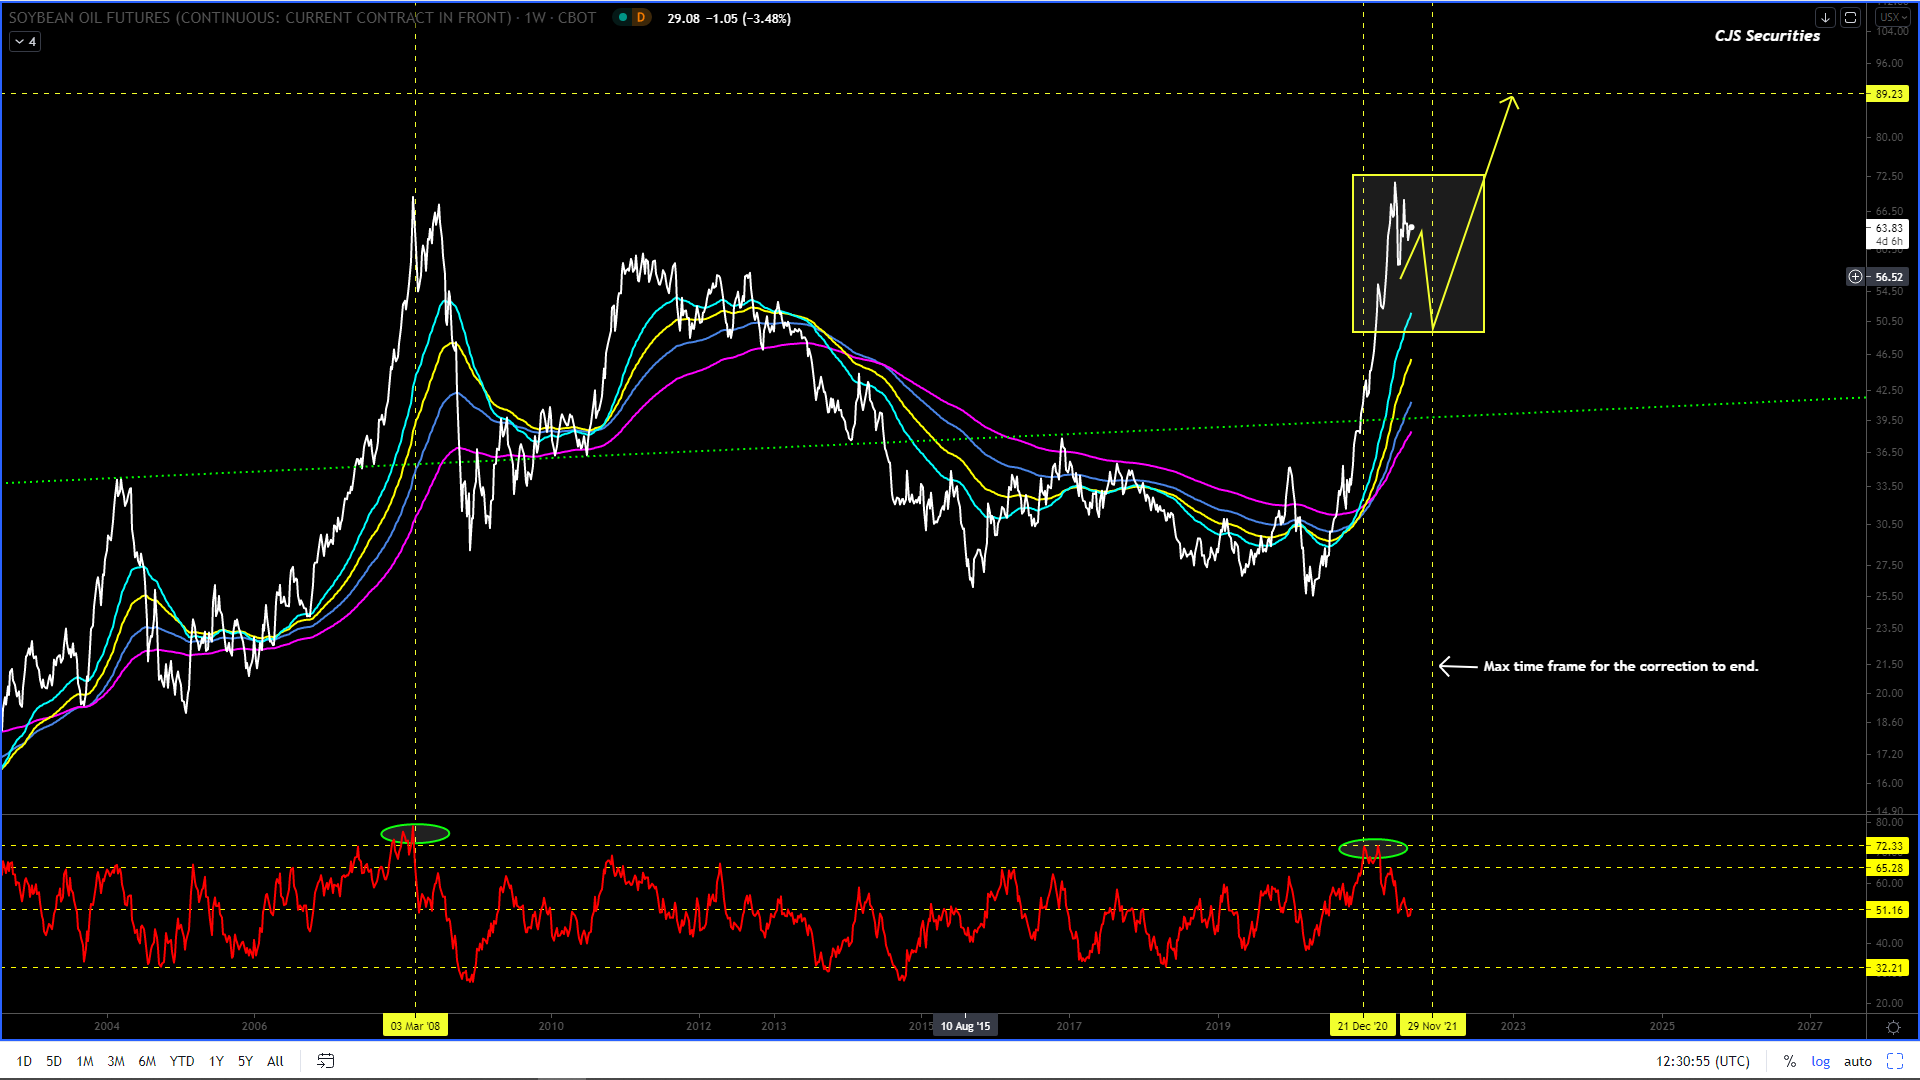
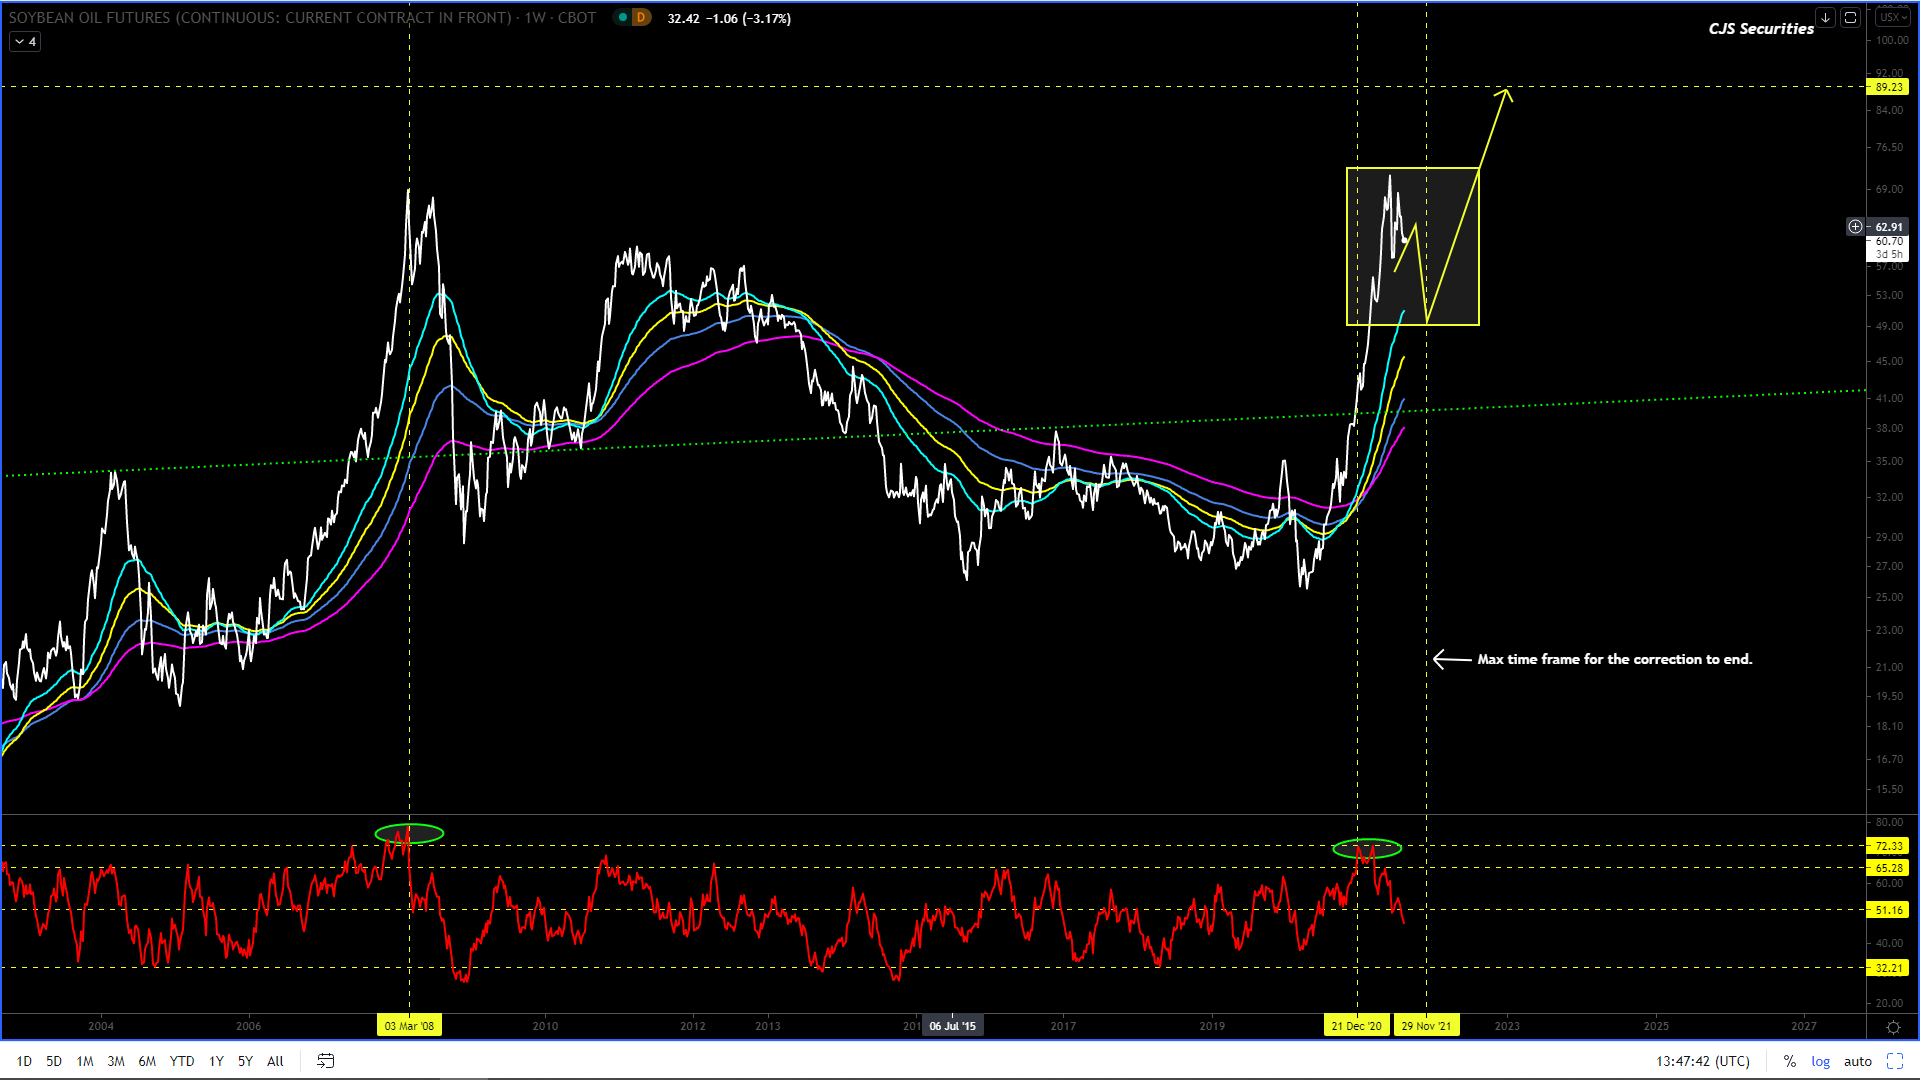
Weekly CBOT Soy Oil Continuous Close
Head on a chopping bloke, the correction looks over!
If I am correct and the correction is done (I feel good about this one) the upside targets will be between $0.85 -$0.89!
I almost feel that we don’t have enough cash to get as long as we would like, buy at best and scale down, this is budget making stuff with sprinkling of retirement!!!!
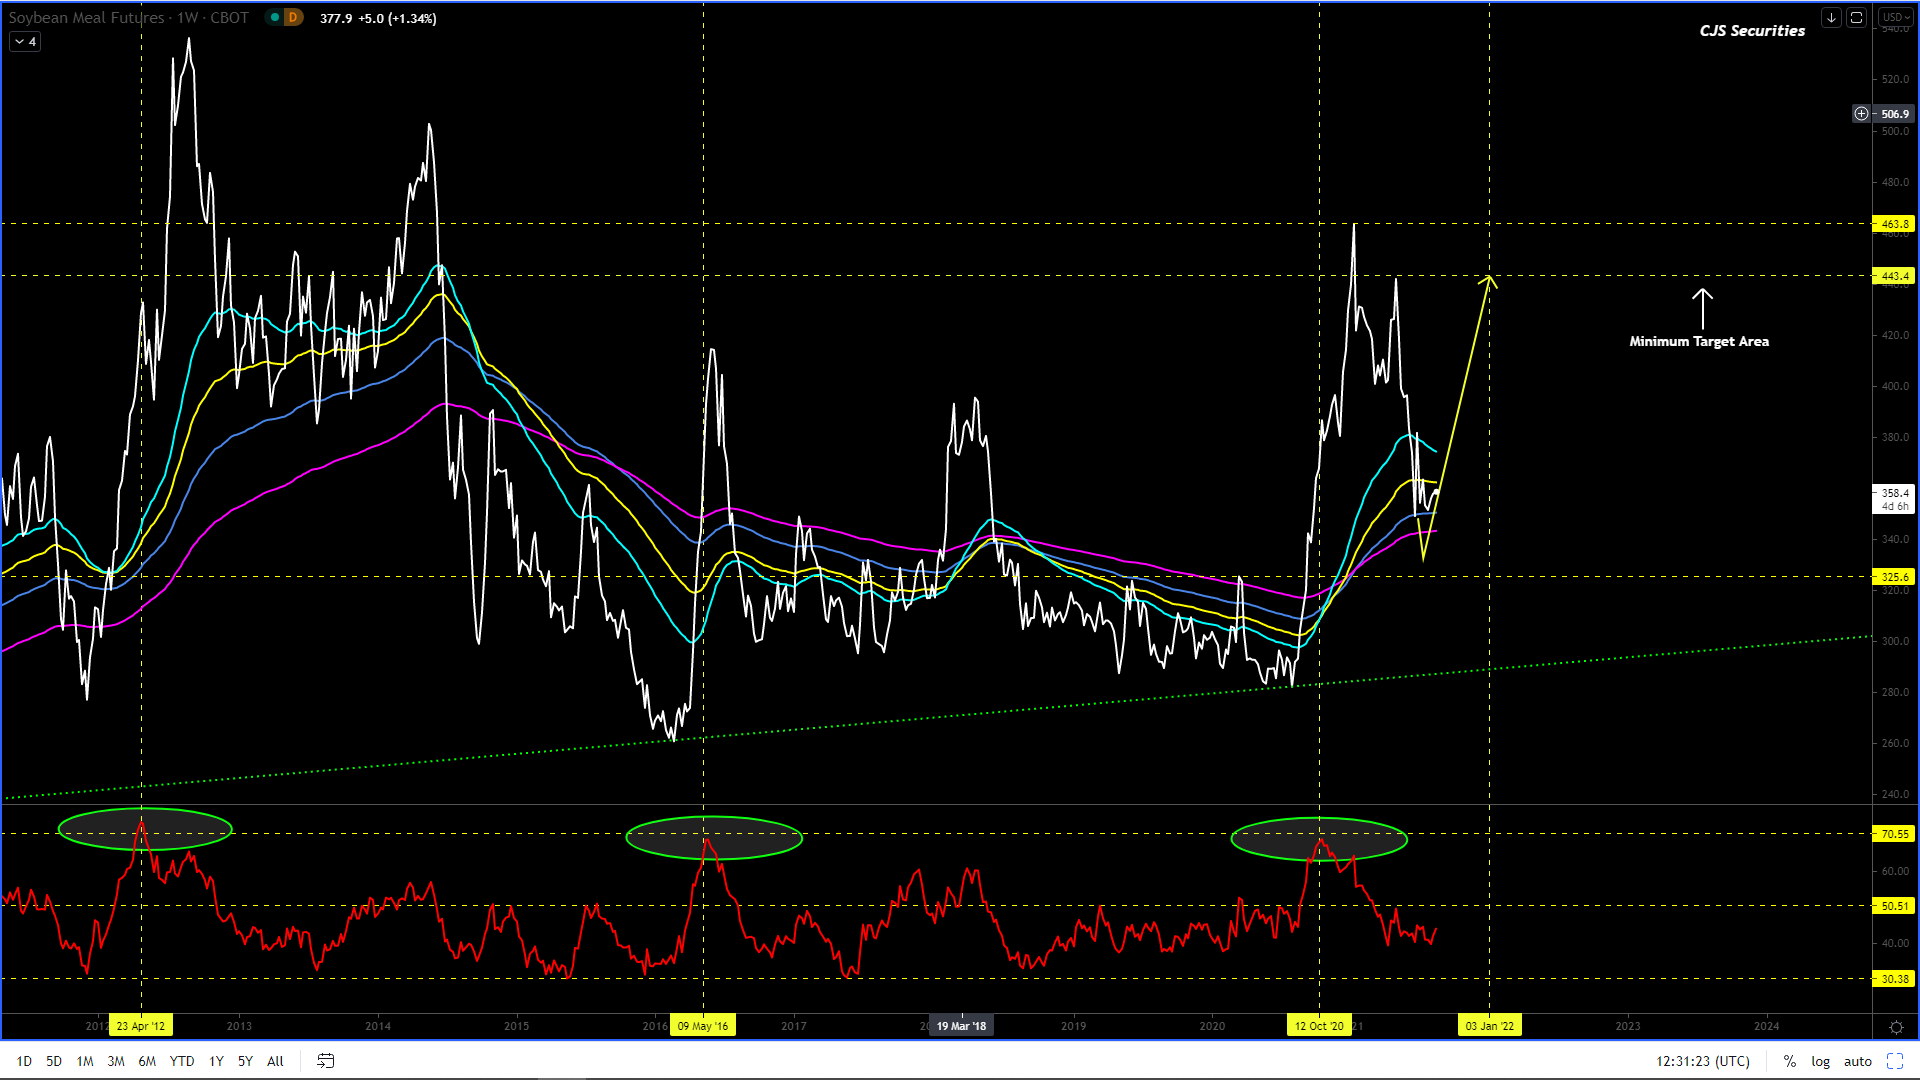
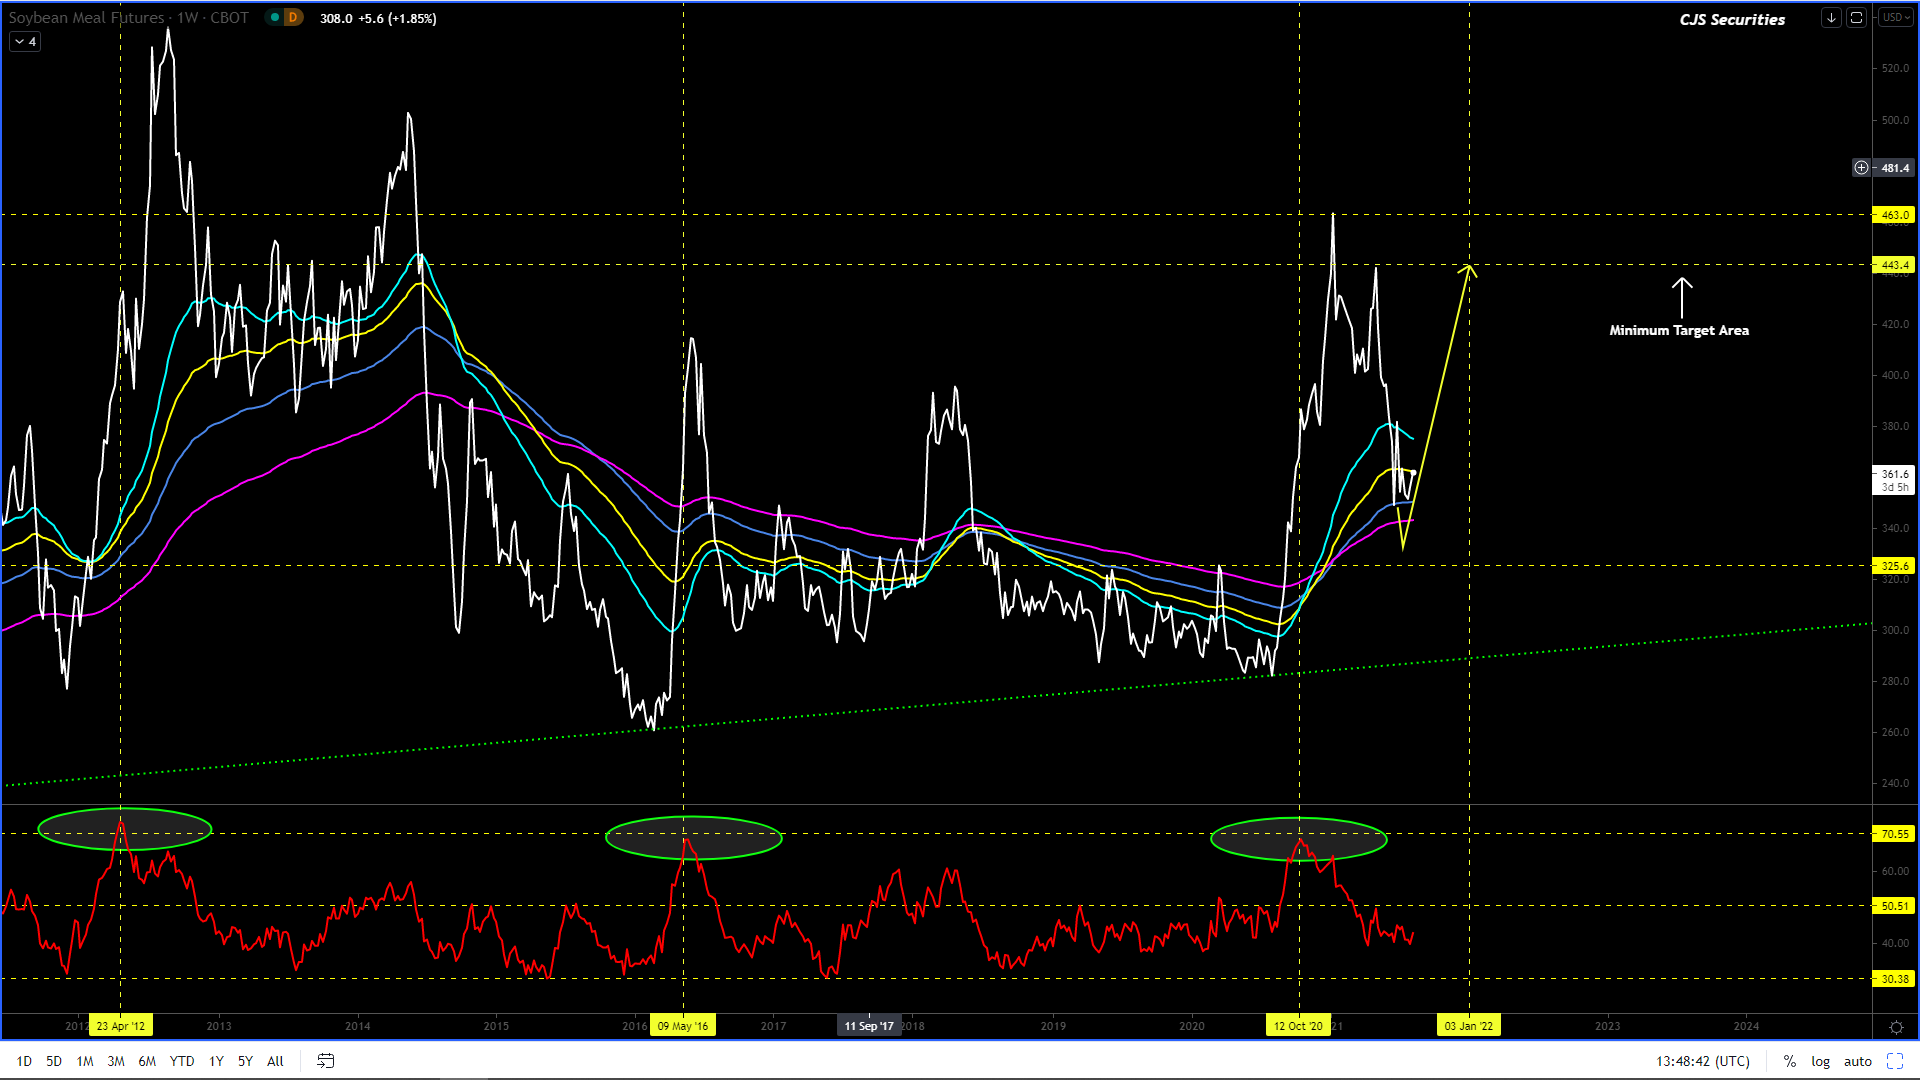
Weekly CBOT SBM Continuous Close
My
“fugly” dog that I love so much is taking forever and a day, but I still feel
that all dips are buying opportunities.
I
remain in love with this chart even though right now it’s in conflict with my
SBO view.
The chart remains in a corrective phase with very little movement over the last 2 weeks.
The correction will only break with a weekly close over $6.42.
I would only consider the Bull story to be over should we have a Weekly close under $4.56.
Until then, all the deep dips REMAIN buying opportunities.
The rallies remain selling opportunities (profit taking only) and the dips remain buying opportunities (getting long)!
I REMAIN really bullish in the “big picture” but, we could easily see this market come off after trying to print $6.00, so in short you may well have the chance to get long sub $5.00!
240 Min December 21 Corn Candle Chart Close
This market is truly testing ones patience and especially on the shorter time frames.
I still feel that this chart can print $6.00 – $6.11 but post this we should see a decent pullback printing a minimum downside for $5.16 – $4.99 and potentially as low as $4.70.
I don’t expect this pullback to be sustained and at this stage I highly doubt we will see a daily close under $5.00 and should we see the sub $5.00 level IMO it would only be intra day.
I REMAIN a proponent of BTD’s and take cash on the rallies!.
Weekly WM Continuous Close
#No Change in commentary
All the dips are buying opportunities and anything close to R3000 will be the biggest opportunity.
My ZAR flat price view is that R3000 – R2800 will be the ultimate low should we get there and that one cannot afford to be caught short as a change of trend can occur at any moment.
Weekly YM Continuous Close
The pullback seems to be on the cards but all pullbacks are buying opportunities!
Once the correction is over this chart will be looking to break out to the upside by R500 or more, but I am not sure this is sustainable due to my Corn view, fingers crossed!
Weekly KC Wheat Continuous Close
This chart has ST double tops and I now expect a decent pullback in the coming weeks.
We are now patiently waiting to buy this pullback and will start to buy scale down from $7.00.
Weekly Chicago SRW Wheat Continuous
There are now very decent weekly double tops and we would take all the cash off the table as we will get another buying opportunity in the coming weeks.
The bull market is far from over but 2 – 5 weeks of consolidating / correcting will do this chart a world of good.
We would now look to buy scale down from $7.25!
The bull market is far from over!
Daily Close KC Wheat v Chicago SRW Continuous Close
Over the last 2 weeks this chart has had a decent correction and seems to have started its new rally.
The chart looks well headed to $0.15 in the coming weeks.
All I can say that I would take a sneaky punt on the chart, but definitely not basket balls and all.
Weekly SAF Wheat Continuous Close
This chart has had a great rally.
I would not be buying anything here right now as the oscillator is now highly overbought and if I were long I would be banking the cash.
Daily Matif Wheat Continuous Close
After a monster rally this chart looks busy with a deep, deep pull back and although I might want to buy the dip, I would advise patience.
This chart could end up taking players to the cleaners and hence I will let the formation play out until next week.
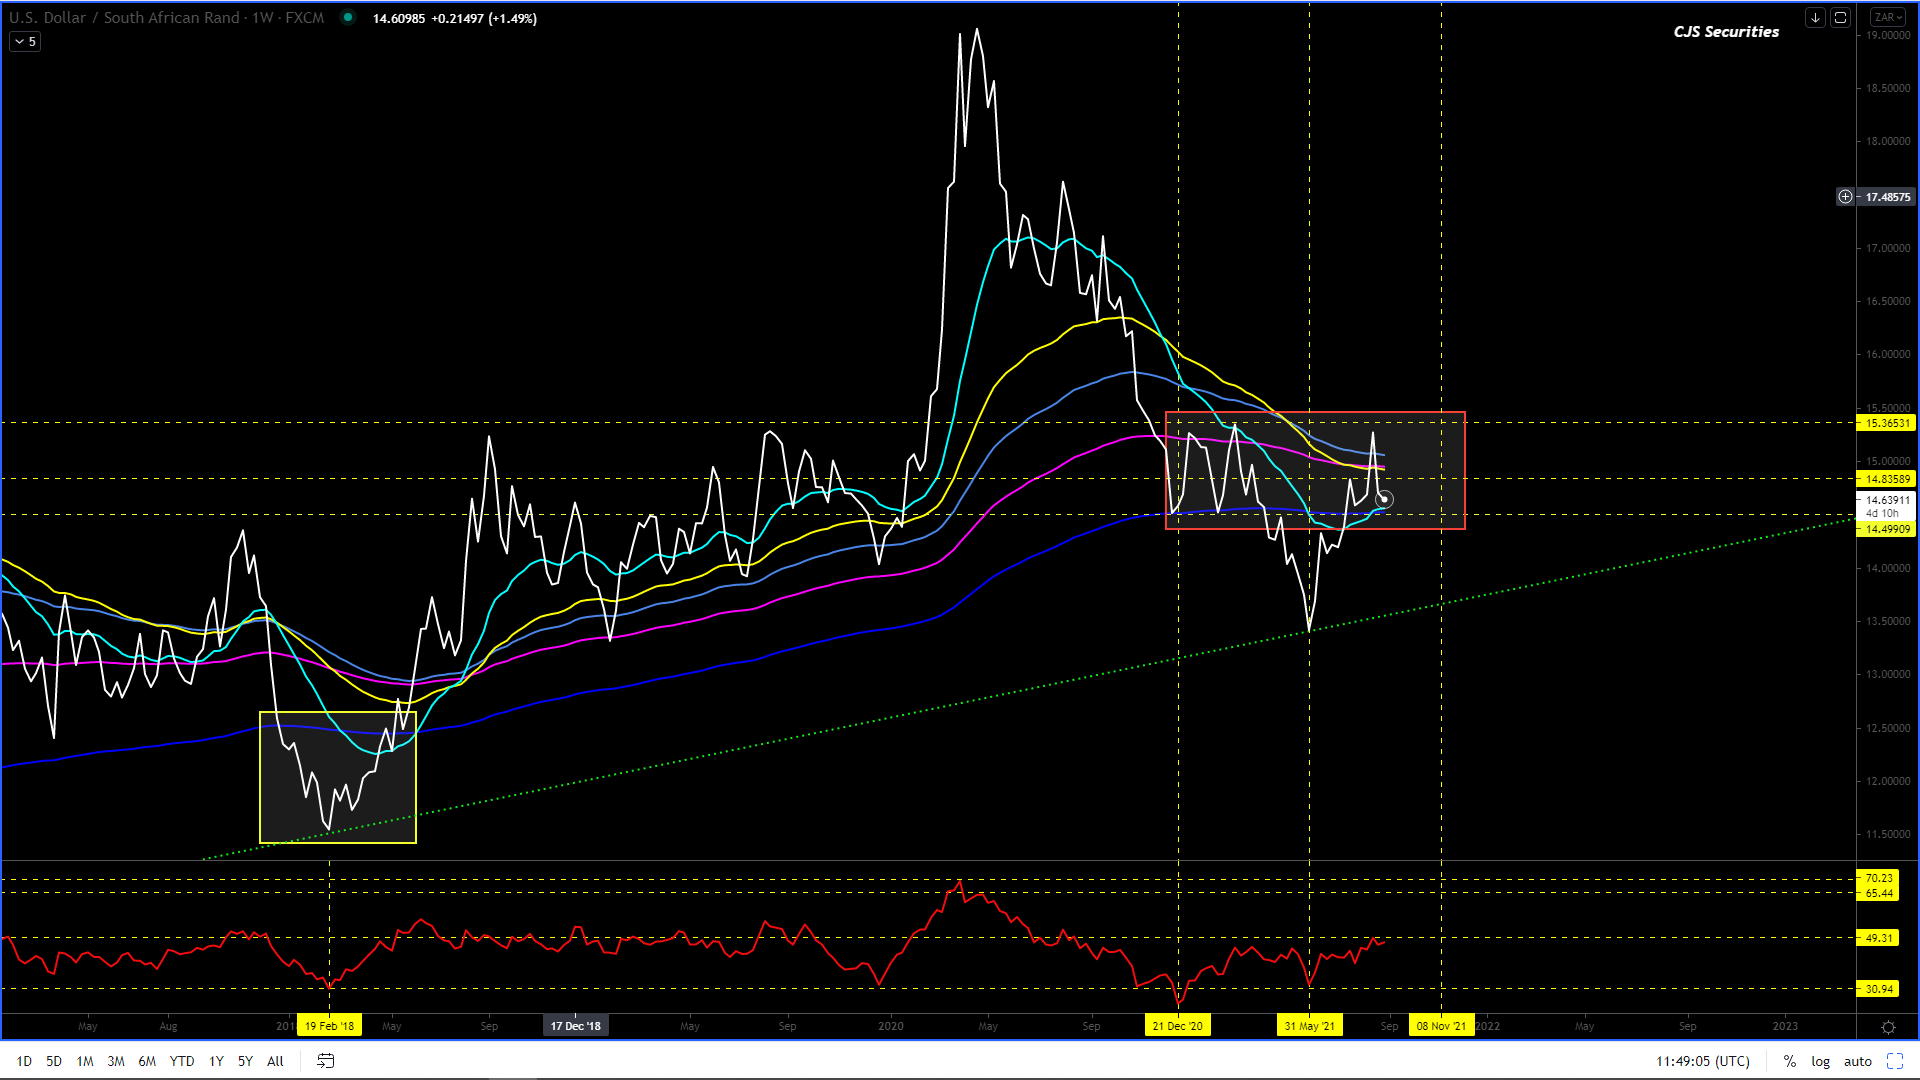
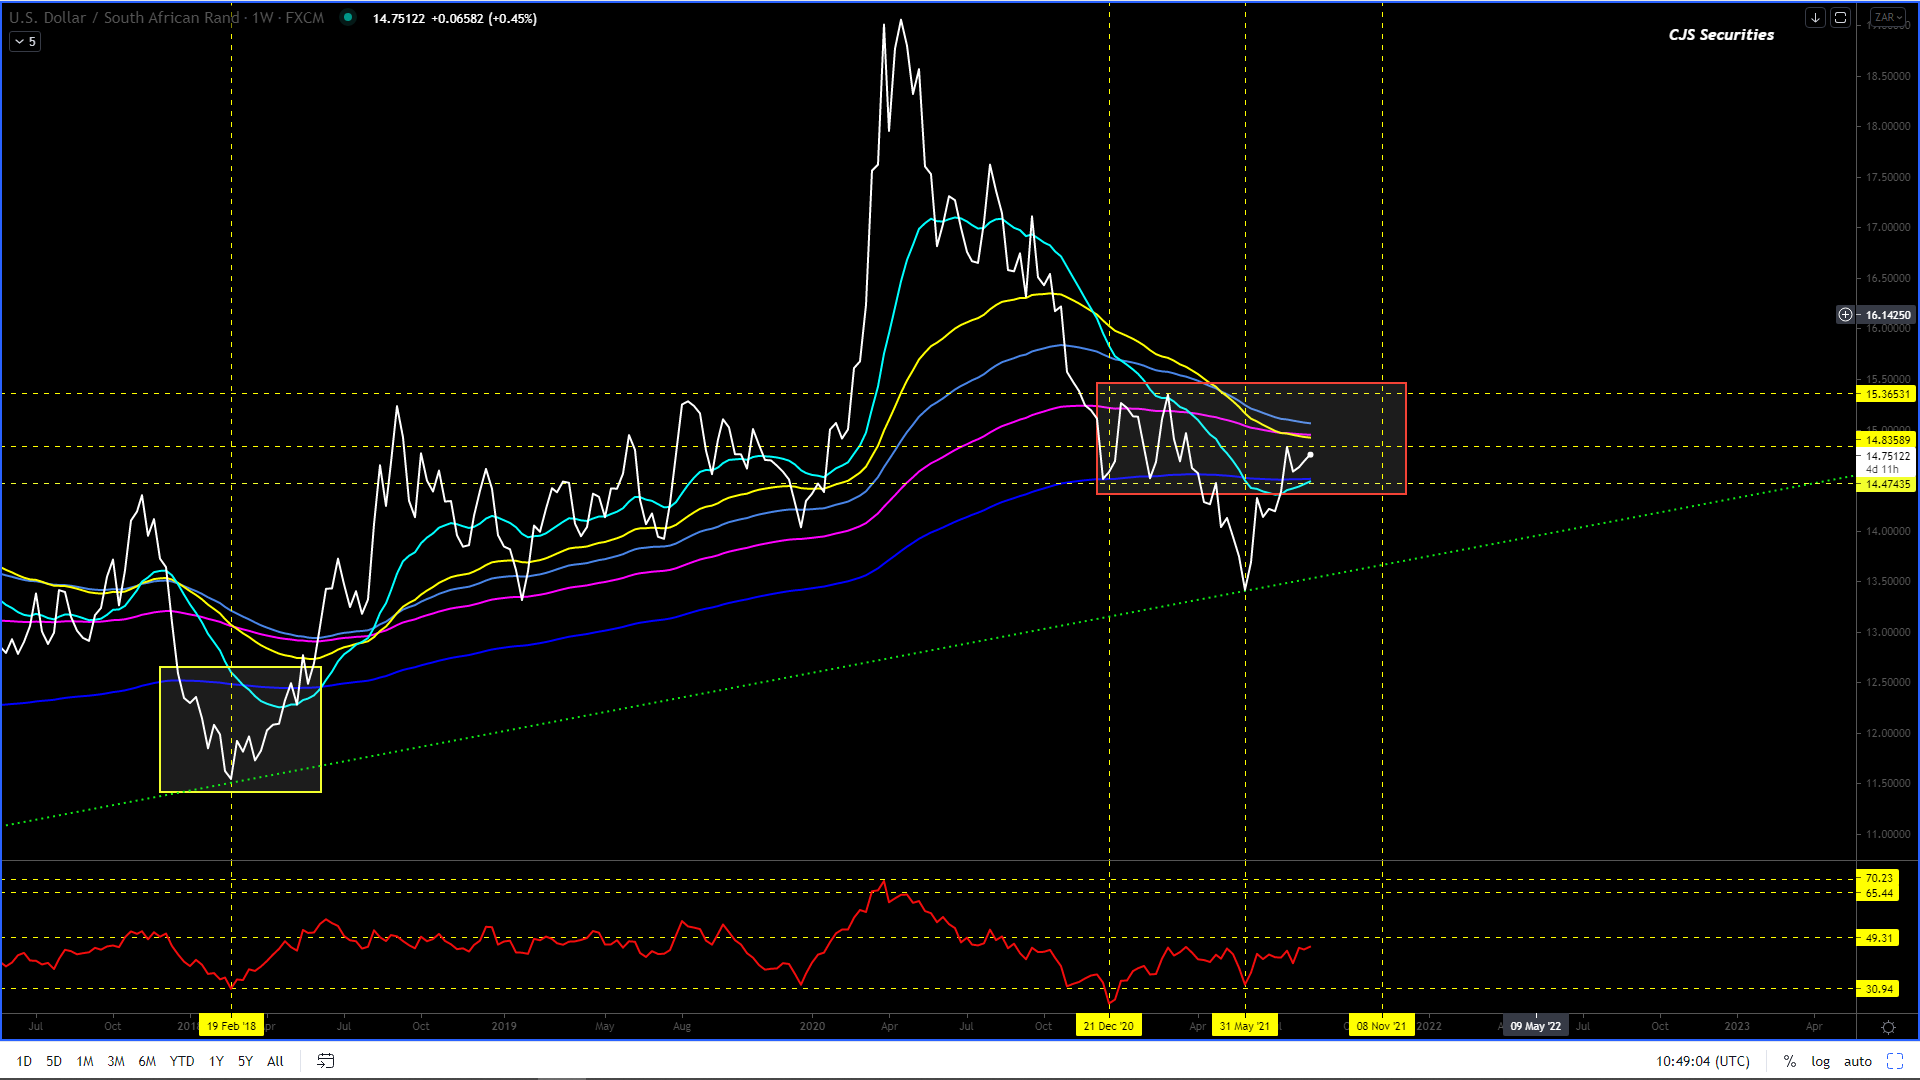
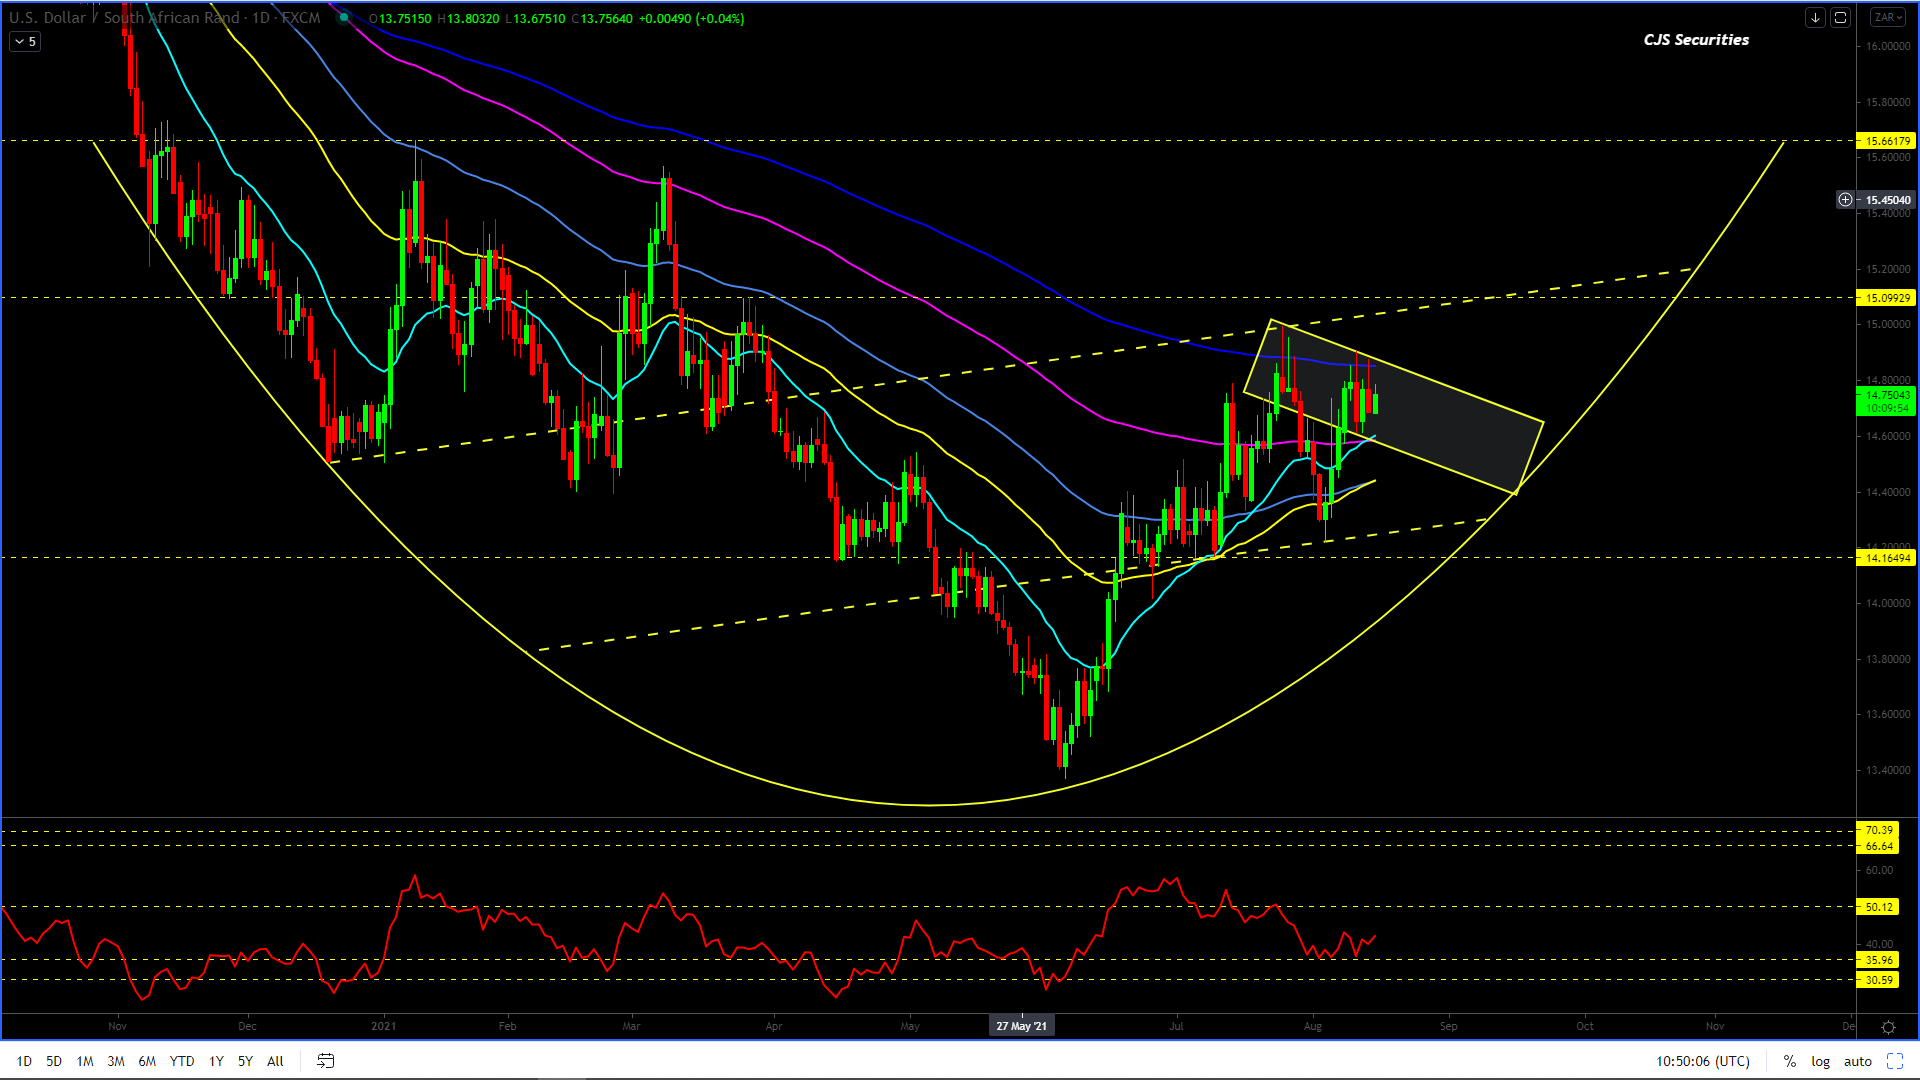
What a difference a week makes, and the R15.36 level has become a bridge to far.
After an excellent USD rally ten days ago, we have seen a wild turnaround that has changed the whole outlook for this chart.
We now have SERIOUS double tops at R15.30 / R15.34 on the weekly close and have had a pullback of more than R0.65 intra week.
The R14.48 level, along with all the EMA’s, will provide this chart with some outstanding support, and many will look at this and see a potential inverted H&S, but when you scroll down to the shorter time frames, one will see that this has thrown the cat amongst the pigeons and the next few months will be tough going.
In closing, now is the time for “gorilla warfare” trading, and I would not hold onto a position for more than R0.30 as the ranges will be huge, and the trend for the next few weeks is not your mate!
The ZAR seems to be following the alternative “last leg up” Euro / Dollar scenario mentioned over the last few weeks.
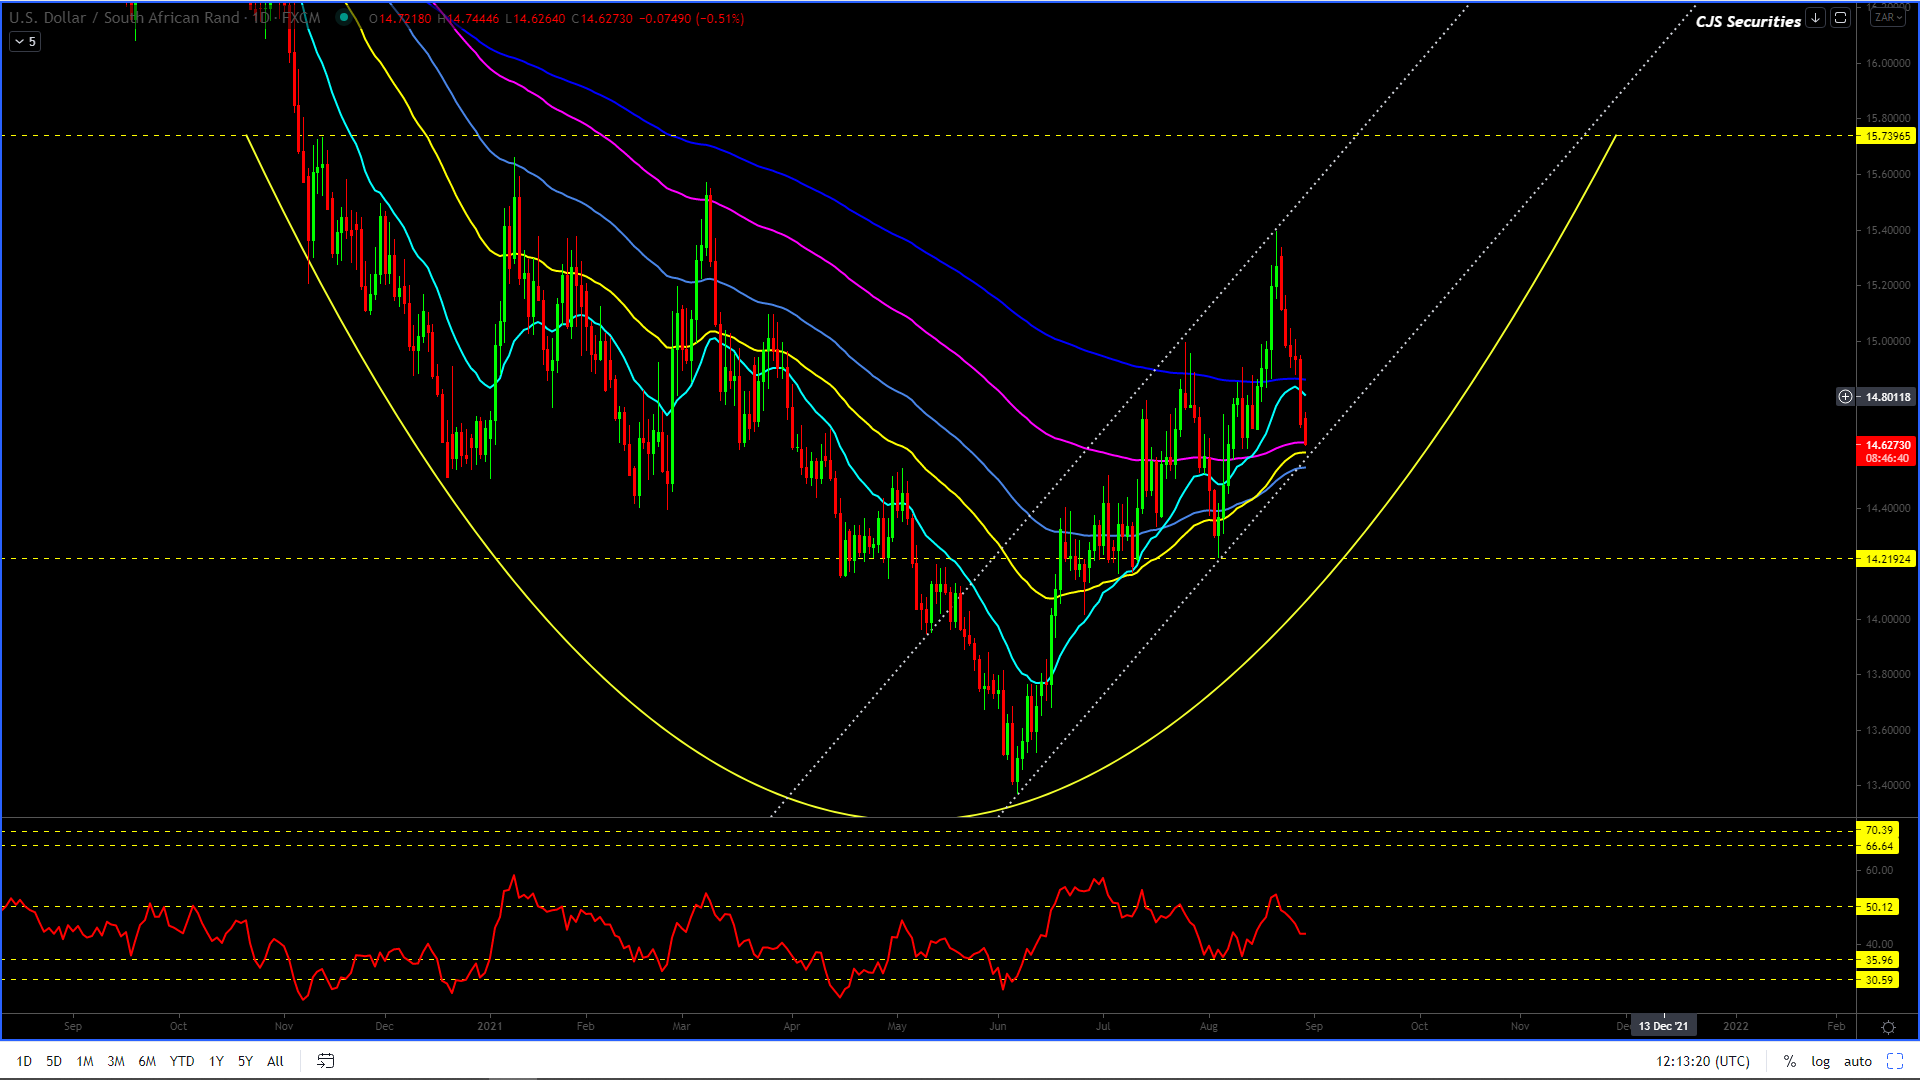
Dollar/Rand Daily Candle
Carrying on the theme from the Weekly time frame, the Daily chart will be well supported in the R14.50’s for the time being.
The rate at which this chart fell off a cliff would make any base jumper envious, and it’s with this in mind, the move up from the yearly low at R13.3560 is starting to look like a greater correction that has the potential to trade lower.
Nothing, however, has been confirmed yet, and based on this, I am now very hesitant to take any chunky positions in any direction as there are now many different scenarios.
Scenario #1.
The original “this chart will blowout” view is still on the cards as long as R14.50 holds.
Targets will be well over R17.00.
Scenario #2.
The current formation is an irregular flat bear correction that trades back to the R14.20’s, then trades up hard and fast to print between R15.70 – R15.86 to complete the correction while getting everyone and their dog long USD, only to collapse and come down to test the yearly lows and possibly print as low as R11.50.
Both scenarios will have one wondering because after the ferocity of last week’s fall, there is very little confidence in this chart.
Only a daily close over R15.62 would negate scenario #2.
As with the weekly chart, I would not hold any position now for more than R0.30.
Please don’t wipe yourself out as there will still be plenty of opportunities to come before year-end.
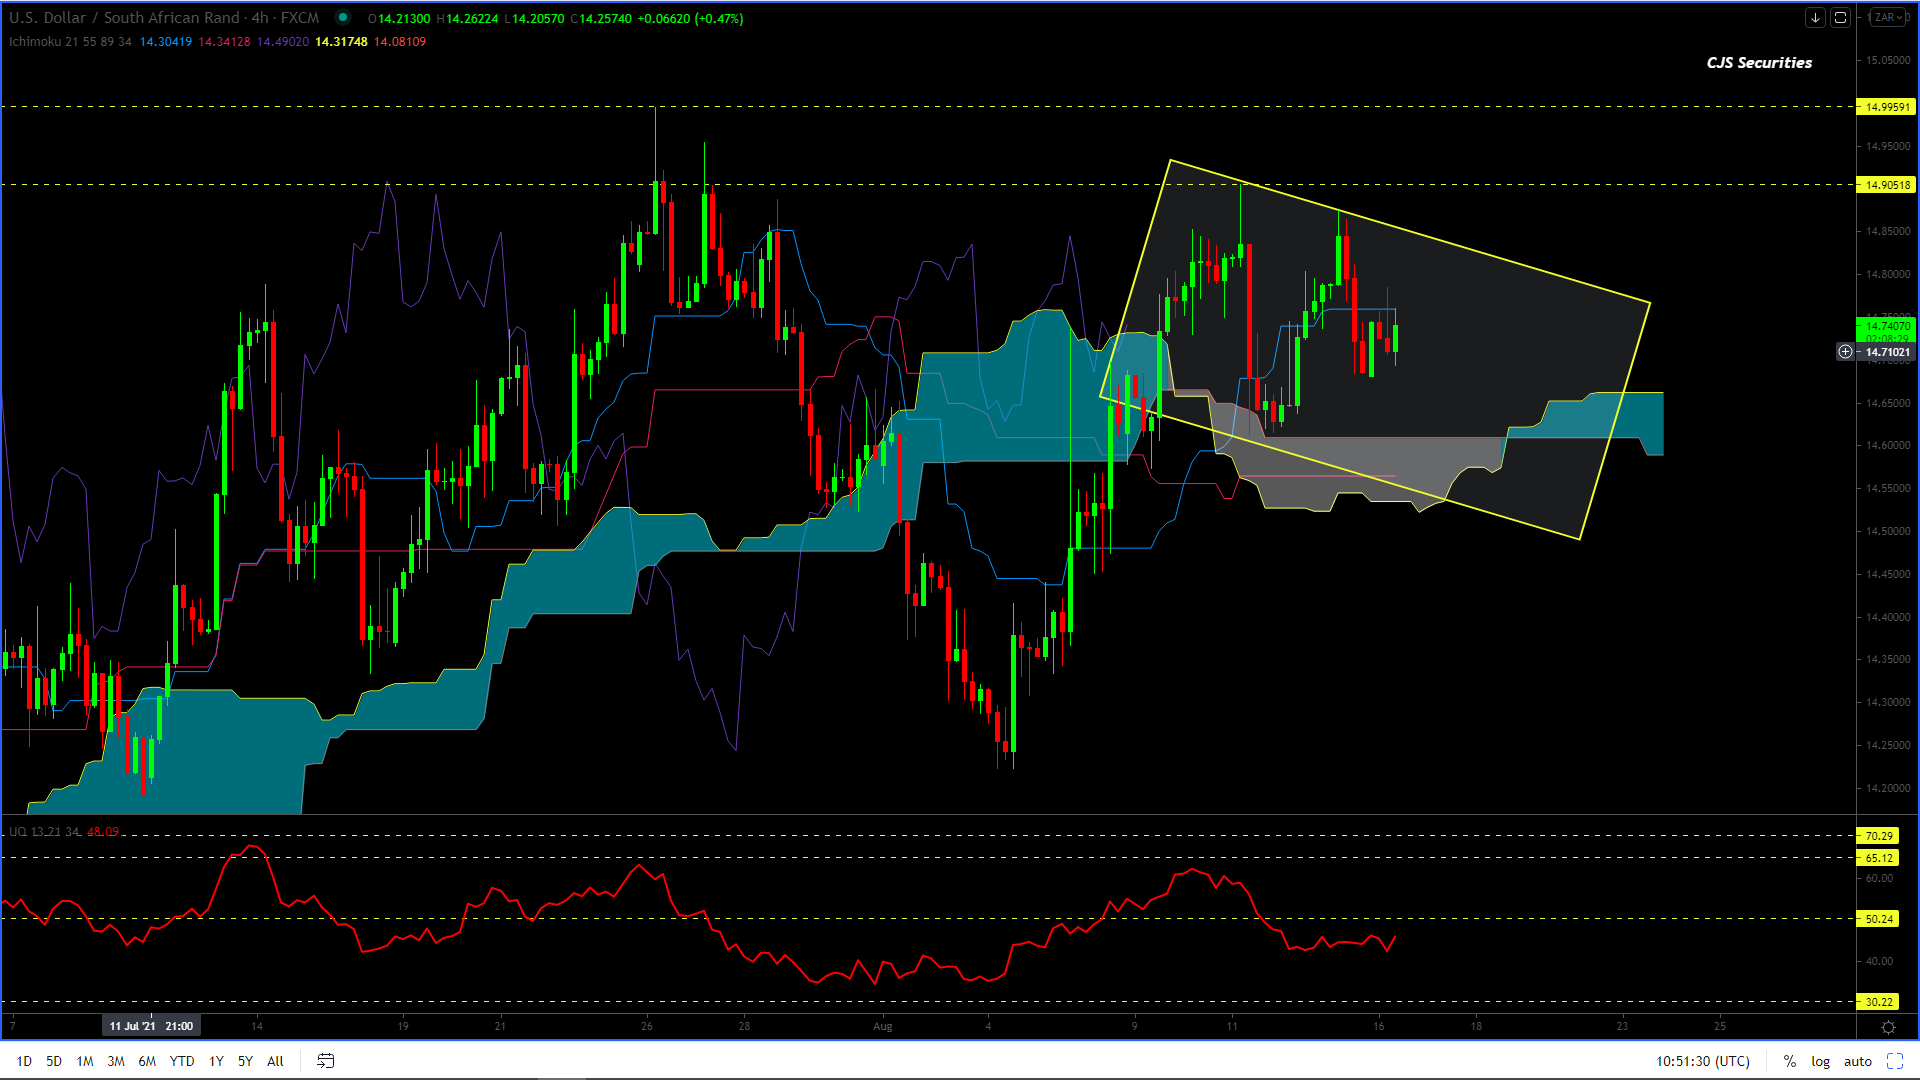
Dollar/Rand 240 min Candle
The way the chart has traded through the cloud looks a little like Thor’s lightning bolt!
Right now there is some support between R14.60 & R14.51 with little chance of a kick at this stage, but lucky we know there will be a pullback, it’s just from where?
I can see no trade here worth taking and would strongly advise staying out until further notice.
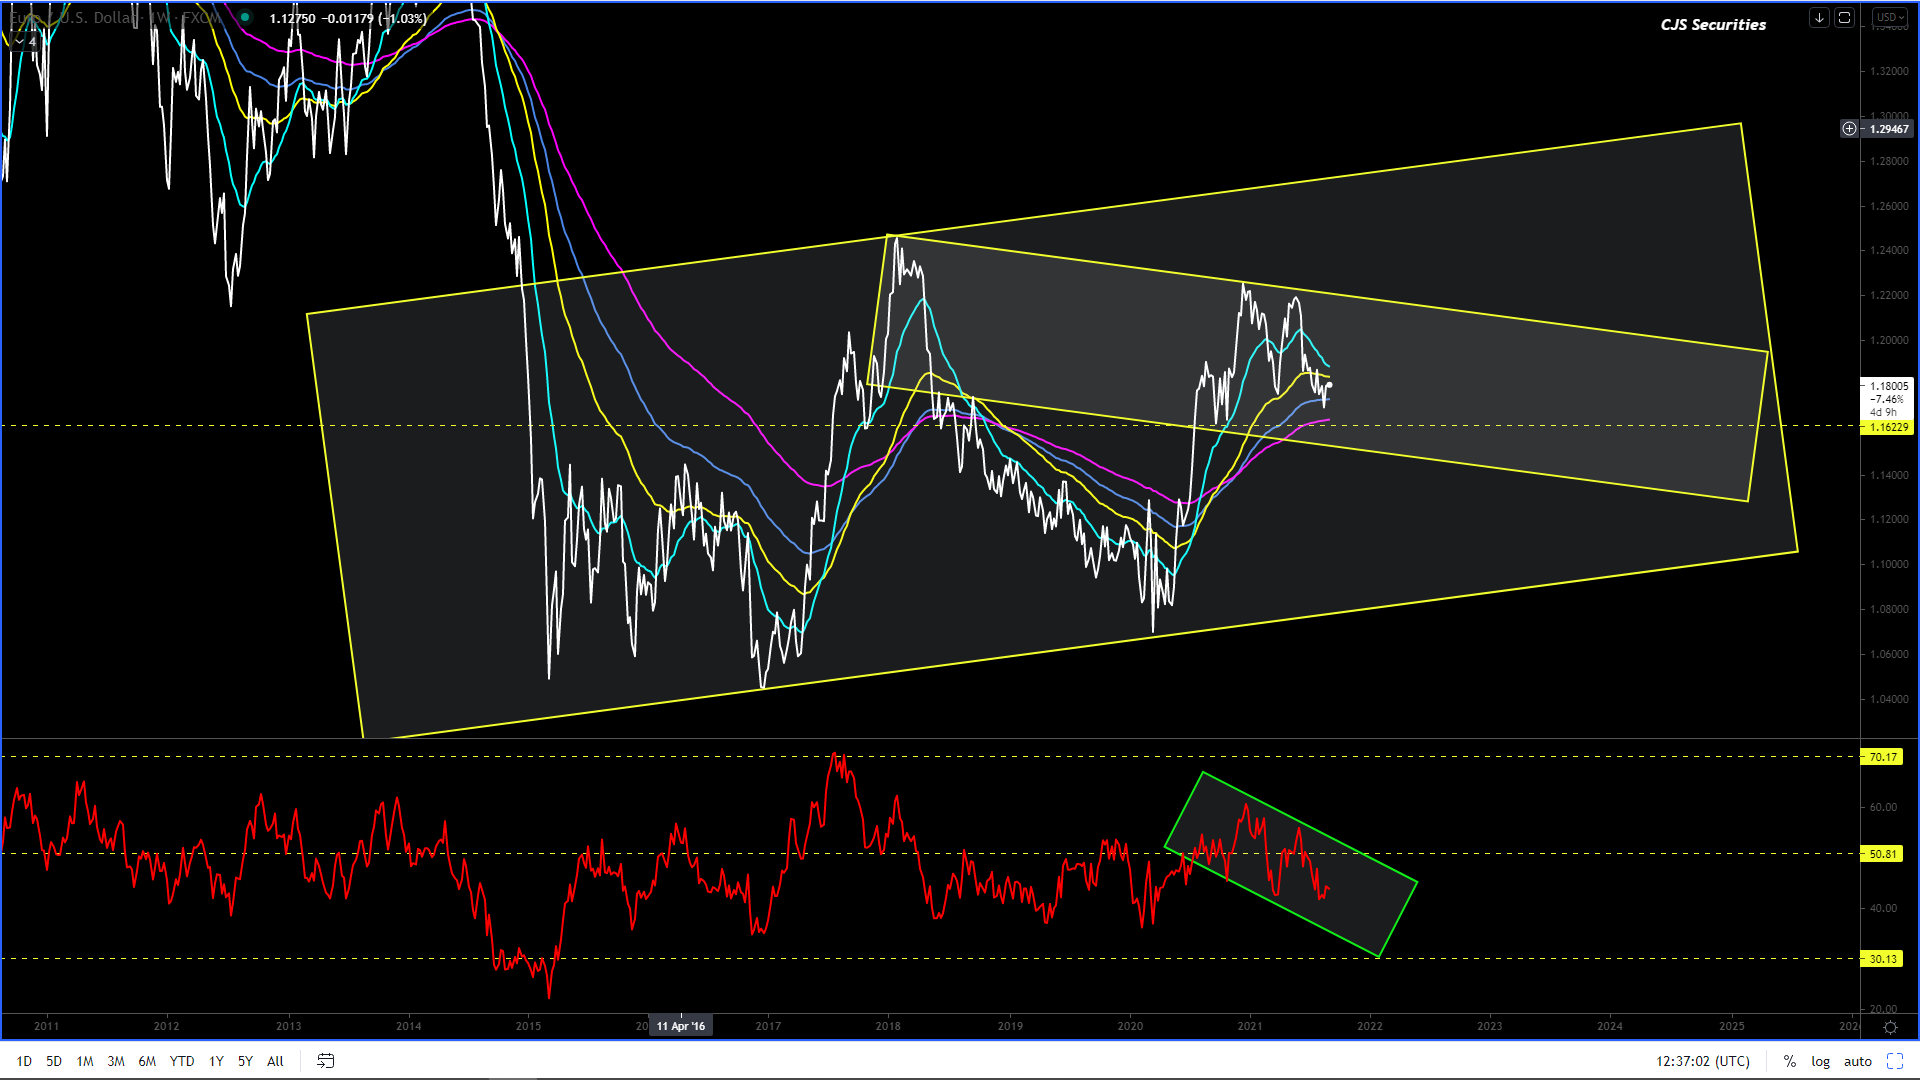
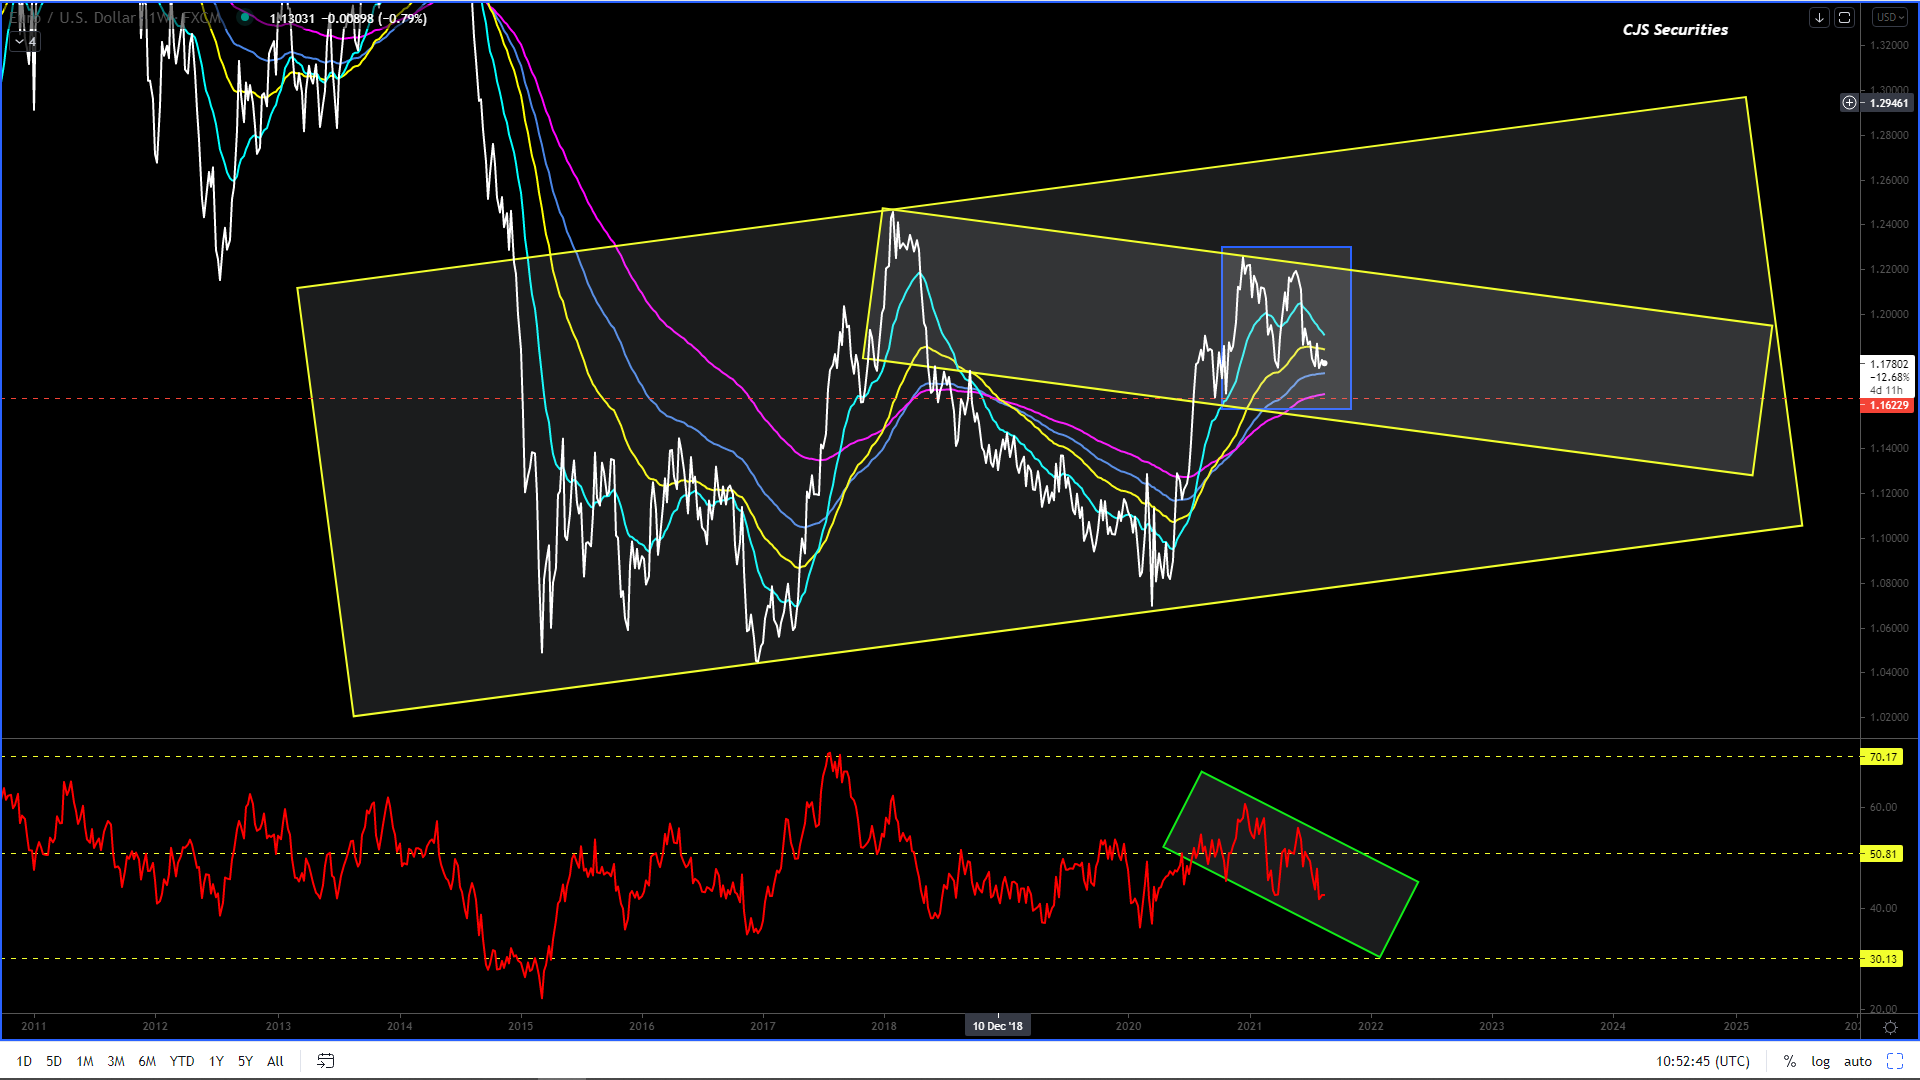
Euro/USD Weekly Close
Not only has the $1.16 level held like the Rock of Gibraltar, it now seems almost a “fait accompli” that the correction will see its last leg up north of $1.24 in the coming months.
Once the above move is over, the USD will strengthen significantly, but first, there is much cash to be made playing the Euro from the long side.
The general view is now long the EURO until we have a daily close under $1.16!
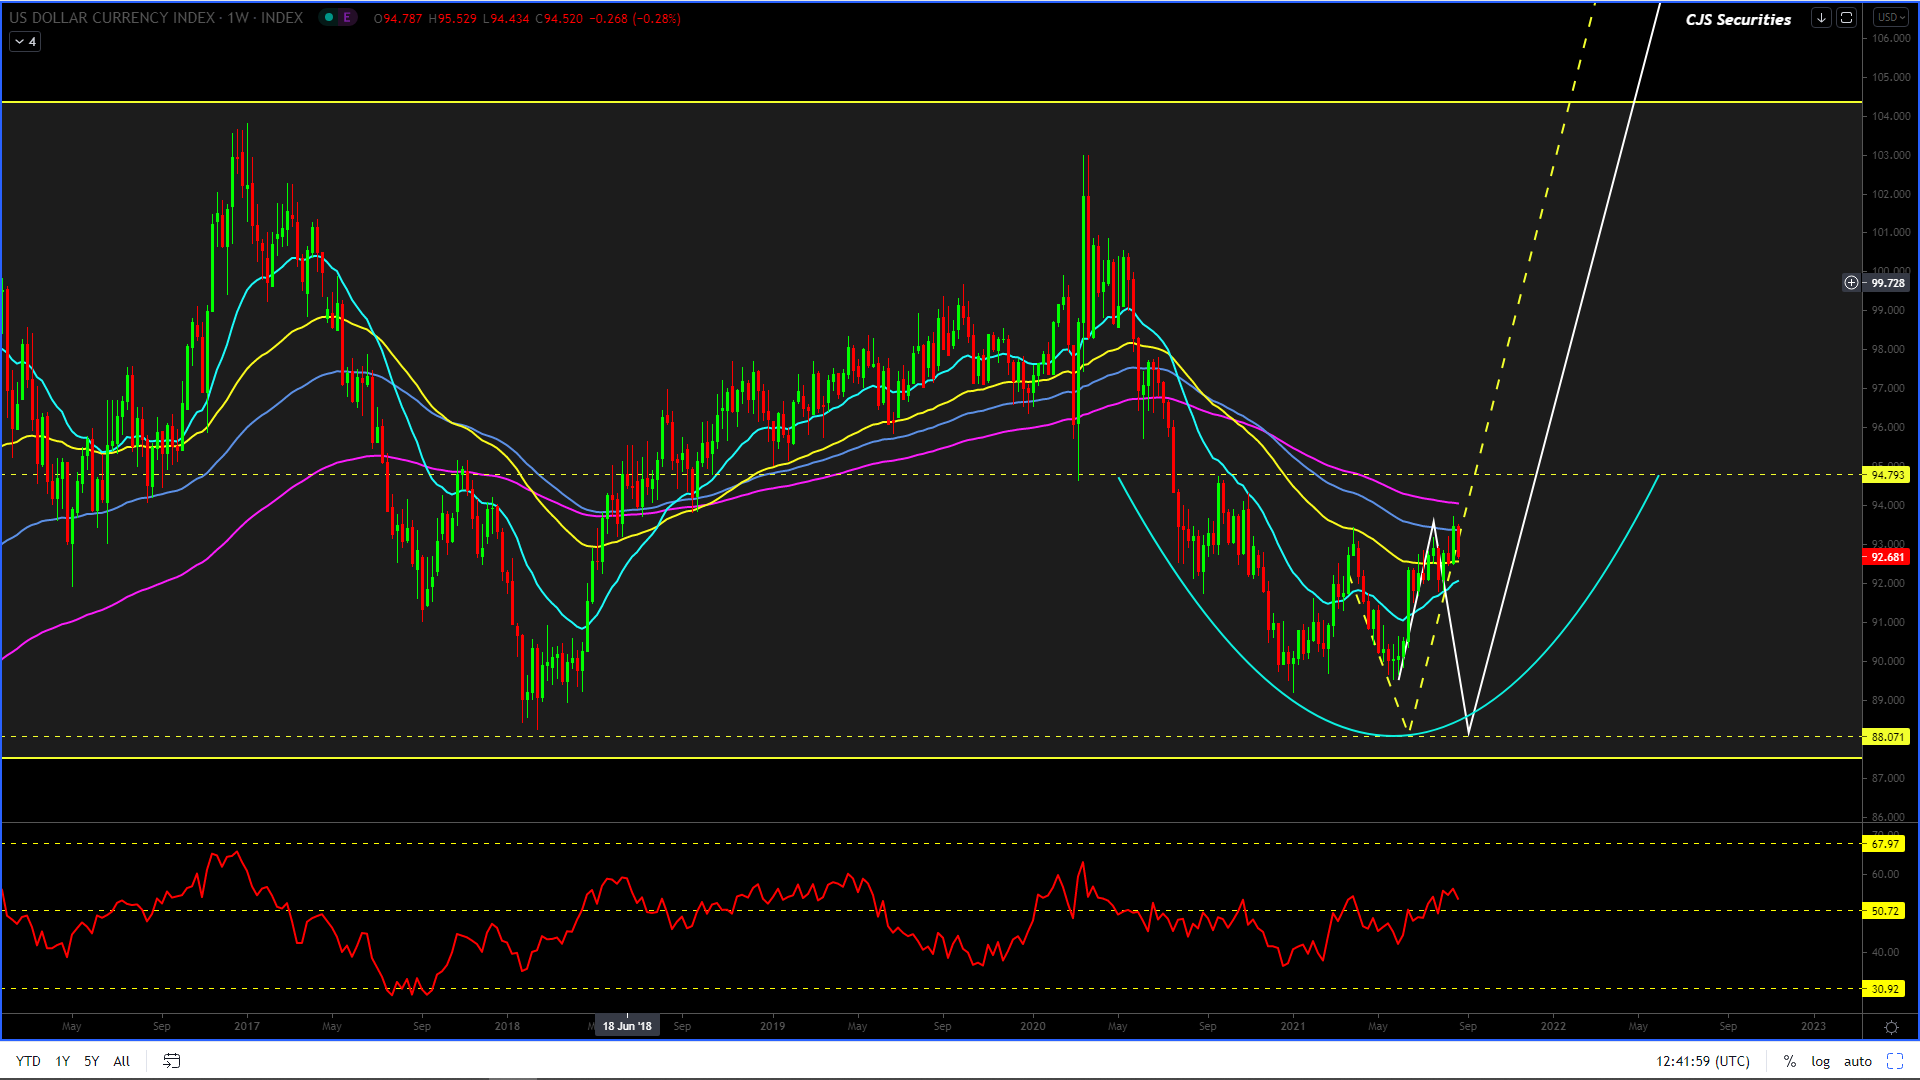
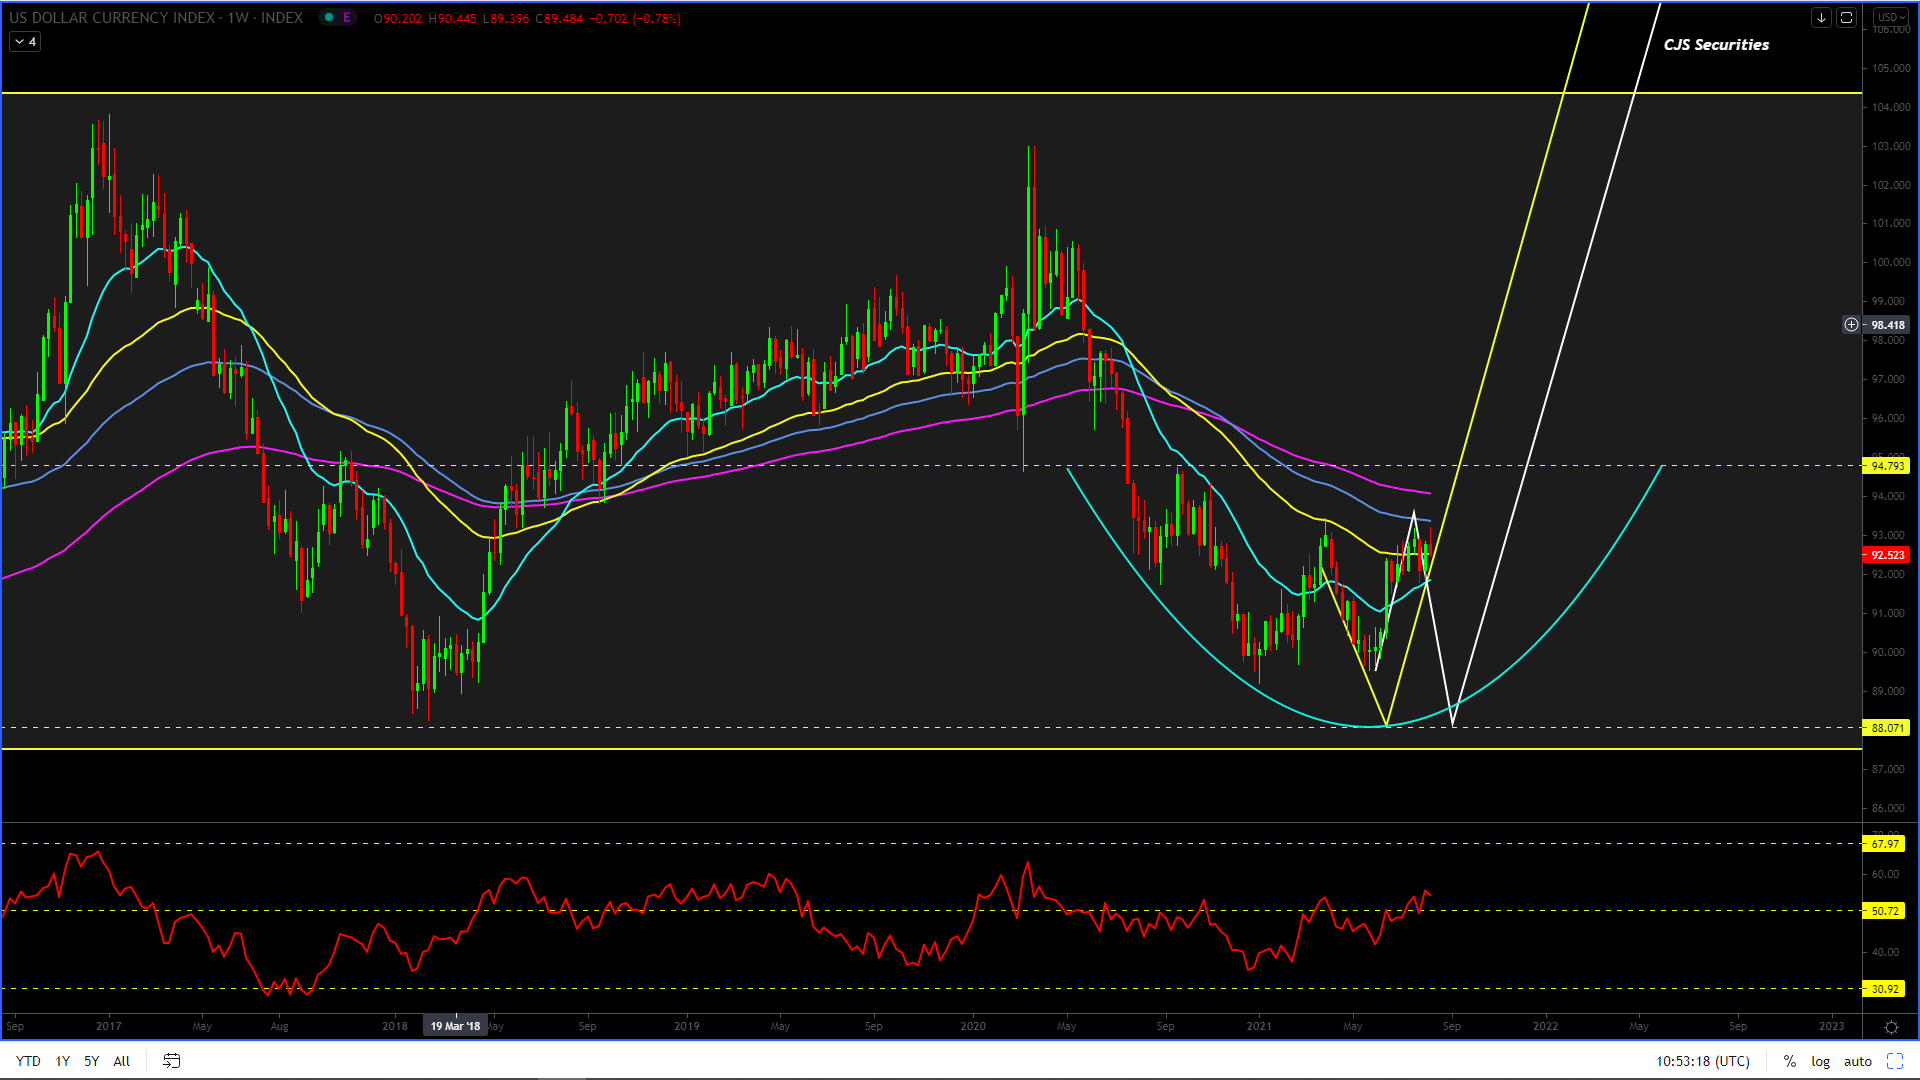
US Dollar Index Weekly Candle
The DXY now appears to be headed lower before it goes higher in line with the white line road map and off the back of the Euro.
However a print over 97.00 would still see the lows in place and a move well over 107.00!
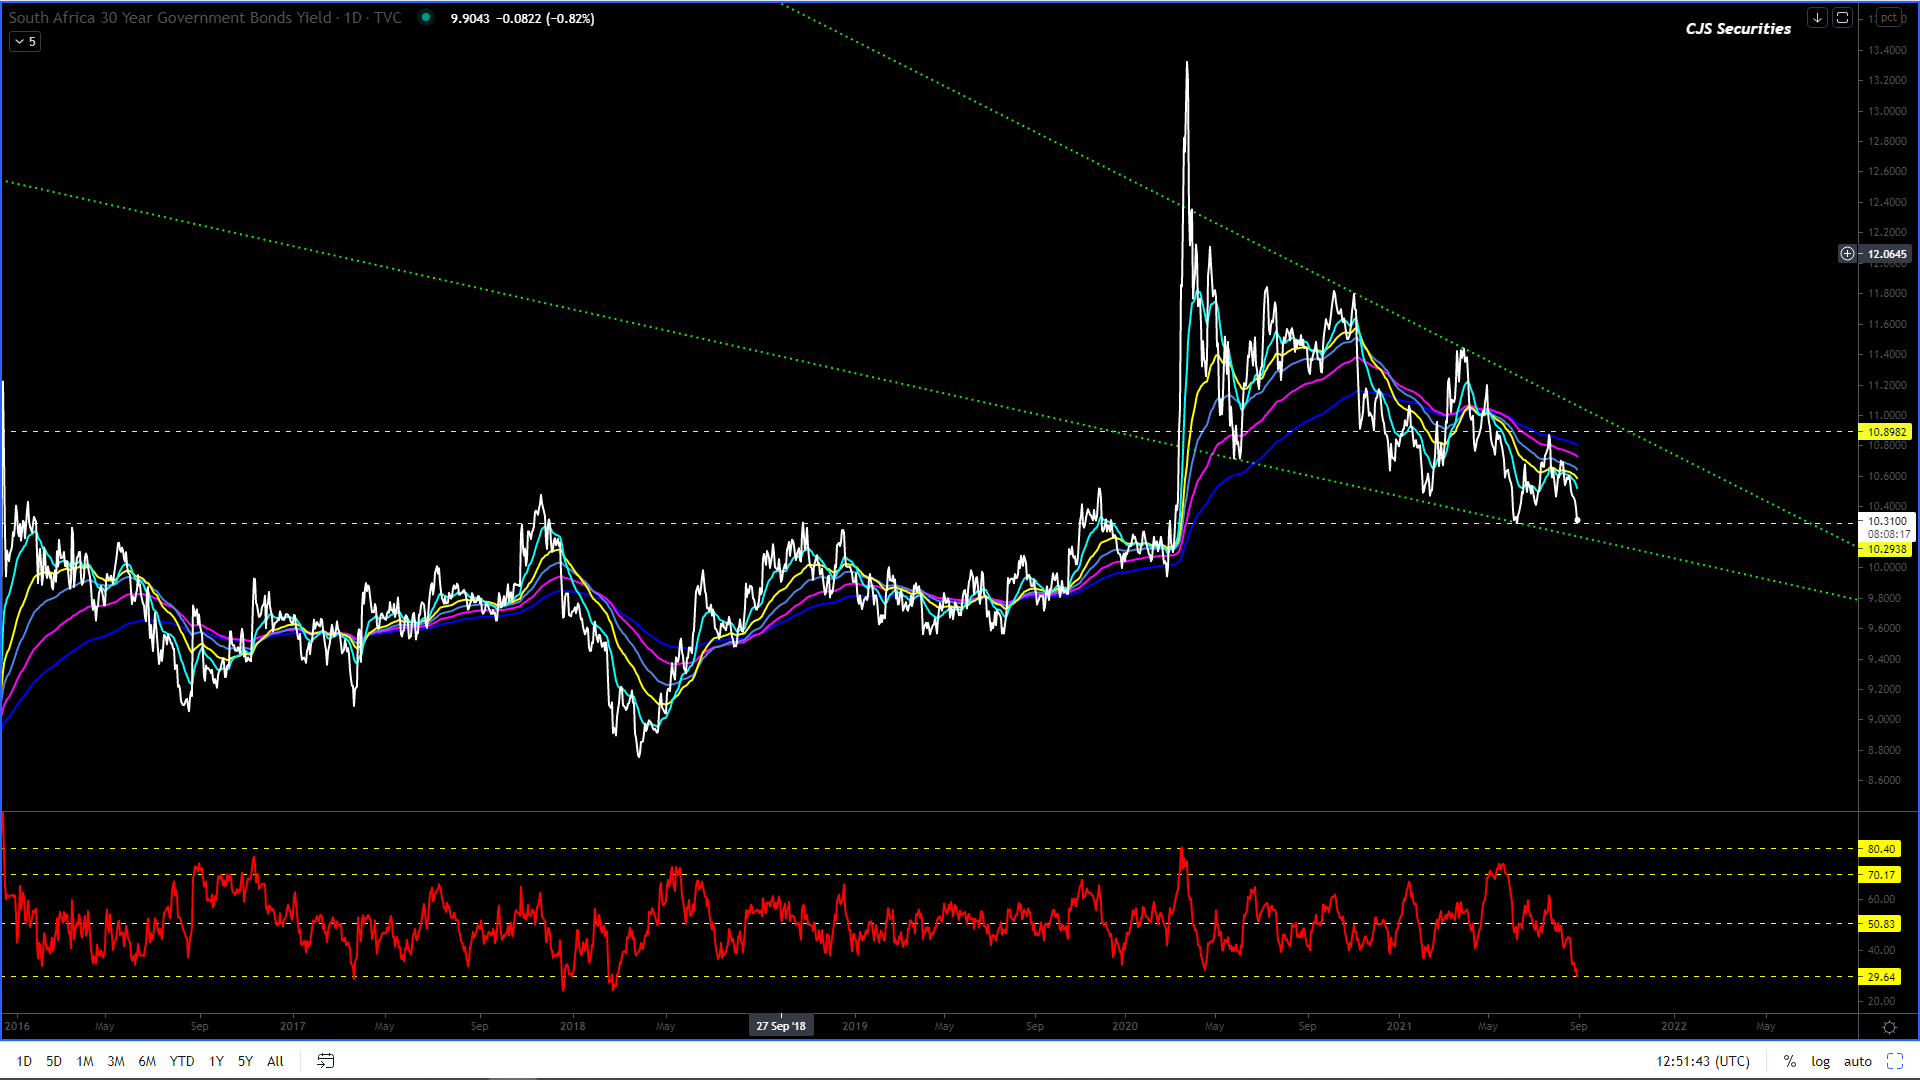
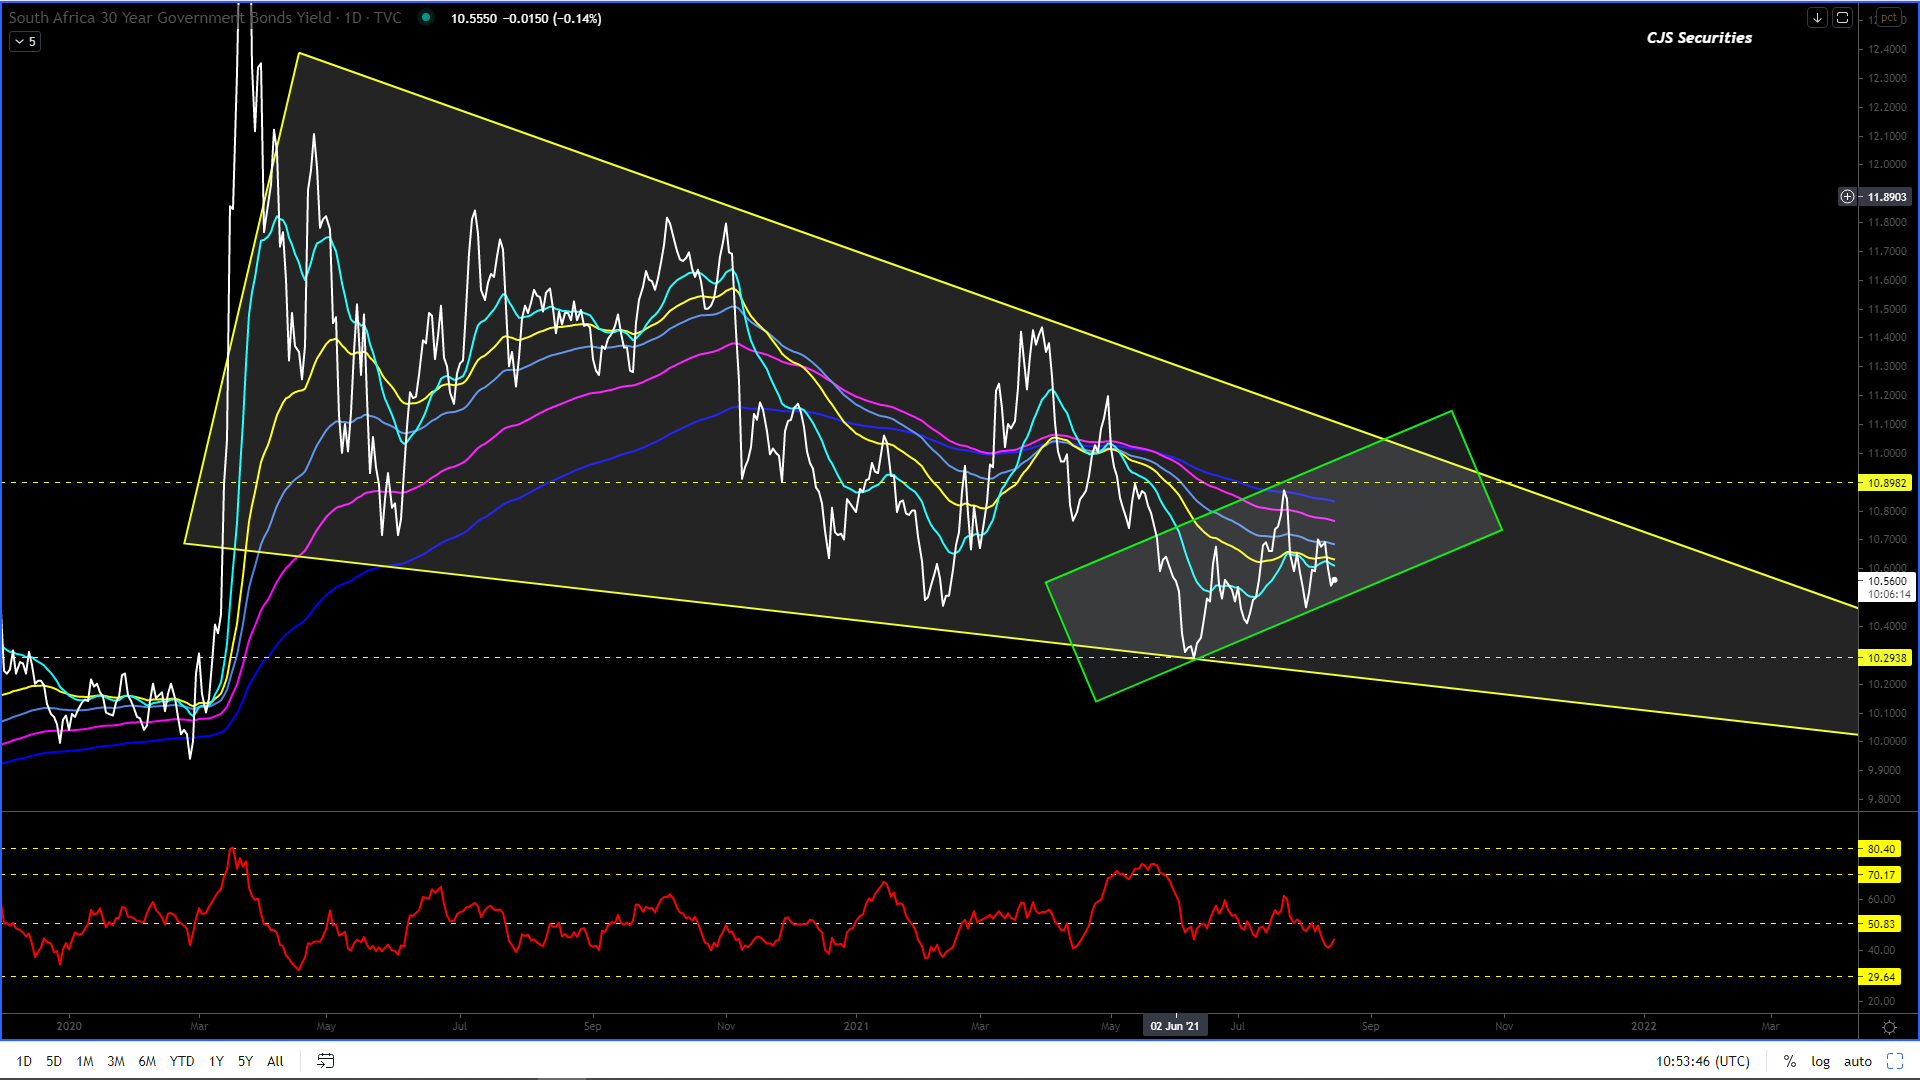
SA Government Bond 30 Year Yield Daily Close
If this 10.30% level does not hold, then all I know is that there will still be a decent amount of downside in this chart over the next 12 months.
The ending diagonal formation is off the table, and right now, I must confess that 9.22% looks very much on the charts.
Having said all of the above, don’t panic!
The chart is now oversold but can continue lower before kicking, but overall, I would expect a kickback to 10.90% before printing the 9.22%, so you should have time, at least I hope so! – ‘I truly hope this ages well.’
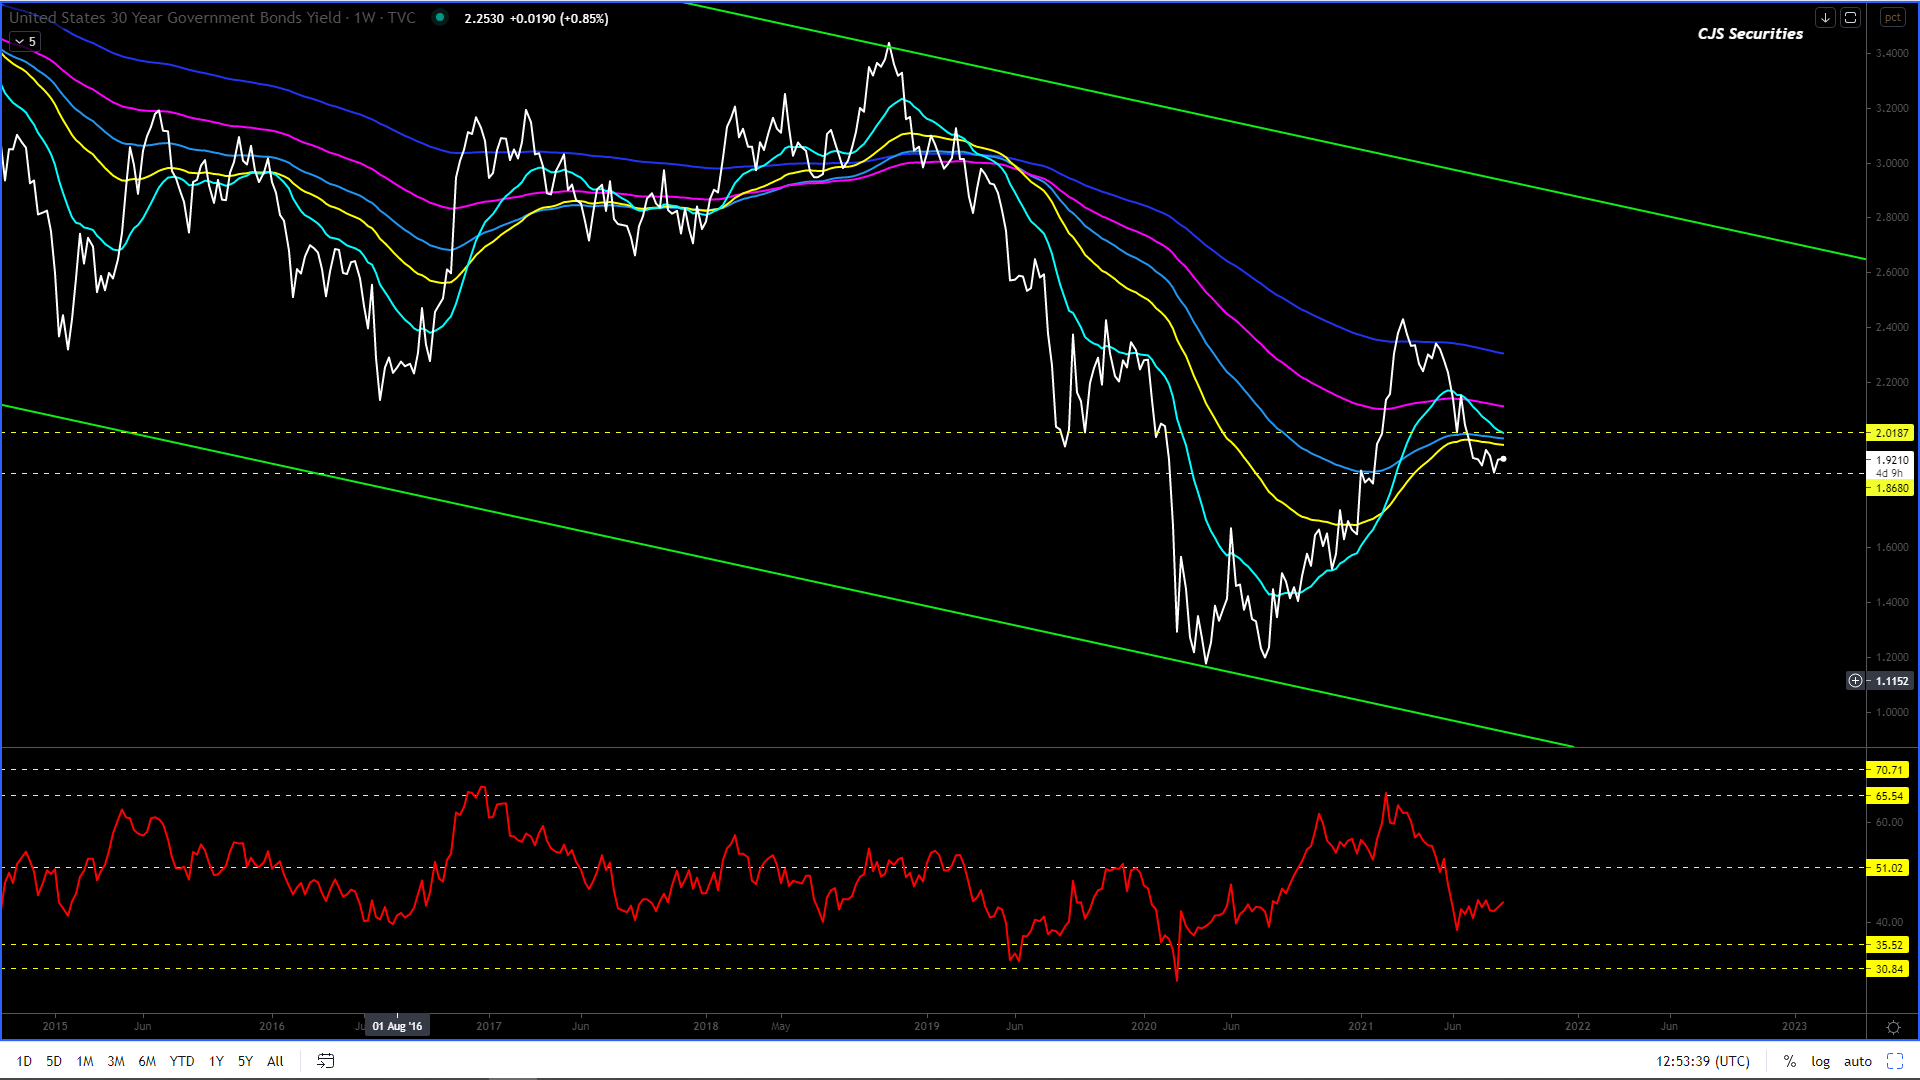
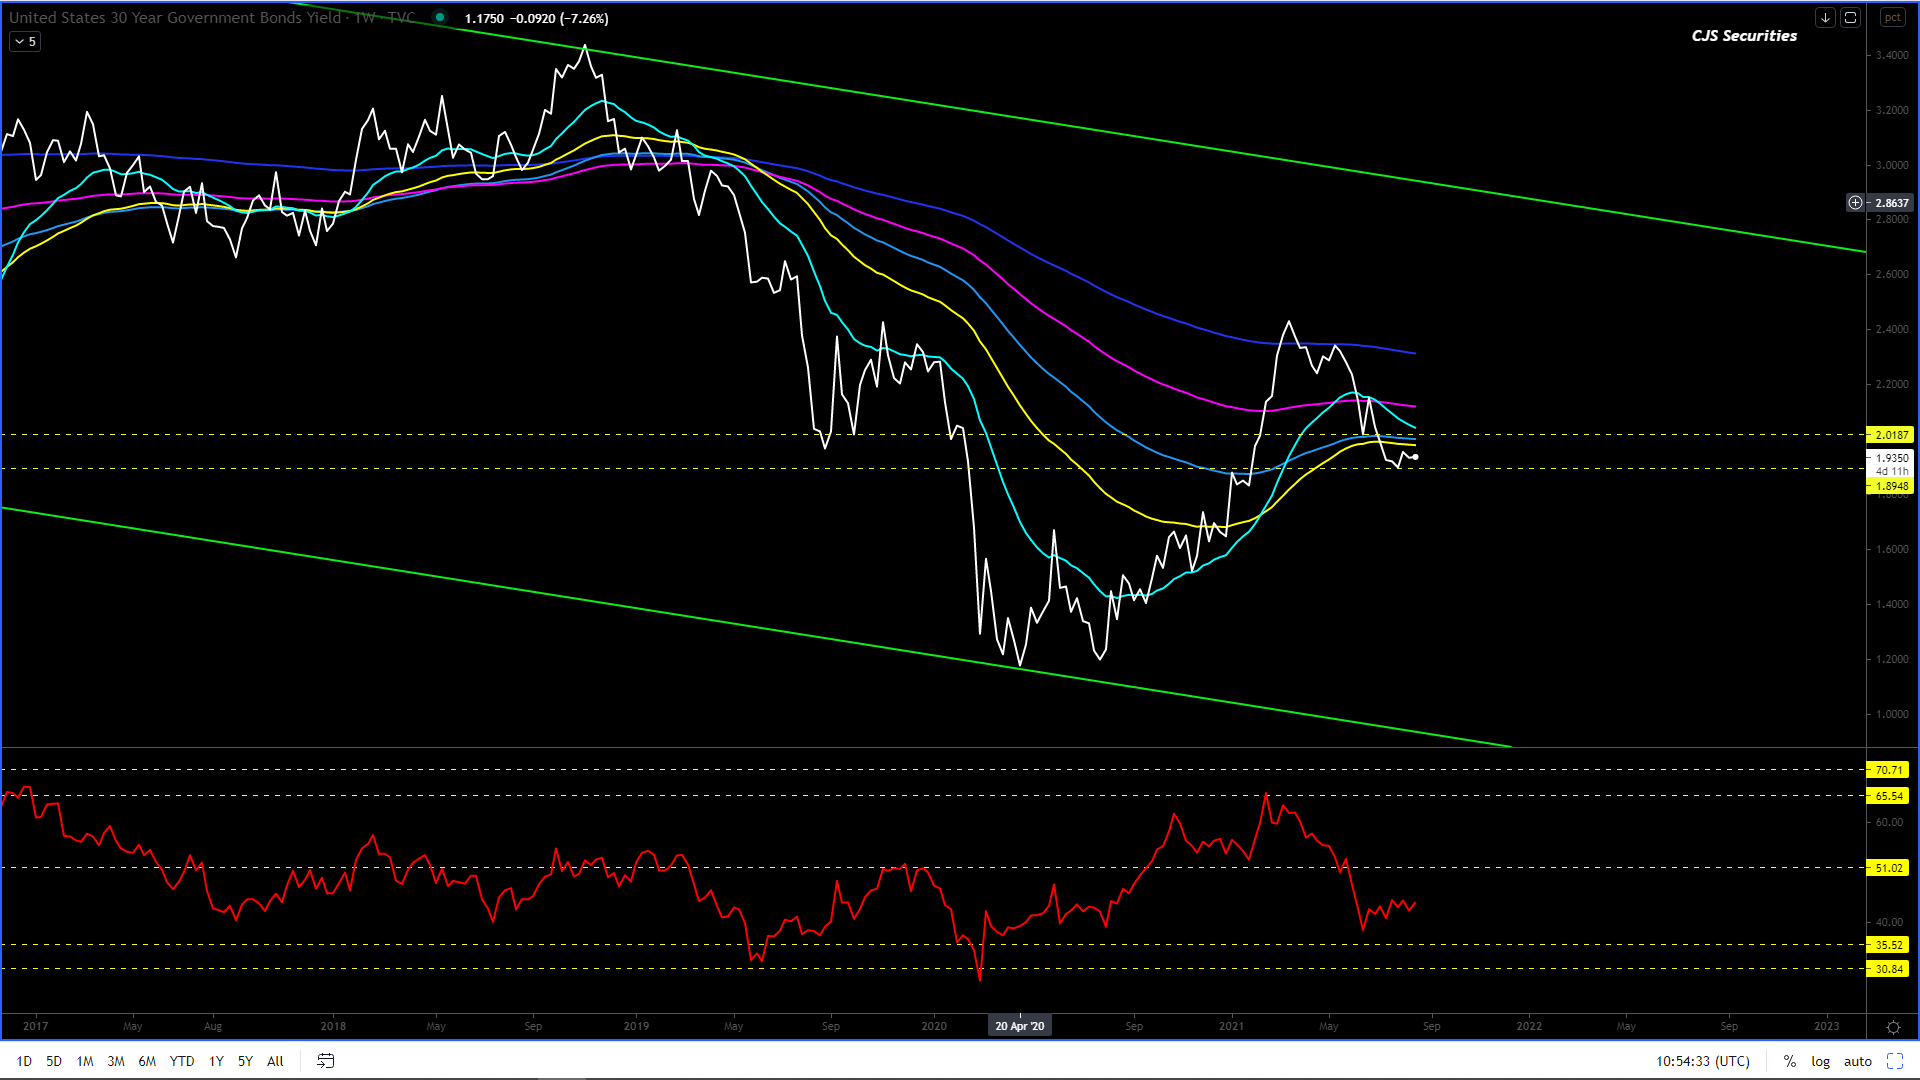
US Government Bond 30 Year Yield Weekly Close
I would look at buying a move back to 1.90% – 1.80%that will have upside targets from 2.58% – 2.71%.
Use an SL under 1.70%.
Please note that only a weekly close of over 3.50% will confirm that the trend has been broken.
This report is an ad hoc report as I am seriously concerned about the Dollar / Rand.
Below are Weekly – 240 min time frames to illustrate my concerns.
The good news for you is that when I am concern about a market, it usually takes another 3 – 6 weeks to play out as I am known for being early!
Better early than late as my father would say, and if I were to timestamp a date, I would say that we should expect a big move before 8 November 2021.
The kind of move I forsee playing out will be expolsive, and has the potential to be another Sunday night “Nene Gate” and could print R18.33!
While I have no idea what would precipitate a move of this magnitude, the current price action and long term chart formations give impetus to my view.
The weekly charts look set to blow, keeping in mind they can still take a few weeks, while the daily’s and 240 min are anything other than bearish.
In closing this quick fire report is here to stress that you can only be LONG USD or SQUARE, short USD is not an option and although being long hurts as the carry is not your friend, right now it’s the most pertinent risk management position to have.
“Living with fear stops us taking risks, and if you don’t go out on the branch, you’re never going to get the best fruit.” – Sarah Parish
Another week and still not much to add to the commentary as this correction remains far from over and could take a good few weeks, if not months, to complete.
Use all the rallies to take profit but keep a core long as the major trend/cycle is up.
Let the market come to you, and don’t chase it, as dogs that chase cars end up being run over.
If you are lucky enough to see a move sub $12.40 (November 21), own it for the LT.
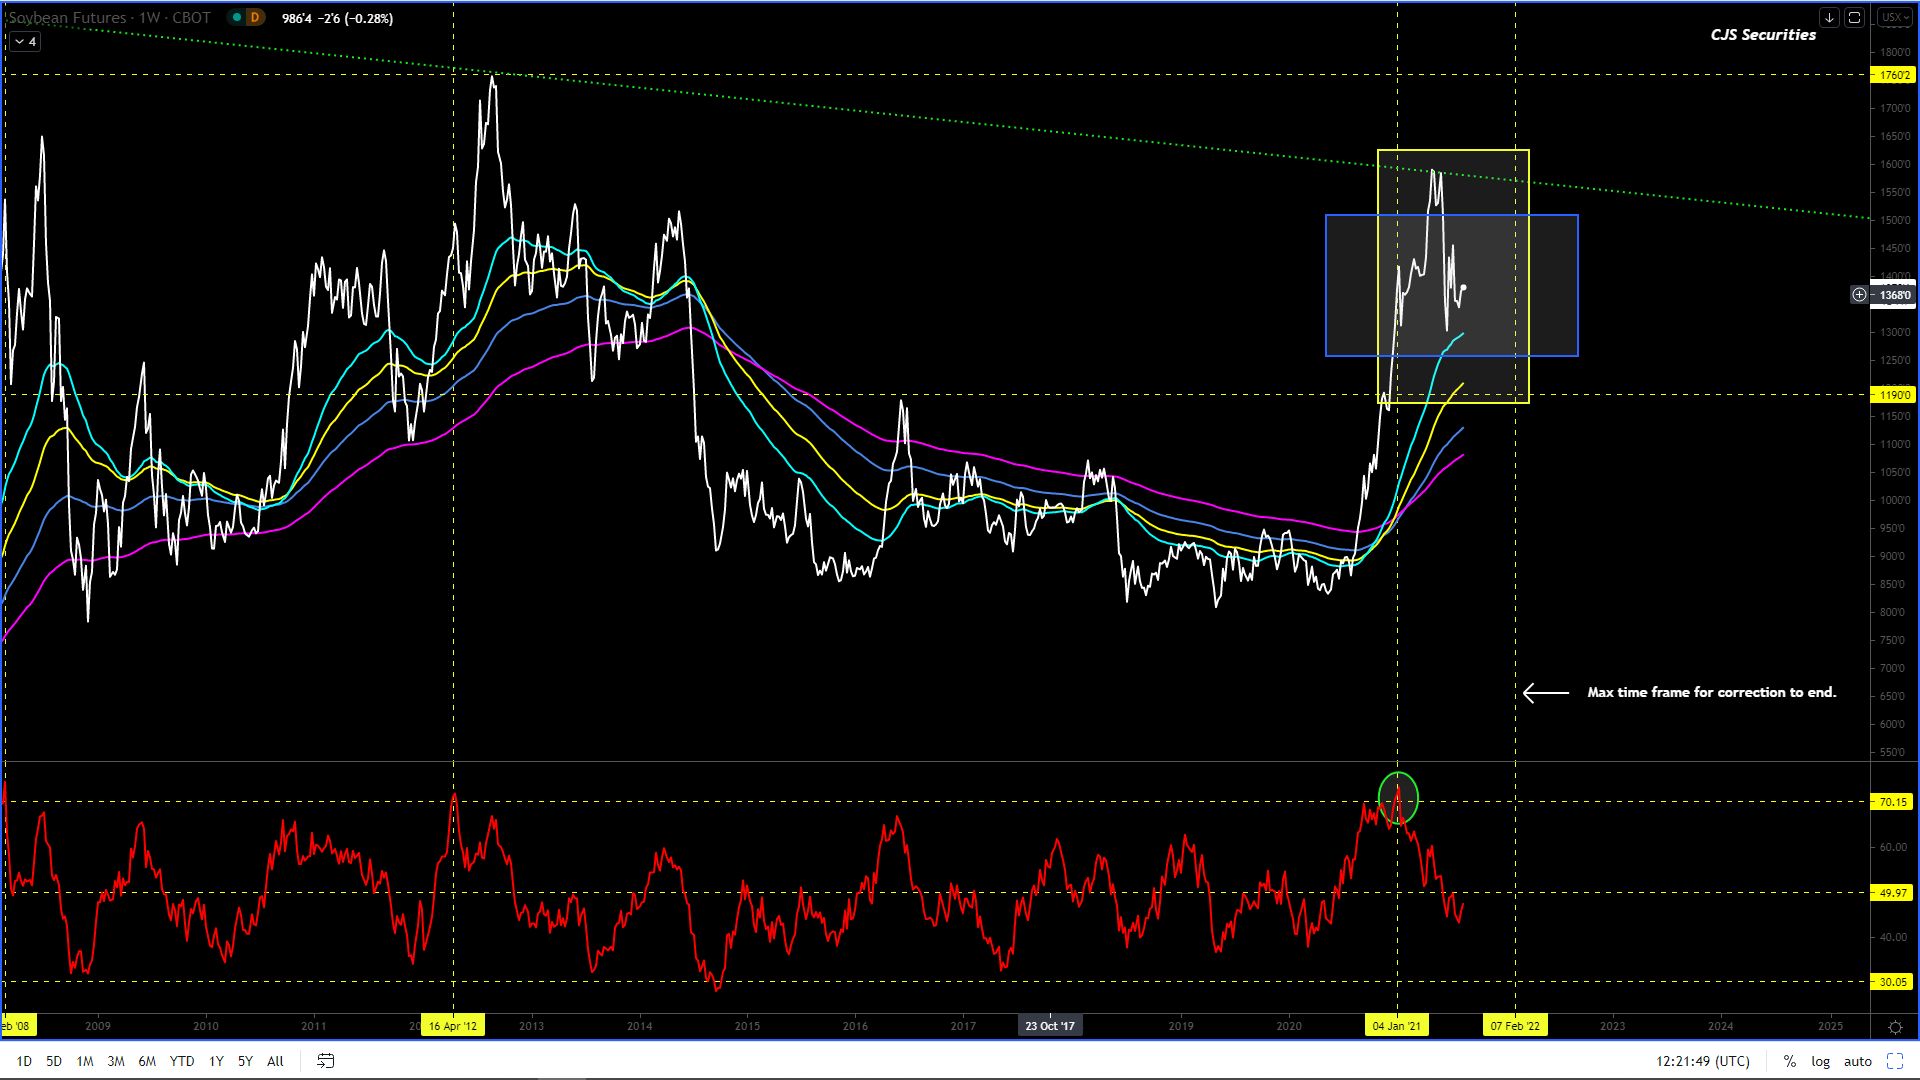
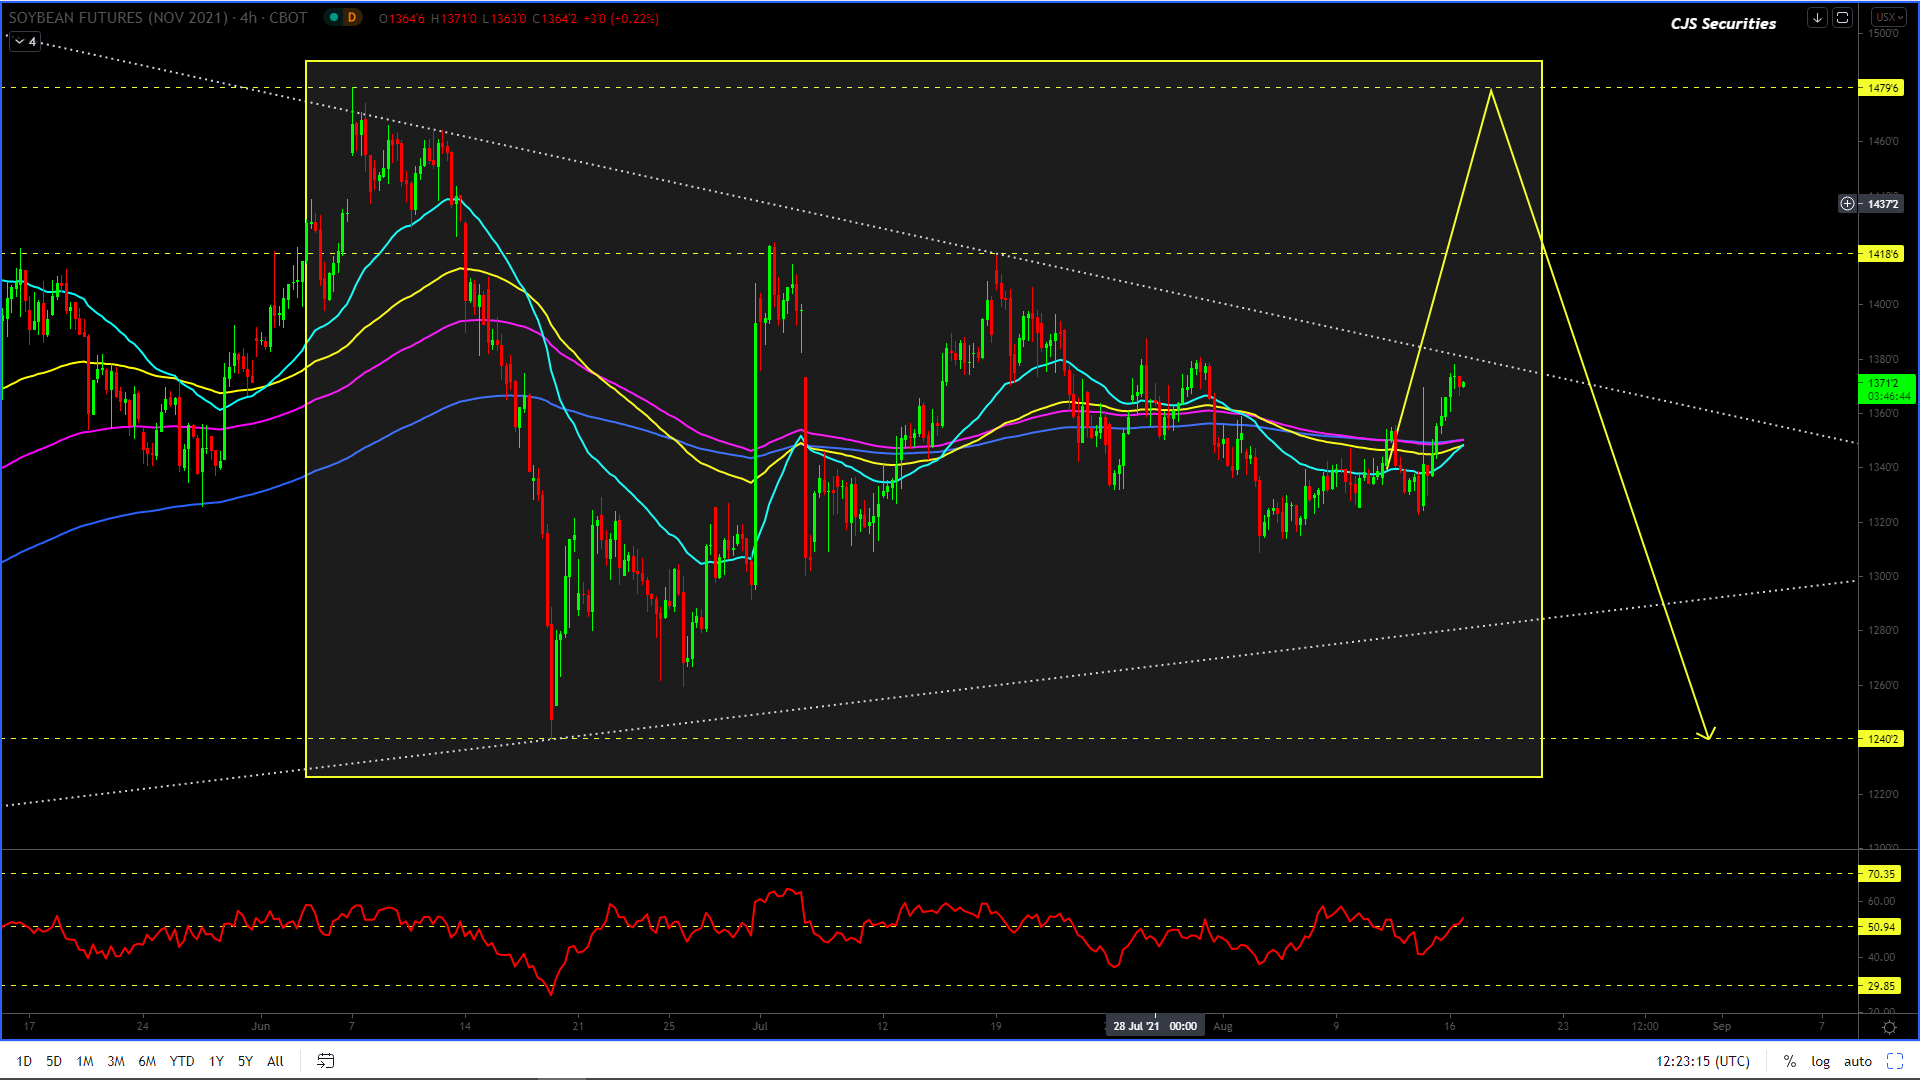
240 Min CBOT November 21 Soybean Candle Chart
This market is playing out more and more like a triangle keeping everyone bullish at the top and less bullish at the bottom, if not a triangle, a flat formation but currently I have my doubt that the price will reach the top of the road map before coming off.
I very much like the below RR trade very much.
Sell with a stop loss over $14.20 and targets at $12.61.
This trade gives you a RR of 5 /1 and in anyone’s book, a bet worth taking!
In the big picture, I want to own this chart for the LT from $12.40 -$11.60!
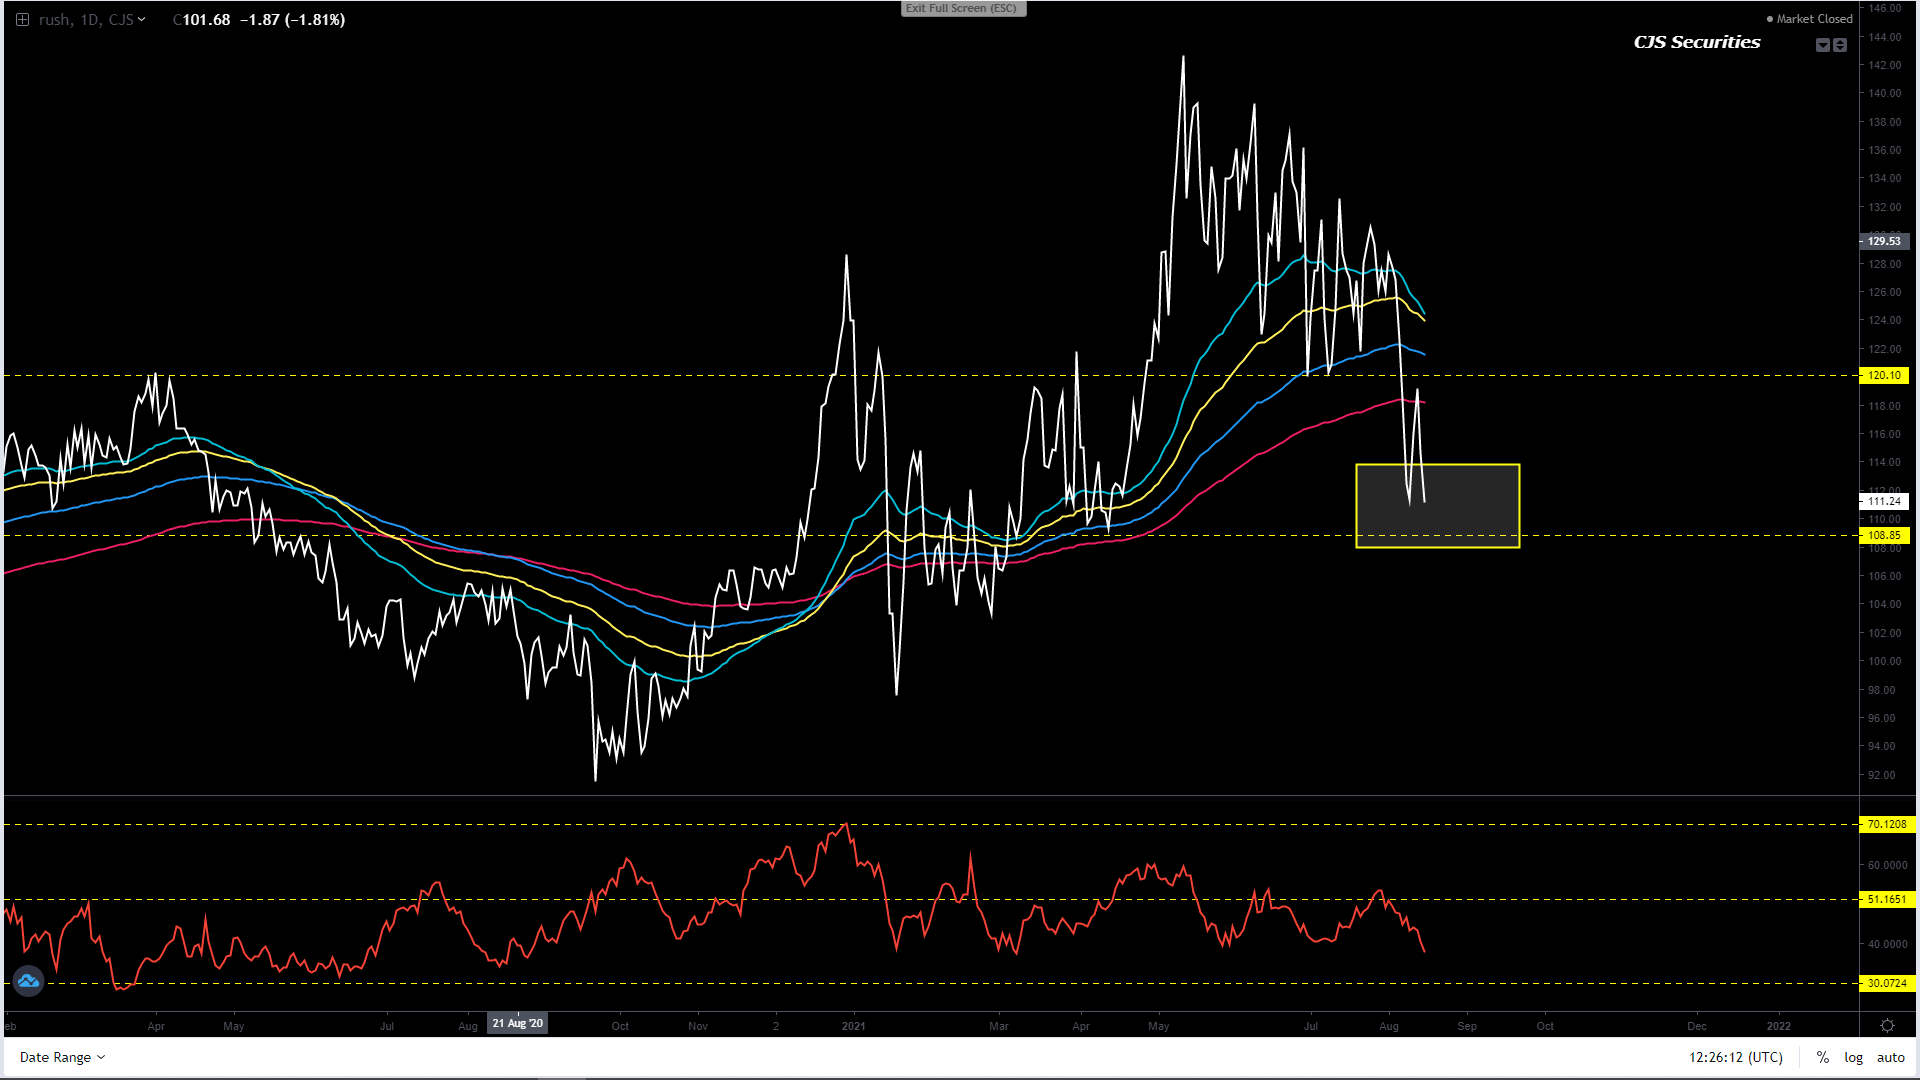
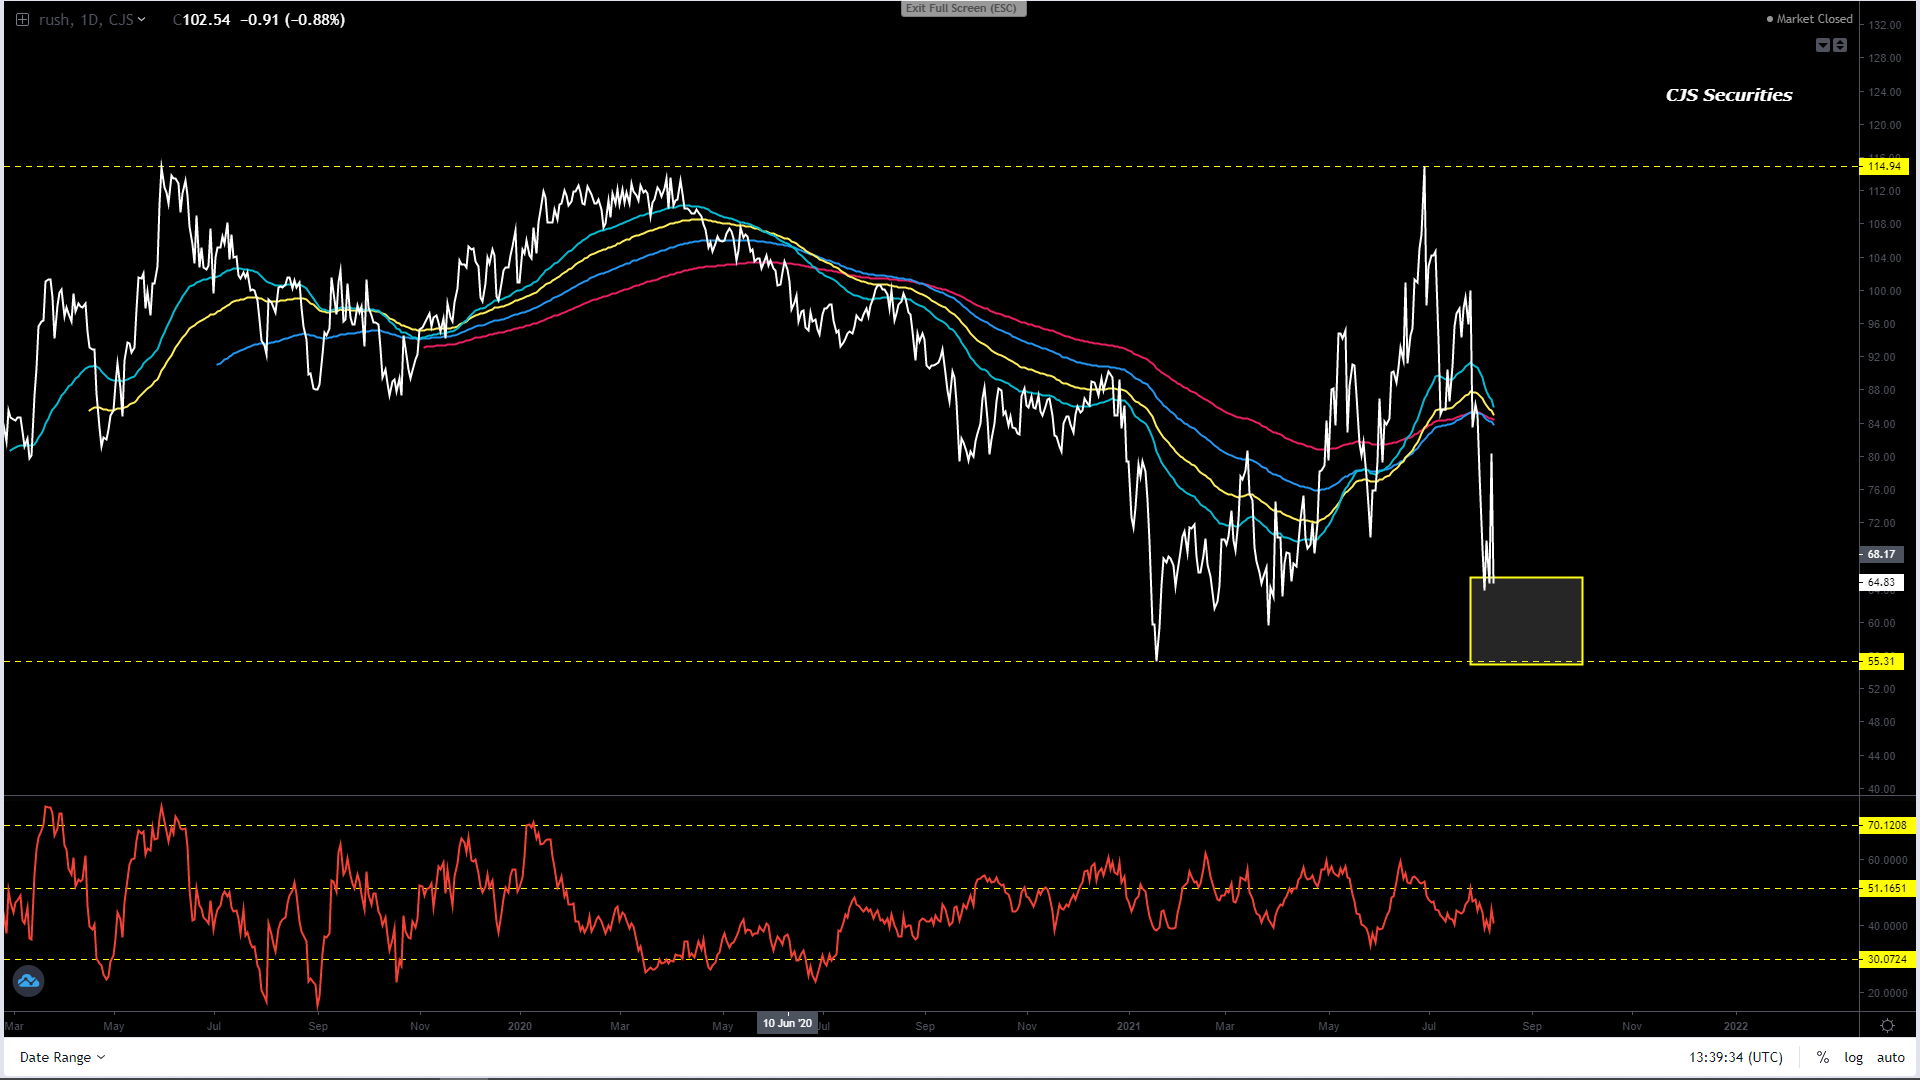
Board Crush Continuous Daily Close
#No Change in Commentary
All I can say is, at this stage, this chart can come off to the $0.5531 level.
I would only get long under $0.58 in any size.
If this view is correct, there should still be a move back to $1.10.
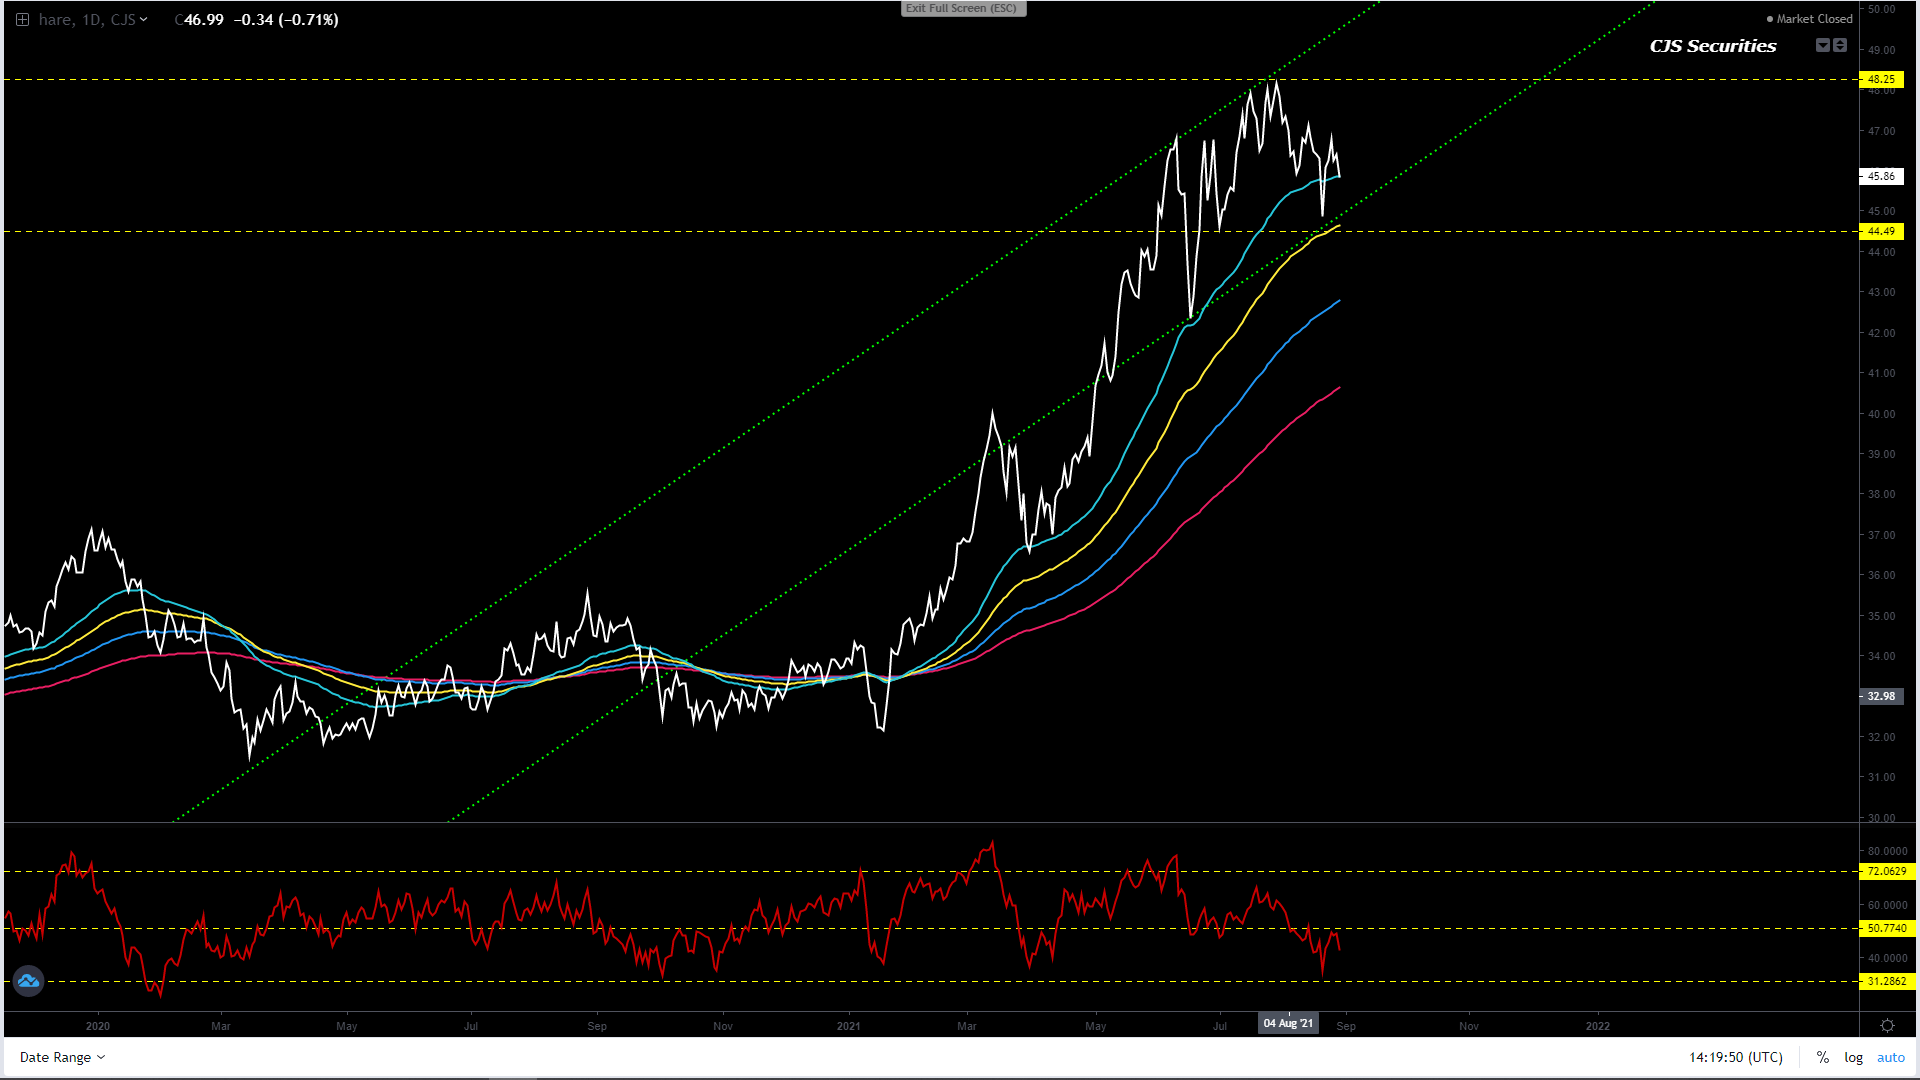
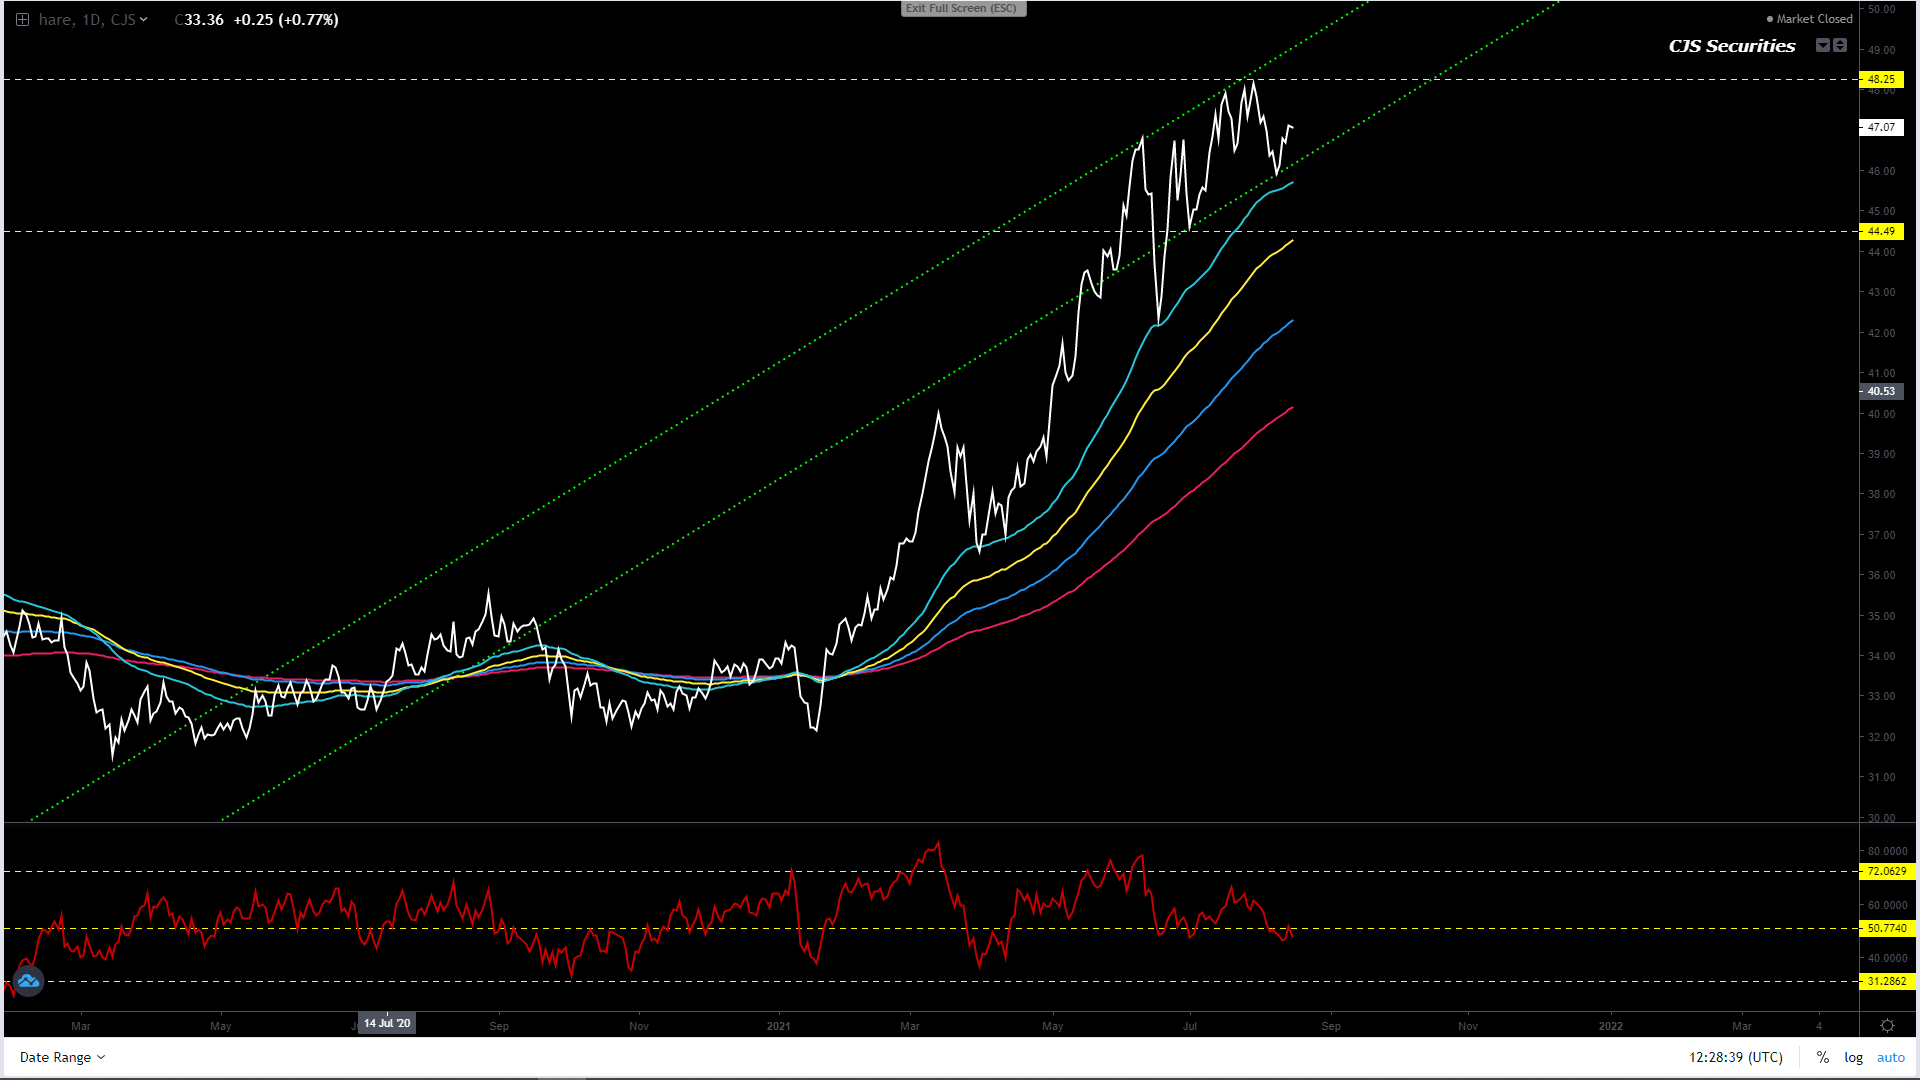
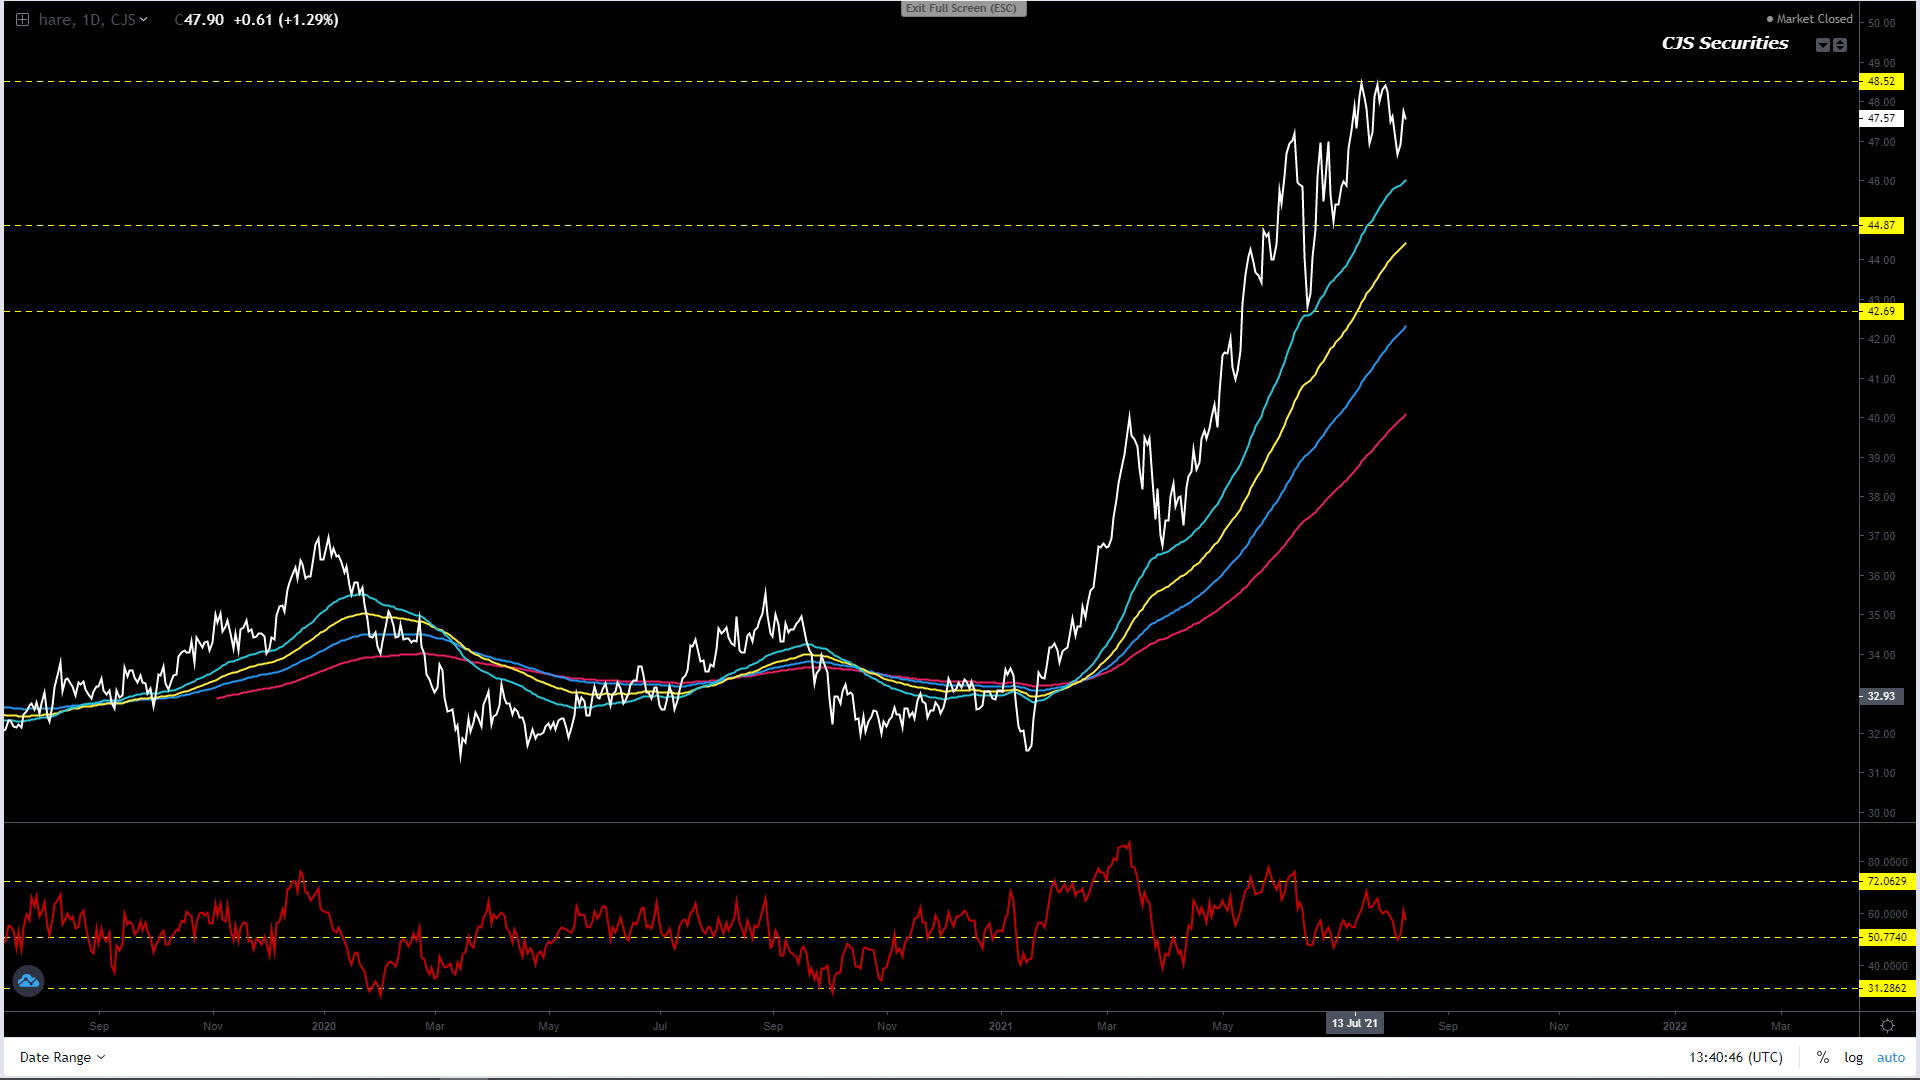
Oil Share Continuous Daily Close
I love this chart and it’s as bullish a lotto winner at a strip club, but in it’s current guise I would allow it to play out for another week or two, although we would look to buy a dip.
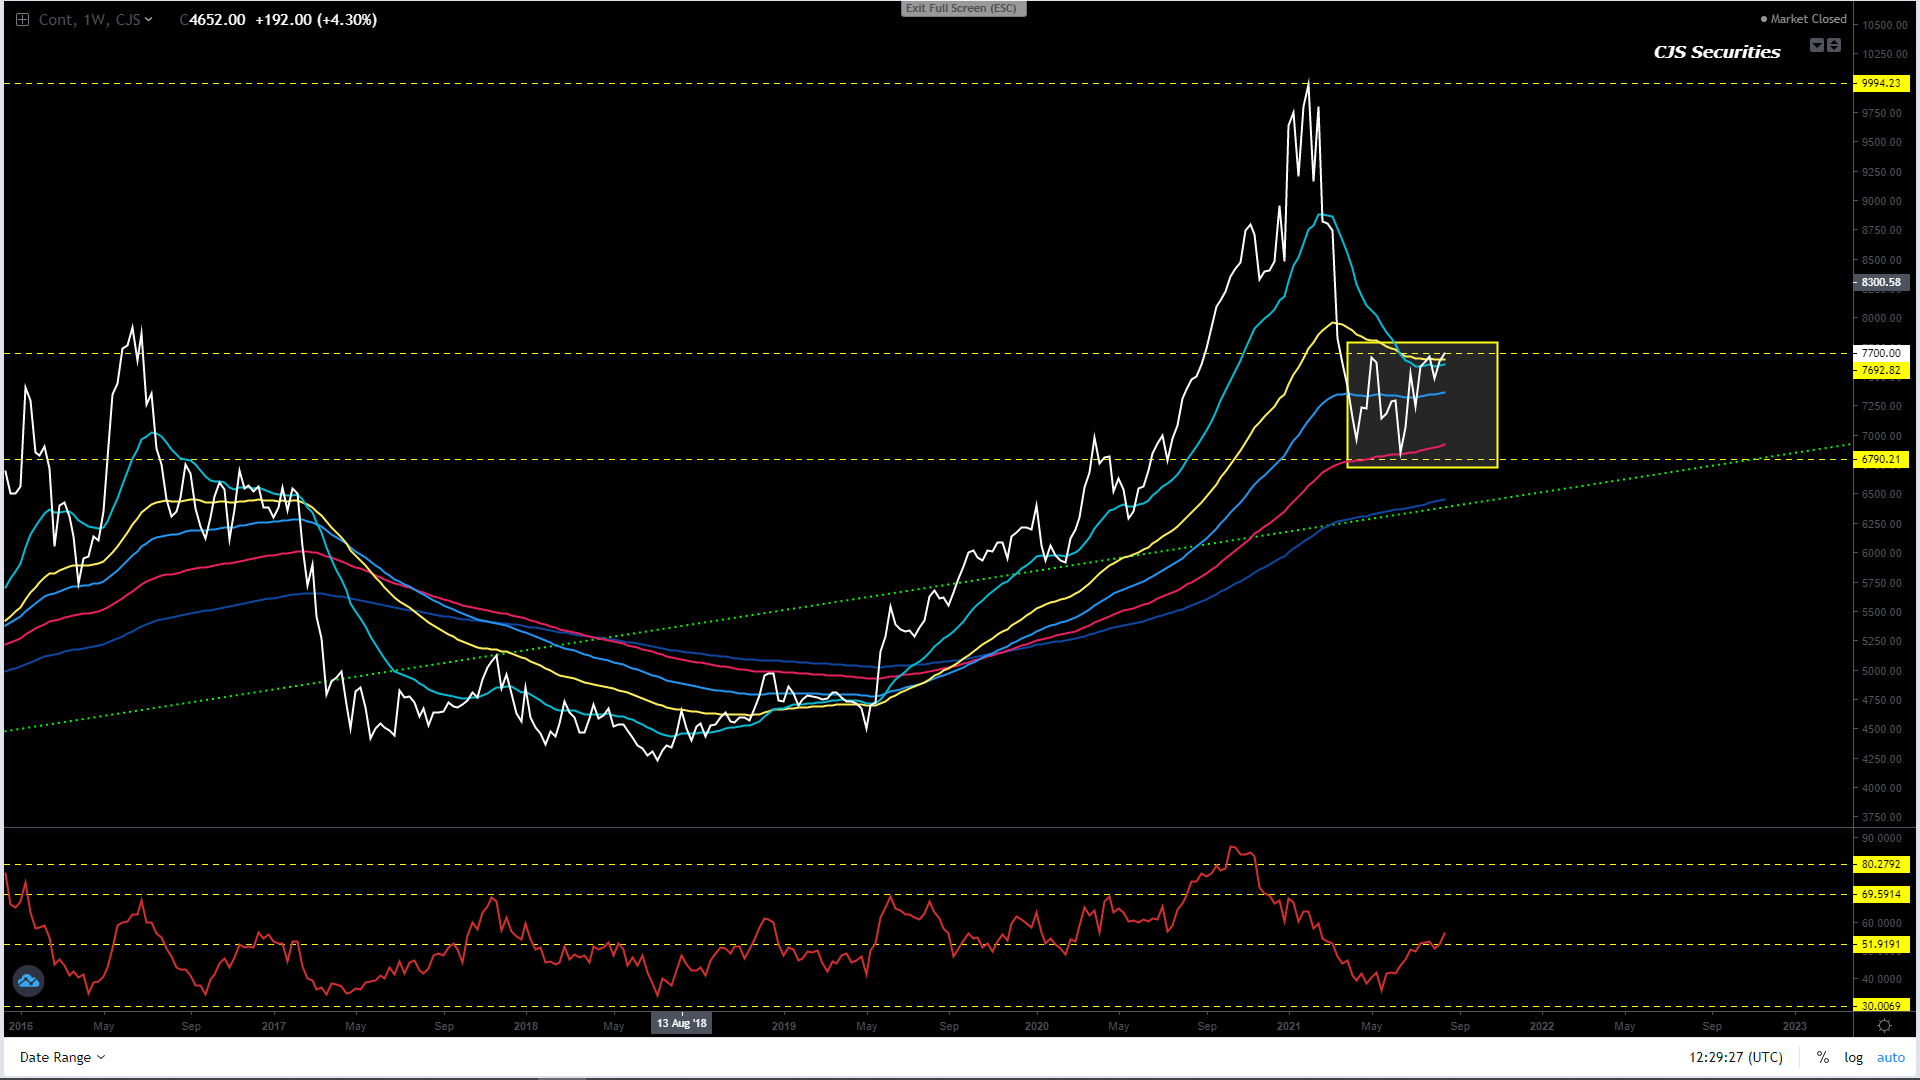
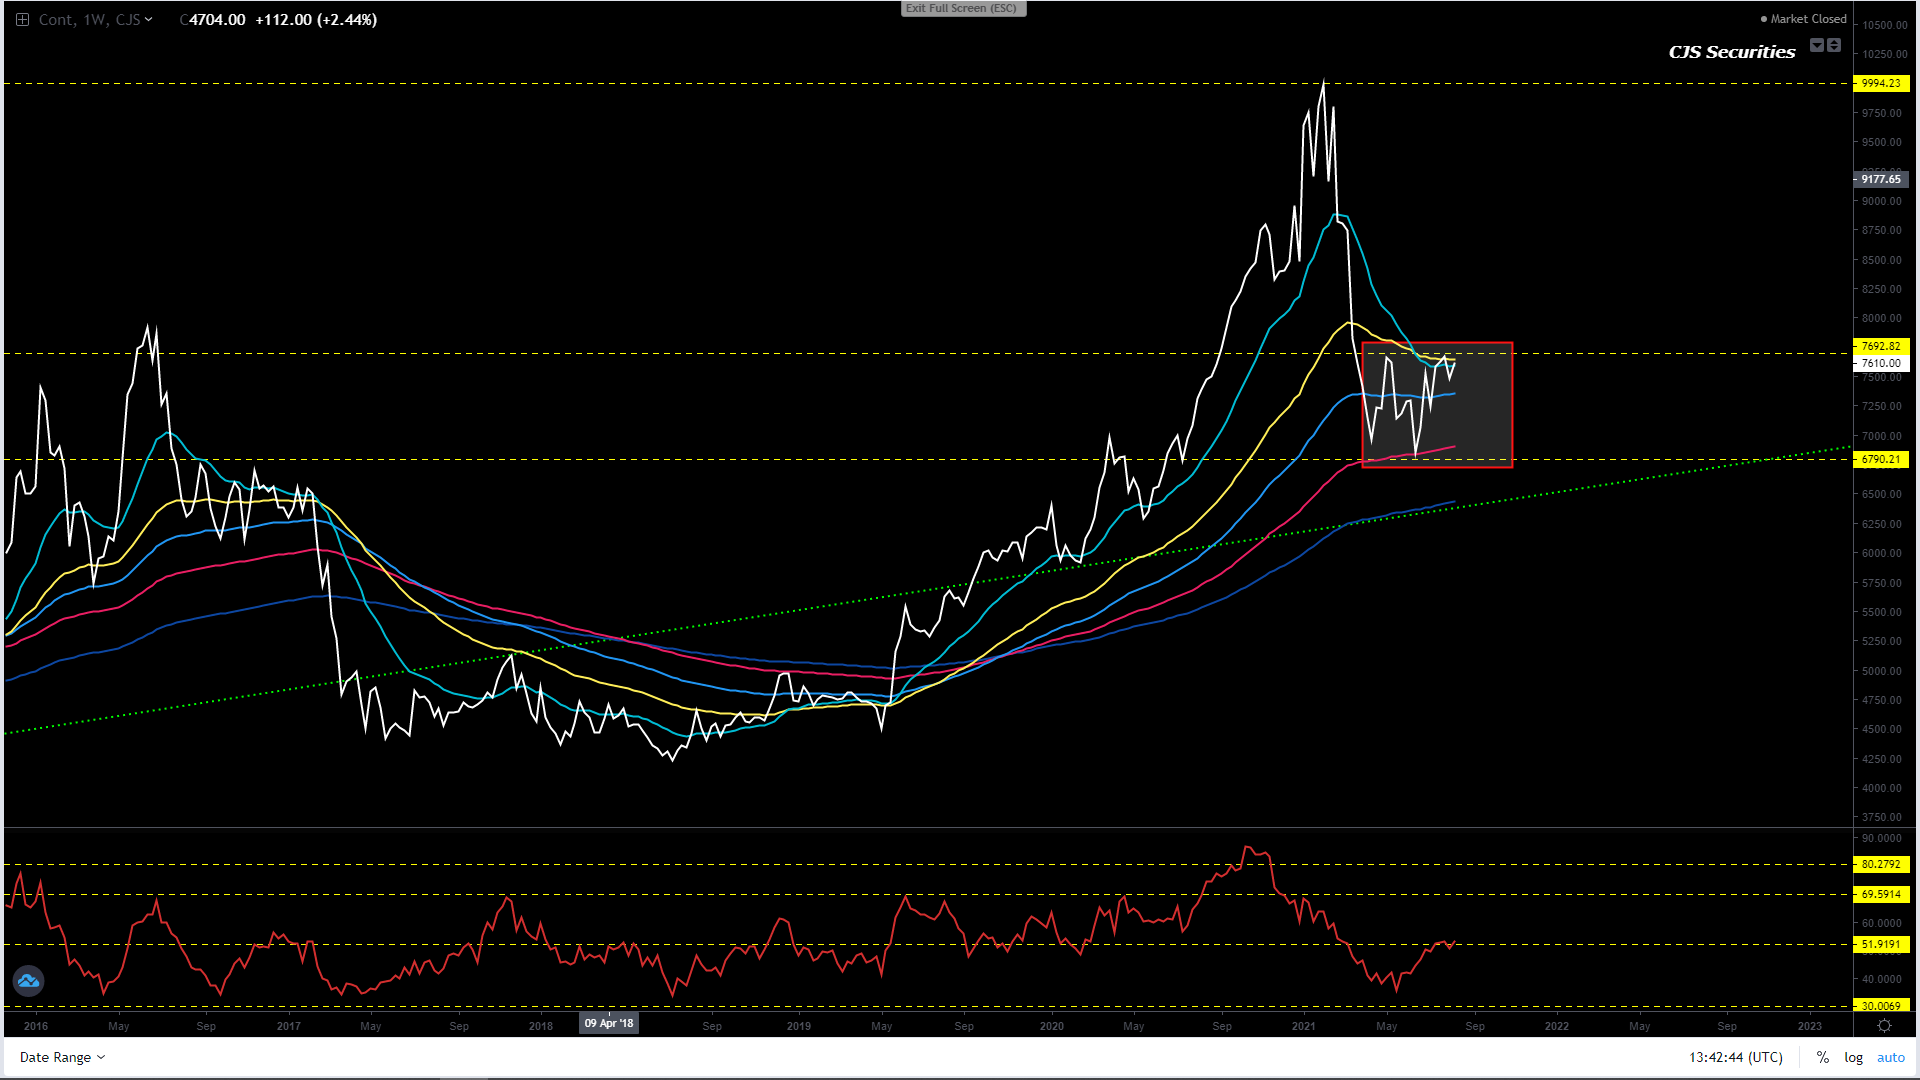
Weekly SAF Soy Continuous Close
#No Change in Commentary
I am not sold on the fact that this chart will take out the double tops and rally from here.
What I will say is that should we have a weekly close over R7700 the chart should print R8400 fairly quickly!
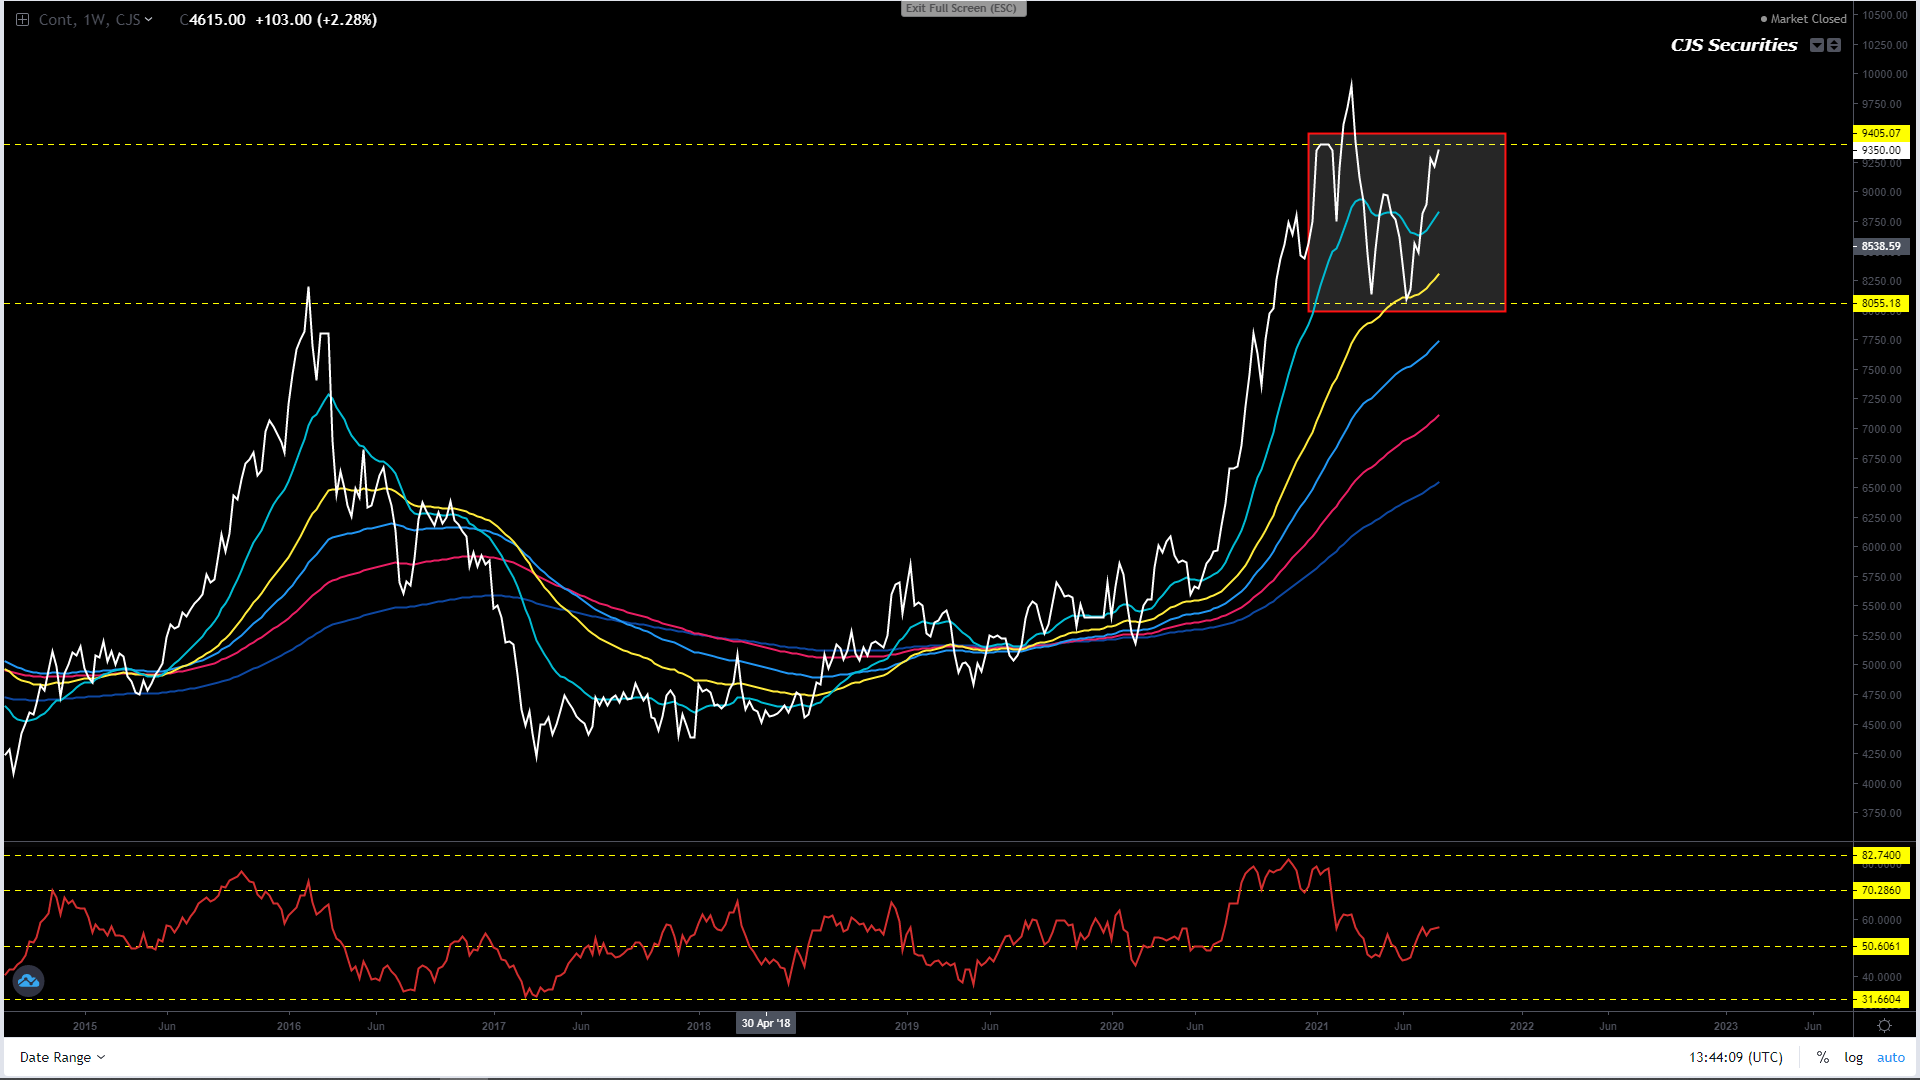
Weekly SAF Suns Continuous Close
As things stand I am struggling to see this chart not make ATH’s and with momentum who knows just how high it could go!
I would not be short for love, money or charity!
Weekly CBOT Soy Oil Continuous Close
There is literally nothing I can change on this chart’s commentary.
The correction seems to be playing out as per the road map, and I would profit from the rallies until further notice!
I feel that this correction will play out over many weeks, if not months and that waiting for the market to come to you is the key to putting together a decent long position at the proper levels.
Sub $0.50is still on the cards.
Weekly CBOT SBM Continuous Close
#No Change in Commentary
I feel the correction is over and that all dips are buying opportunities.
I remain in love with this chart (even though most think it’s the dog with fleas) and believe being long will be the best ST win!
The WASDE has come and gone and the chart remains in a corrective phase no matter how you interpret the data and the weather.
The correction will only break with a weekly close of over $6.42.
I would only consider the Bull story to be over should we have a Weekly close under $4.56.
Until then, all the deep dips REMAIN buying opportunities.
The rallies remain selling opportunities (profit taking only) and the dips remain buying opportunities (getting long)!
I REMAIN really bullish in the “big picture” but,t we could easily see this market come off after trying print $6.00, so in short you may well have the chance to get long sub $5.00!
240 Min December 21 Corn Candle Chart Close
I have left the road map in as drawn last week.
I still feel that this chart can print $6.00 – $6.11 but the market feels very tired and has felt like this for a good few weeks.
In my experience, this typically occurs before a good move, as most have cut their positions.
I REMAIN a proponent of BTD’s and take cash on the rallies!.
Weekly WM Continuous Close
All the dips are buying opportunities and anything close to R3000 will be the biggest opportunity.
My ZAR flat price view is that R3000 – R2800 will be the ultimate low should we get there and that one cannot afford to be caught short as a change of trend can occur at any moment.
Weekly YM Continuous Close
I like this chart and feel a pullback may be on the cards, but that all pullbacks are buying opportunities!
Once the correction is over this chart will be looking to break out to the upside by R500 or more, but I am not sure this is sustainable due to my Corn view.
Weekly KC Wheat Continuous Close
#No Change in Commentary
I love this chart, I have loved this chart and its working like a bomb!
Only thing we are now patiently waiting for is where to get longer!
Weekly Chicago SRW Wheat Continuous
#I can’t add anything new to the below!
For those that bought down to $6.14, well done as you are in for the ride of 2021 (as far as wheat is concerned)!
We are now waiting to add, so I will ring the bell if we feel it’s time to BTD!
Wheat is set to rally in the coming months, and opportunity beckons! – “This view is aging better than a Chateau du Pape 1985.”
Daily Close KC Wheat v Chicago SRW Continuous Close
The chart is coming off after being highly overbought.
I hope most of you took the cash, I am not sure how this plays out so I will reserve my view until next week.
If you have not taken some cash off the table I would run a tight stop.
Weekly SAF Wheat Continuous Close
So much for the pullback and false break.
This could easily still rally but as I missed it I will need to let the formation play out over a week or two and revise my view.
Daily Matif Wheat Continuous Close
Next time I say I am not
sold on a bullish breakout, please don’t listen.
This chart could continue
to rally but I am happy to sit out now as “discretion remains the better part
of valour”.
Another week of decent volatility and another weekly close overR14.48 that is now starting to give this chart a strong base!
In my perfect world I would like this chart to have a weekly close between R14.50 – R14.60 to complete the correction so that from next week we can start to attack the R15.00 level.
If I am right the chart is headed north and that come 1 November 2021, we would have printed R17.00.
The oscillator has a very bullish formation IMO and I am happy to own the USD here.
Looking at all the EMA’s you will see just how big a weekly close over R15.00 will be, and a move through there should be quite explosive.
Dollar/Rand Daily Candle
The Daily chart remains bullish, but could still see a ST move down to R14.52 as to complete the correction / consolidation.
R14.84remains a massive level on a daily close, I cannot emphasise this enough.
I can’t find a reason to be short this chart at all.
Dollar/Rand 240 min Candle
This time frame is playing out very nicely and in my perfect world , we have a little leg up to R14.82, then down toR14.52before blowing higher.
I would look to buy the USD sub R14.62.
Euro/USD Weekly Close
#No Change in Commentary
Based on this chart’s current formation all I want to say is that if $1.16 goes its could all be over bar the shouting and the print of $1.08!
This chart needs a weekly close under $1.1753 for continued downside momentum.
I am still unsure if this is a correction to trade north of $1.24 in the coming months or if we hit the MT top?
As with the DXY below this is either the start of big things or another / last leg in the trend before the Mother of all moves.
US Dollar Index Weekly Candle
#No Change in Commentary
This chart’s commentary has not changed much other than a print over 97.00 could see the lows in and a move so hard that we could see 120.00!
The 96.60 level still looks to be on the cards, but as with the Euro, I am unsure if we push lower for the last leg down or if this chart blows higher.
My alternative road map in white (no change yet) has a very similar outcome in the bigger picture.
SA Government Bond 30 Year Yield Daily Close
All though the chart keeps coming lower it has rising bottoms and the 10.30% level was not tested over the last weeks.
Now we can look to print 11.10% and thereafter 11.80%with new ATH’s not being off the cards.
My bigger view remains that we will see the chart rally & rally hard.
The 10.30% level REMAINS CRITICAL on a Weekly close!!!!!
US Government Bond 30 Year Yield Weekly Close
Not much change in the
commentary below other than this chart is set to take many players to the
cleaners but will need to close over 2.00%to confirm!
These are the buying
levels IMO.
I would look at buying
a move back to 1.90% – 1.80%that will have upside targets from 2.58% – 2.71%.
Please note that only
a weekly close of over 3.50%will confirm that the trend has been broken.
There is not too much to add to the commentary as this correction remains far from over and could take a good few weeks, if not months, to complete.
Use all the rallies to take profit but keep a core long as the major trend/cycle is up.
Let the market come to you, and don’t chase it, as dogs that chase cars end up being run over.
If you are lucky enough to see a move sub $12.40 (November 21), own it for the LT.
240 Min CBOT November 21 Soybean Candle Chart
This market is playing out more and more like a triangle keeping everyone bullish at the top and less bullish at the bottom.
The good news is that this is a fantastic selling opportunity with a stop loss over $14.20 and targets at $12.61.
This trade gives you a RR of 5 /1 and in anyone’s book, a bet worth taking!
In the big picture, I want to own this chart for the LT from $12.40 -$11.60!
Board Crush Continuous Daily Close
All I can say is, at this stage, this chart can come off to the $0.5531 level.
I would only get long under $0.58 in any size.
If this view is correct, there should still be a move back to $1.10.
Oil Share Continuous Daily Close
I love this chart, but in it’s current guise I would allow it to play out for another week or 2 as we could be headed well lower.
Weekly SAF Soy Continuous Close
I am not sold on the fact that this chart will take out the double tops and rally from here.
What I will say is that should we have a weekly close over R7700 the chart should print R8400 fairly quickly!
Weekly SAF Suns Continuous Close
Well, the downside did not last very long and based on the current formation one cannot be short at all.
As things stand I am struggling to see this chart not make ATH’s.
Weekly CBOT Soy Oil Continuous Close
There is literally nothing I can change on this chart’s commentary.
The correction seems to be playing out as per the road map, and I would profit from the rallies until further notice!
I feel that this correction will play out over many weeks, if not months and that waiting for the market to come to you is the key to putting together a decent long position at the proper levels.
Sub $0.50is still on the cards.
Weekly CBOT SBM Continuous Close
I feel the correction is over and that all dips are buying opportunities.
I remain in love with this chart (even though most think it’s the dog with fleas) and believe being long will be the best ST win!
Its WASDE week and oh my how we need the volatility back while all I can say is that this correction will either drag on for weeks, if not months or rally hard from here.
The correction will only break with a weekly close of over $6.42.
I would only consider the Bull story to be over should we have a Weekly close under $4.56.
Until then, all the deep dips REMAIN buying opportunities.
The rallies remain selling opportunities (profit taking only) and the dips remain buying opportunities (getting long)!
People all I want you to know is that I am really bullish in the “big picture” but that we could easily see this market come off after trying print $6.00, so in short you may well have the chance to get long sub $5.00!
240 Min December 21 Corn Candle Chart Close
After seeing the price action over the last couple of weeks I am now even more convinced in my view that we should see a rally of $0.50 and a hard one at that, before coming off again.
The market feels very tired and has felt like this for a good few weeks.
In my experience, this typically occurs before a good move, as most have cut their positions.
I remain a proponent of BTD’s and take cash on the rallies!.
Weekly WM Continuous Close
My view is the low is in and you should be well long.
With the ZAR not in great shape and Corn looking at a ST rally we could be in for a decent rally of R500 – R800, but that I would ship in some puts against my longs on the way up!
To understand why please see my Corn view.
Weekly YM Continuous Close
As with WM my view is the low is in and you should be well long.
This chart is looking to break out to the upside by R500 or more, but as with WM I am not sure this is sustainable due to my Corn view.
Mange risk is all I can say, just manage the risk!
Weekly KC Wheat Continuous Close
I love this chart, I have loved this chart and its working like a bomb!
Only thing we are now patiently waiting for is where to get longer!
Weekly Chicago SRW Wheat Continuous
I can’t add anything new to the below!
For those that bought down to $6.14, well done as you are in for the ride of 2021 (as far as wheat is concerned)!
We are now waiting to add, so I will ring the bell if we feel it’s time to BTD!
Wheat is set to rally in the coming months, and opportunity beckons! – “This view is aging better than a Chateau du Pape 1985.”
Daily Close KC Wheat v Chicago SRW Continuous Close
For those that bought the break out at -$0.19 congratulations, but please look at taking some if not all the cash on the table, as this overbought oscillator is bothering me no end.
For those that bought in the -$0.30’s you can likely mange this a little deeper as I feel $0.10+ is still coming.
Weekly SAF Wheat Continuous Close
I am not happy with this chart false breakout and current formation.
Basis the current formation we could easily see a R200 – R300 fall before looking to rally again.
Daily Matif Wheat Continuous Close
I am not sold on this bullish breakout and would be square over the next week.
This chart could rally to the €235 level, but a failure there can see the chart come back as low as €176.
Discretion is the better part of valour right now.
I am back for my Covid19 enforced hiatus and I am sure you all missed me even though it was only 1 week.
With all the intra week volatility we experienced not once has this chart had a weekly close underR14.48 and his is why weekly closes are so VERY important!
All I want to say is that the chart is headed north and that come 1 November 2021, we would have printed R17.00.
Let us see how well this views ages, as I have a track record of views aging finer than a 1960 Chateau Lafite Rothchild.
The oscillator also has a very bullish formation IMO and I am happy to own the USD here.
“Stick to the levels always, and remember that intra-week traded levels are noise and the weekly close is KING!”- I have left this here for a month now and for good reason
Dollar/Rand Daily Candle
The Daily chart is very bullish now that it’s done with its ST correction.
The greater formation is really bullish an although this is a candle chart please trust me that R14.84 is massive on a daily close and I mean MASSIVE!
I can’t find a reason to be short this chart at all.
Dollar/Rand 240 min Candle
I have tried to draw in a simple formation and all I can say is that in a perfect world the chart makes ST double tops at R15.00, consolidates between R14.80 and R15.00 before blowing higher.
“Gun to the head, I think we see R14.26, and this IMO would be a great buying opportunity. “ – Some fine wine aging going on here!
Euro/USD Weekly Close
The below commentary has not changed at all, but based on this chart’s current formation all I want to say is that if $1.16 goes its could all be over bar the shouting and the print of $1.08!
This chart needs a weekly close under $1.1753 for continued downside momentum.
I am still unsure if this is a correction to trade north of $1.24 in the coming months or if we hit the MT top?
As with the DXY below this is either the start of big things or another / last leg in the trend before the Mother of all moves.
US Dollar Index Weekly Candle
This chart’s commentary has not changed much other than a print over 97.00 could see the lows in and a move so hard that we could see 120.00!
The 96.60 level still looks to be on the cards, but as with the Euro, I am unsure if we push lower for the last leg down or if this chart blows higher.
My alternative road map in white (no change yet) has a very similar outcome in the bigger picture.
SA Government Bond 30 Year Yield Daily Close
The 10.30% level was never tested on this chart and that now we can look to print 11.10% and thereafter 11.80%with new ATH’s not being off the cards.
My bigger view remains that we will see the chart rally & rally hard.
The 10.30% level REMAINS CRITICAL on a Weekly close!!!!!
US Government Bond 30 Year Yield Weekly Close
Not much change in the below other than this chart is set to take many players to the cleaners!
These are the buying levels IMO.
I would look at buying a move back to 1.90% – 1.80%that will have upside targets from 2.58% – 2.71%.
Please note that only a weekly close of over 3.50% will confirm that the trend has been broken.