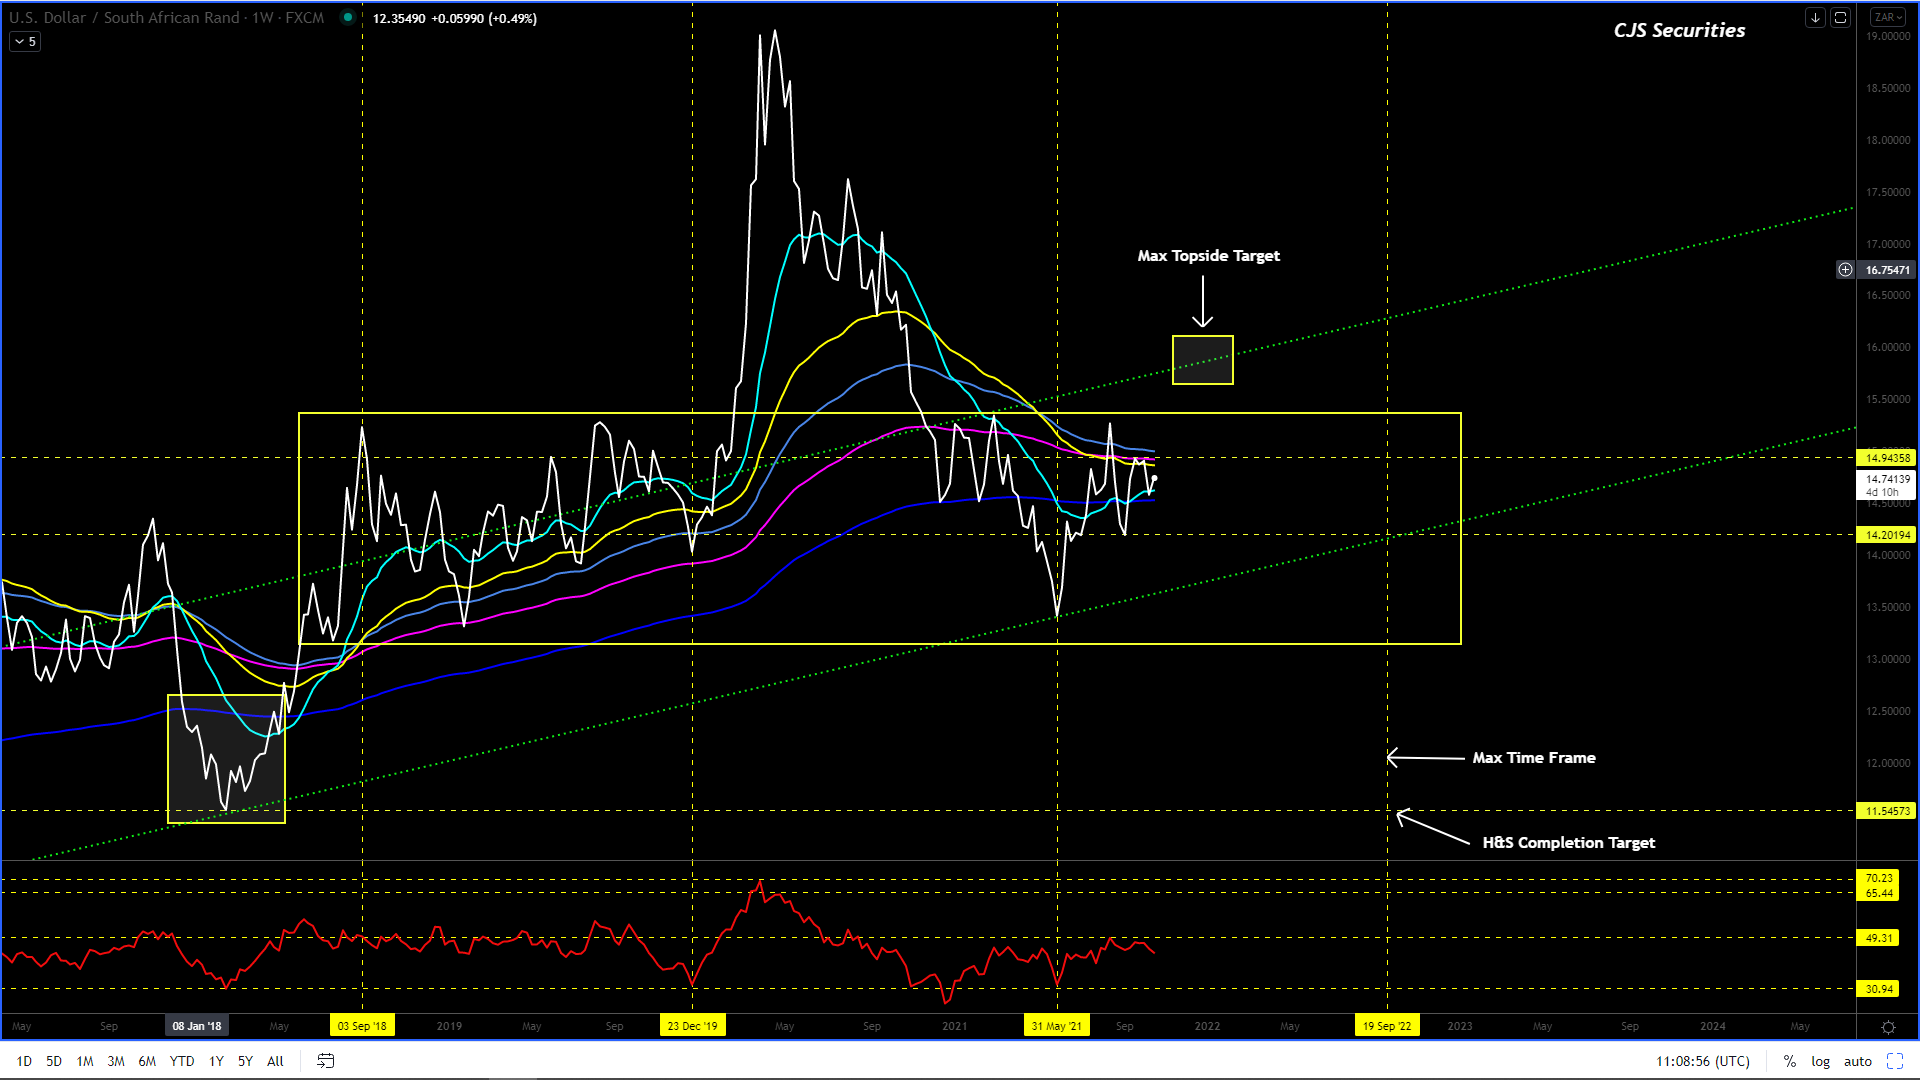
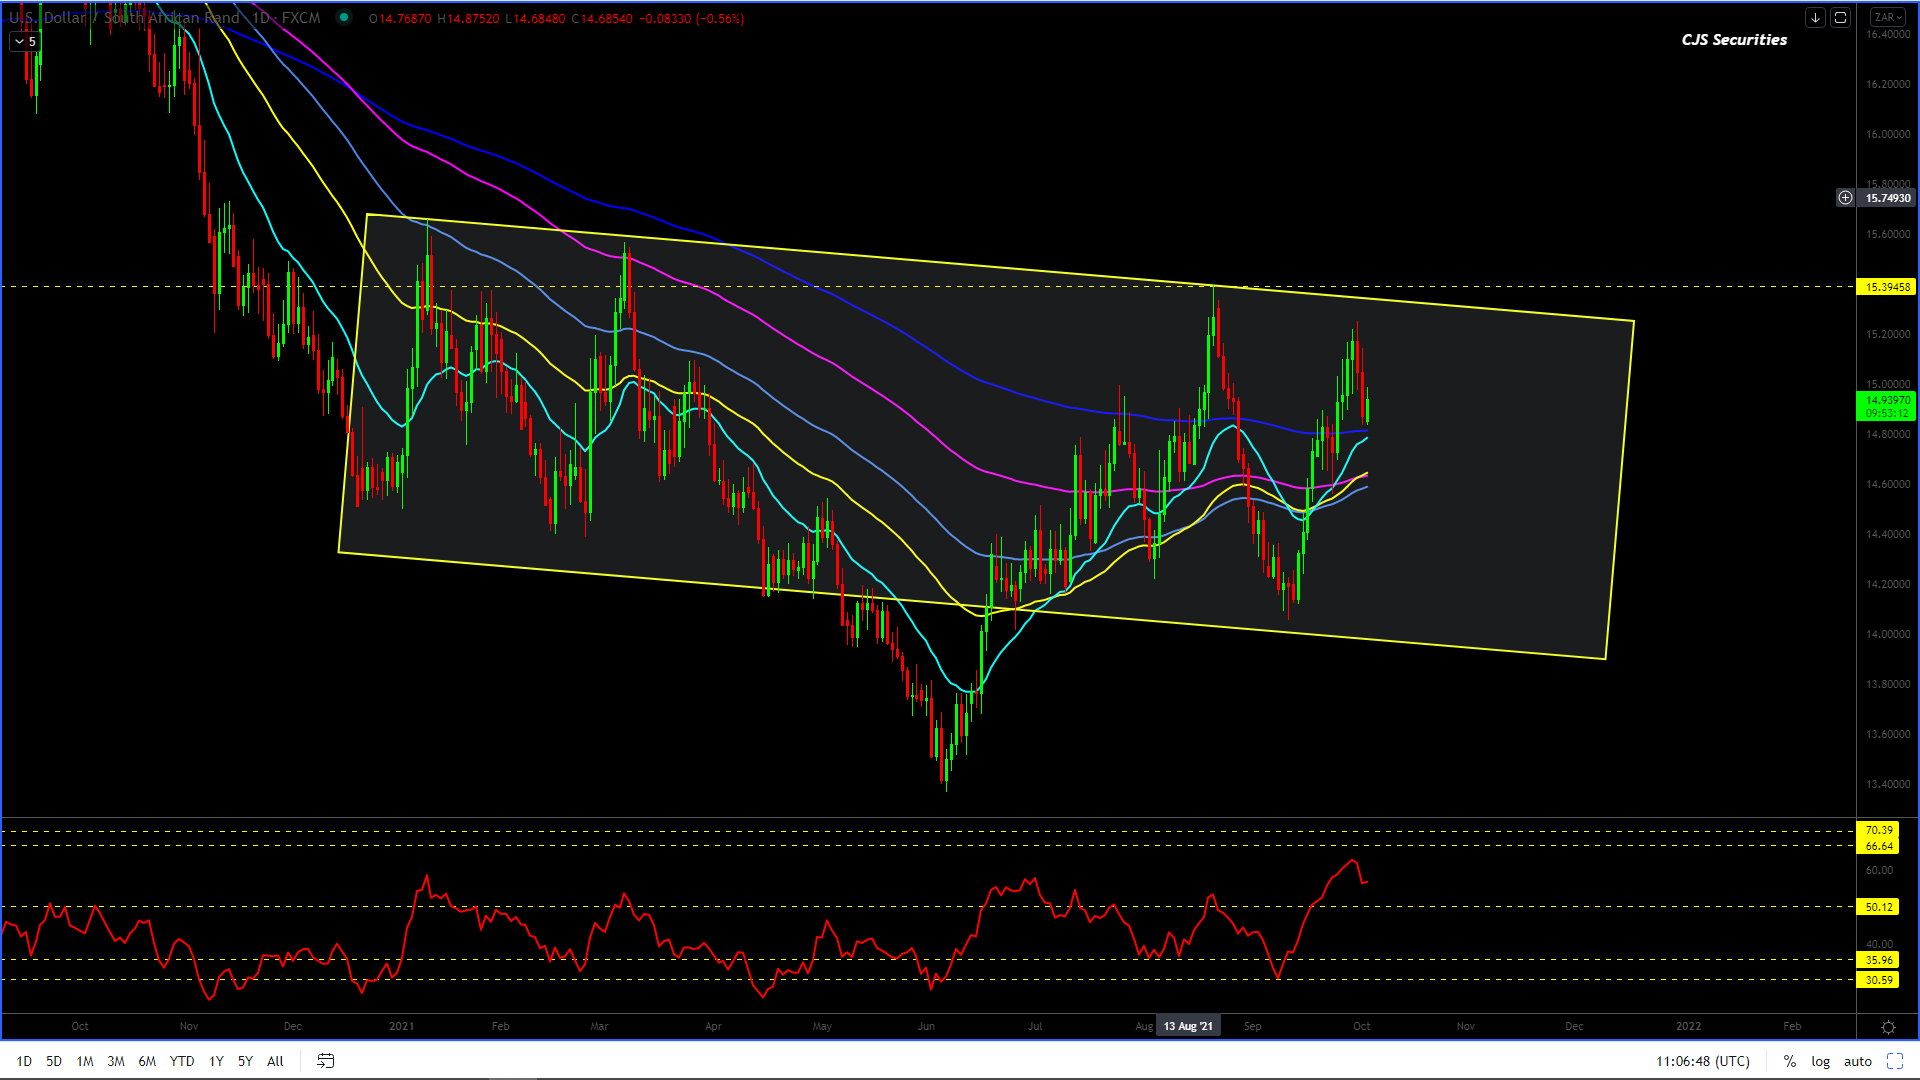
I am very happy with the chart’s current structure and how it is playing out for now.
The chart made a 50% re-tracement down to R14.57 and found great support at the 233 week EMA.
The trading ranges remain very big and if there is one thing the last few months have shown it is that the patient trader comes out on top with regards to Dollar / Rand.
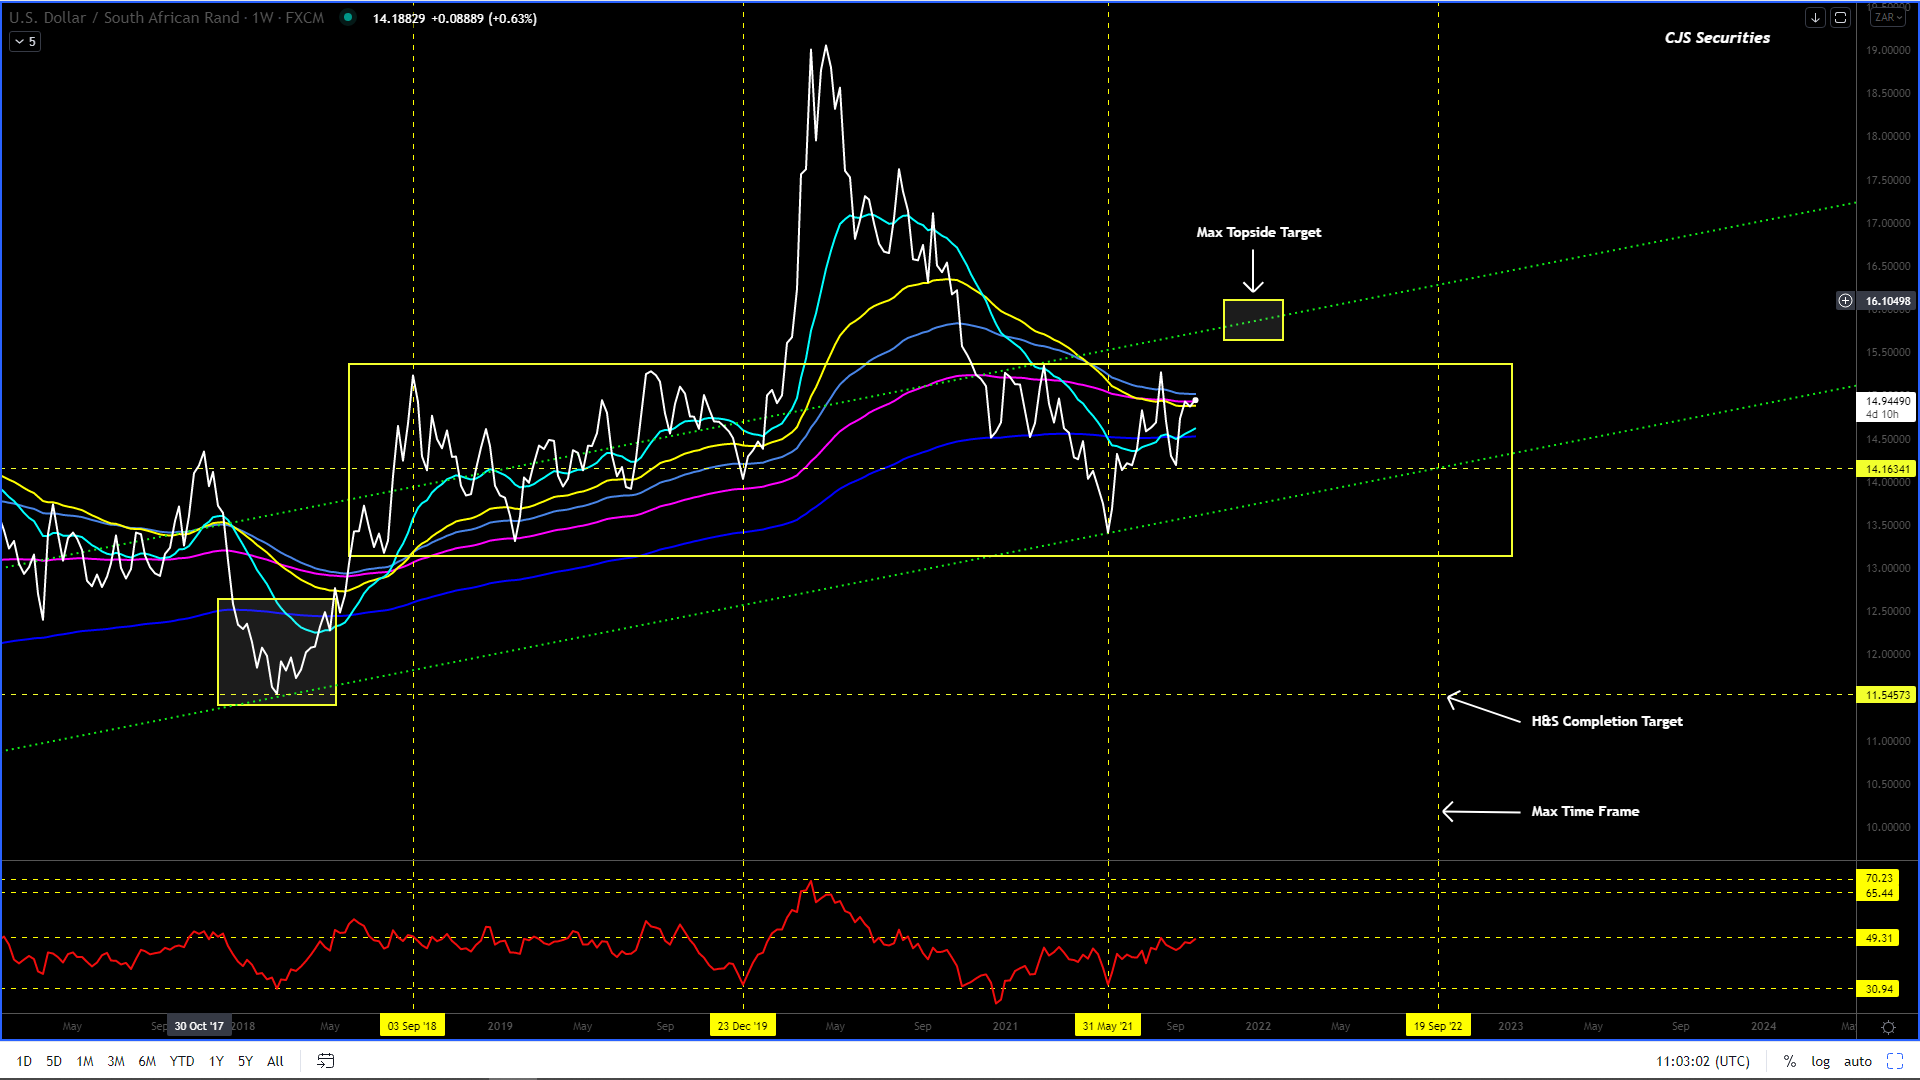
The inverted H&S formation is still in play with targets at R15.78, this is within a much bigger H&S formation which has targets at R11.77.
IMO the MT low is in and that we will see the chart start to rally before the election, however I will only be proven correct on a Weekly Close over R14.94.
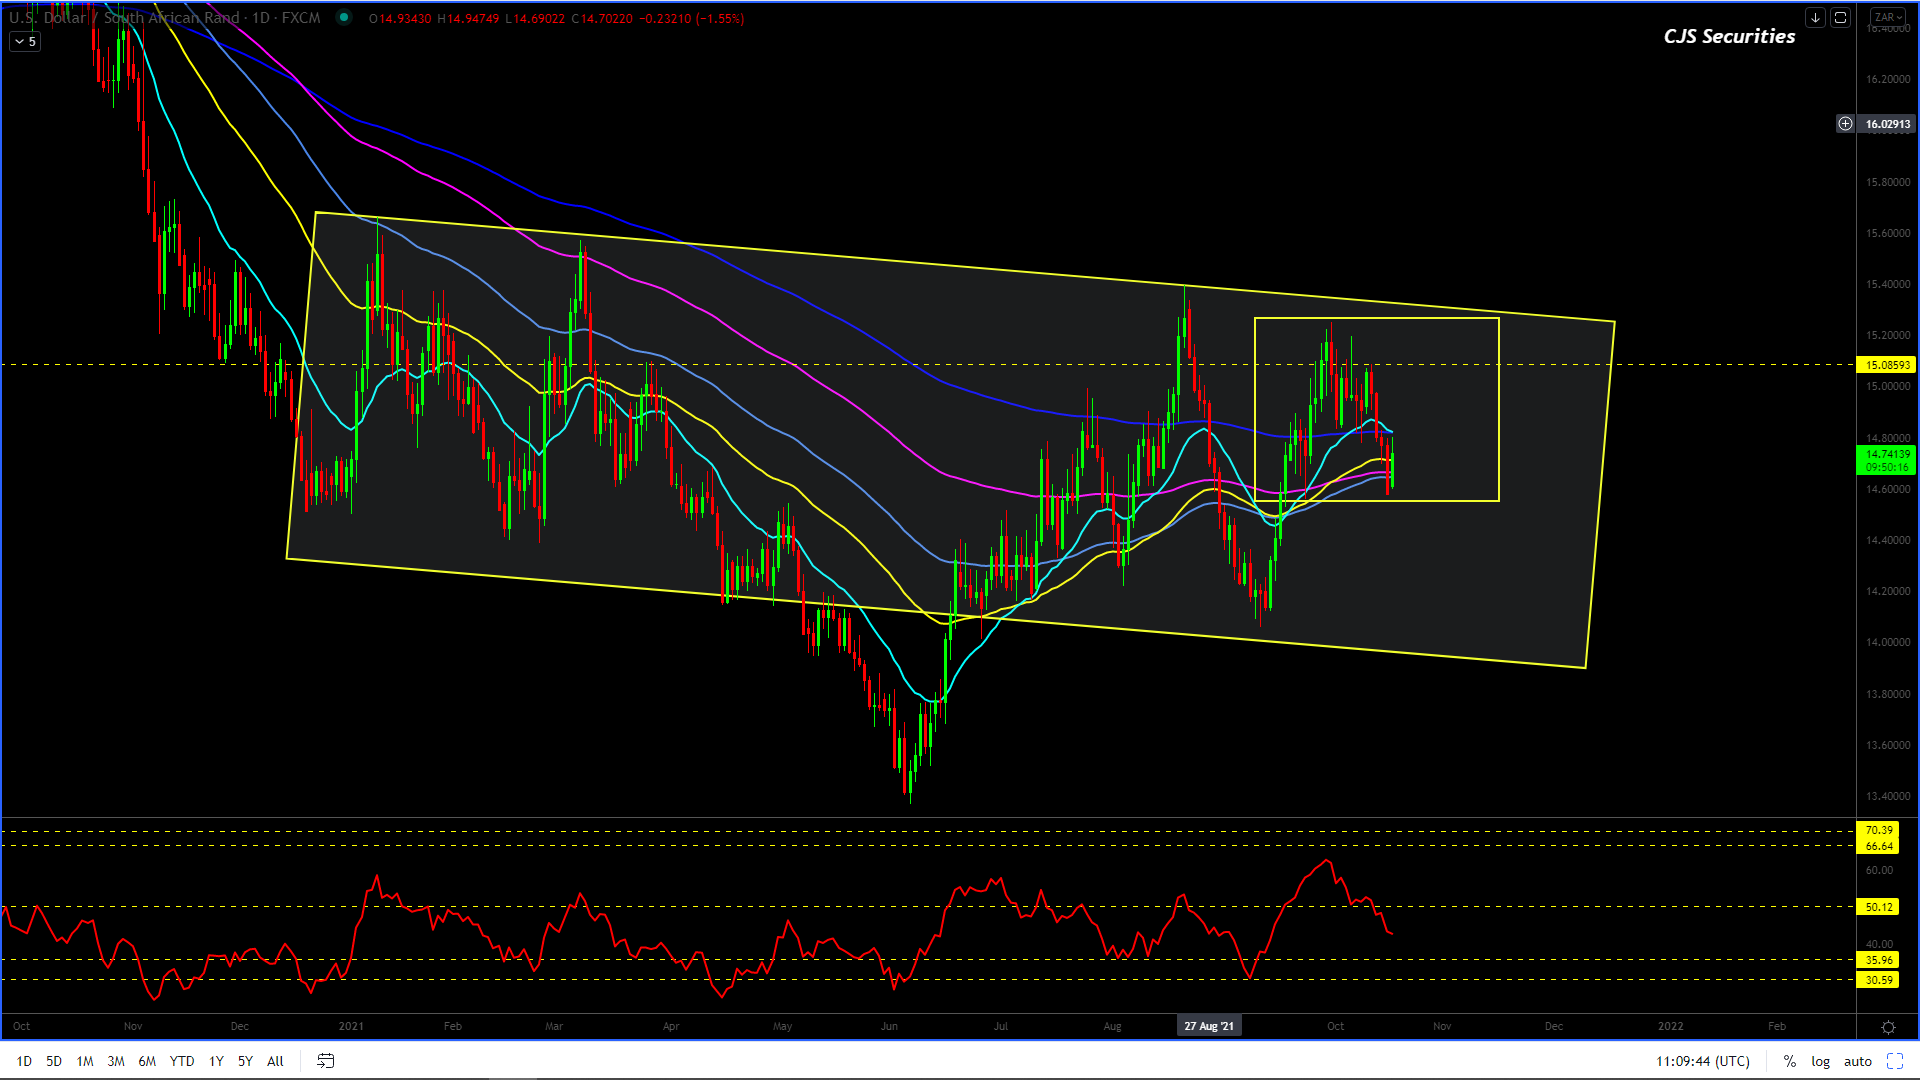
Dollar/Rand Daily Candle
As previously mentioned I felt the chart would pullback to R14.55 and that this would be a great buying opportunity.
The chart traded as low as R14.57 and has subsequently turned around, but you will recall the “Quick Fire” update posted Thursday stating that I would be a buyer from R14.78 scale down and so far this seems to be paying dividends.
Furthermore I can’t add anything to the below other than to change the greater formation, but the outcome remains the same.
Scenario #2 from now 6 weeks ago is still on the cards, although I have changed the irregular flat formation into a classic correction but the upside targets remain intact.
Scenario #2
The current formation is a “classic correction” that trades back to the R14.50’s, then trades up hard and fast to print between R15.70 – R15.86 to complete the correction while getting everyone and their dog long USD, only to collapse and come down to test the yearly lows and possibly print as low as R11.50.
Only a daily close over R16.00 would negate scenario #2.
As with the weekly chart I am now keen to own the USD on a decent pullback that hopefully prints as low as the R14.50’s.
Opportunity is here, seize it with both hands.
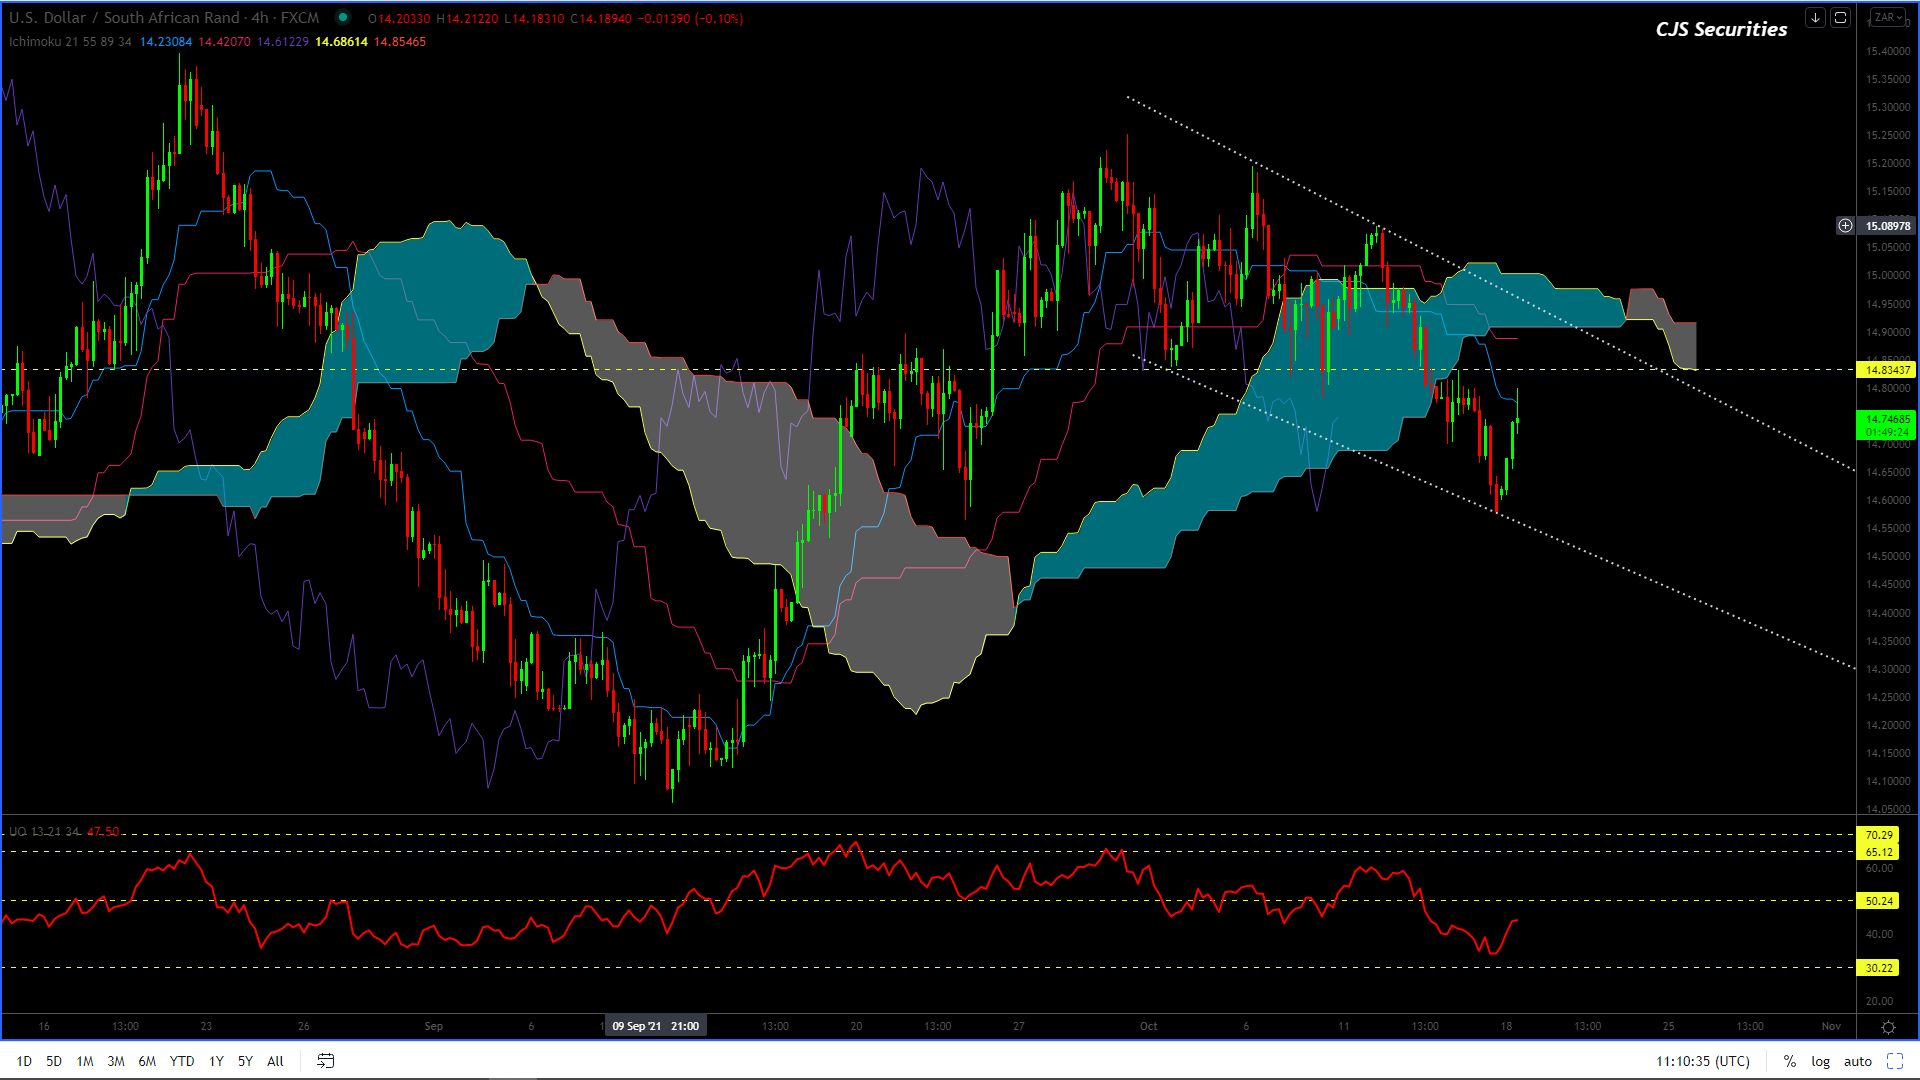
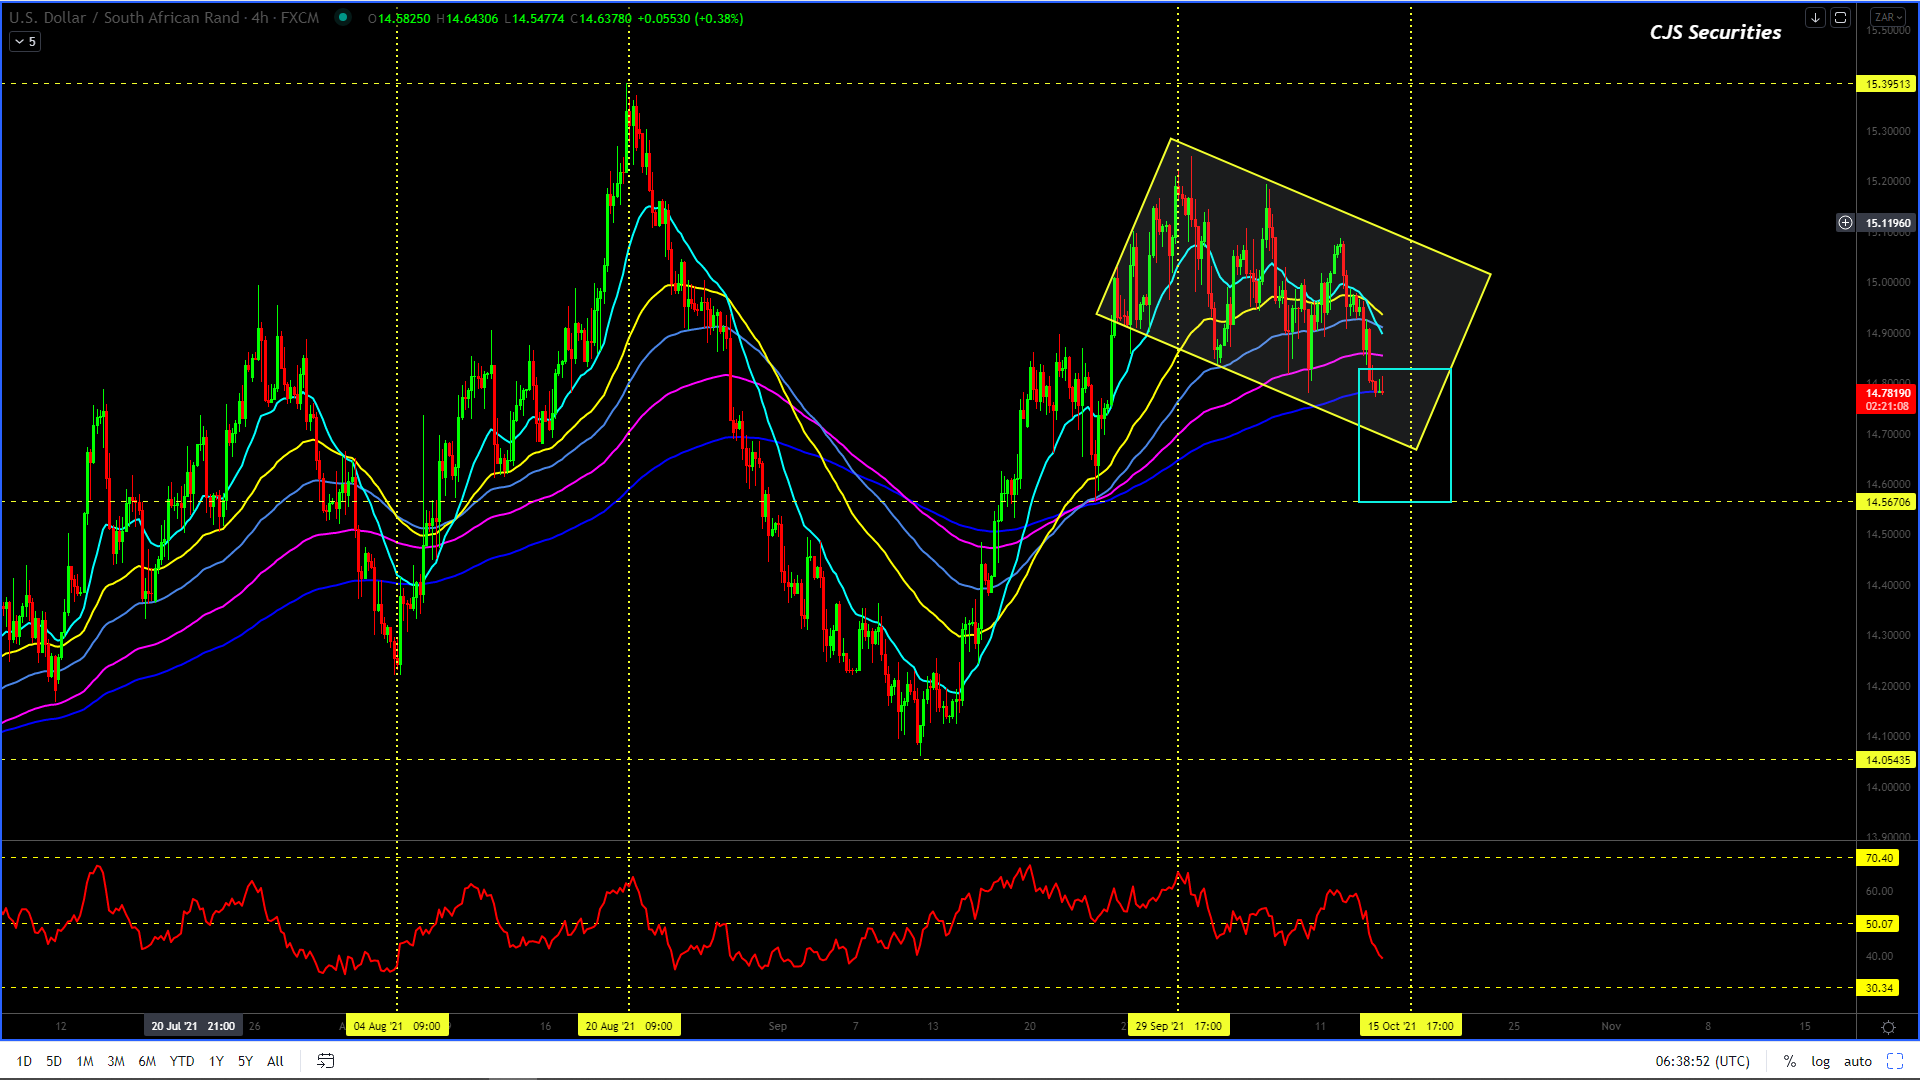
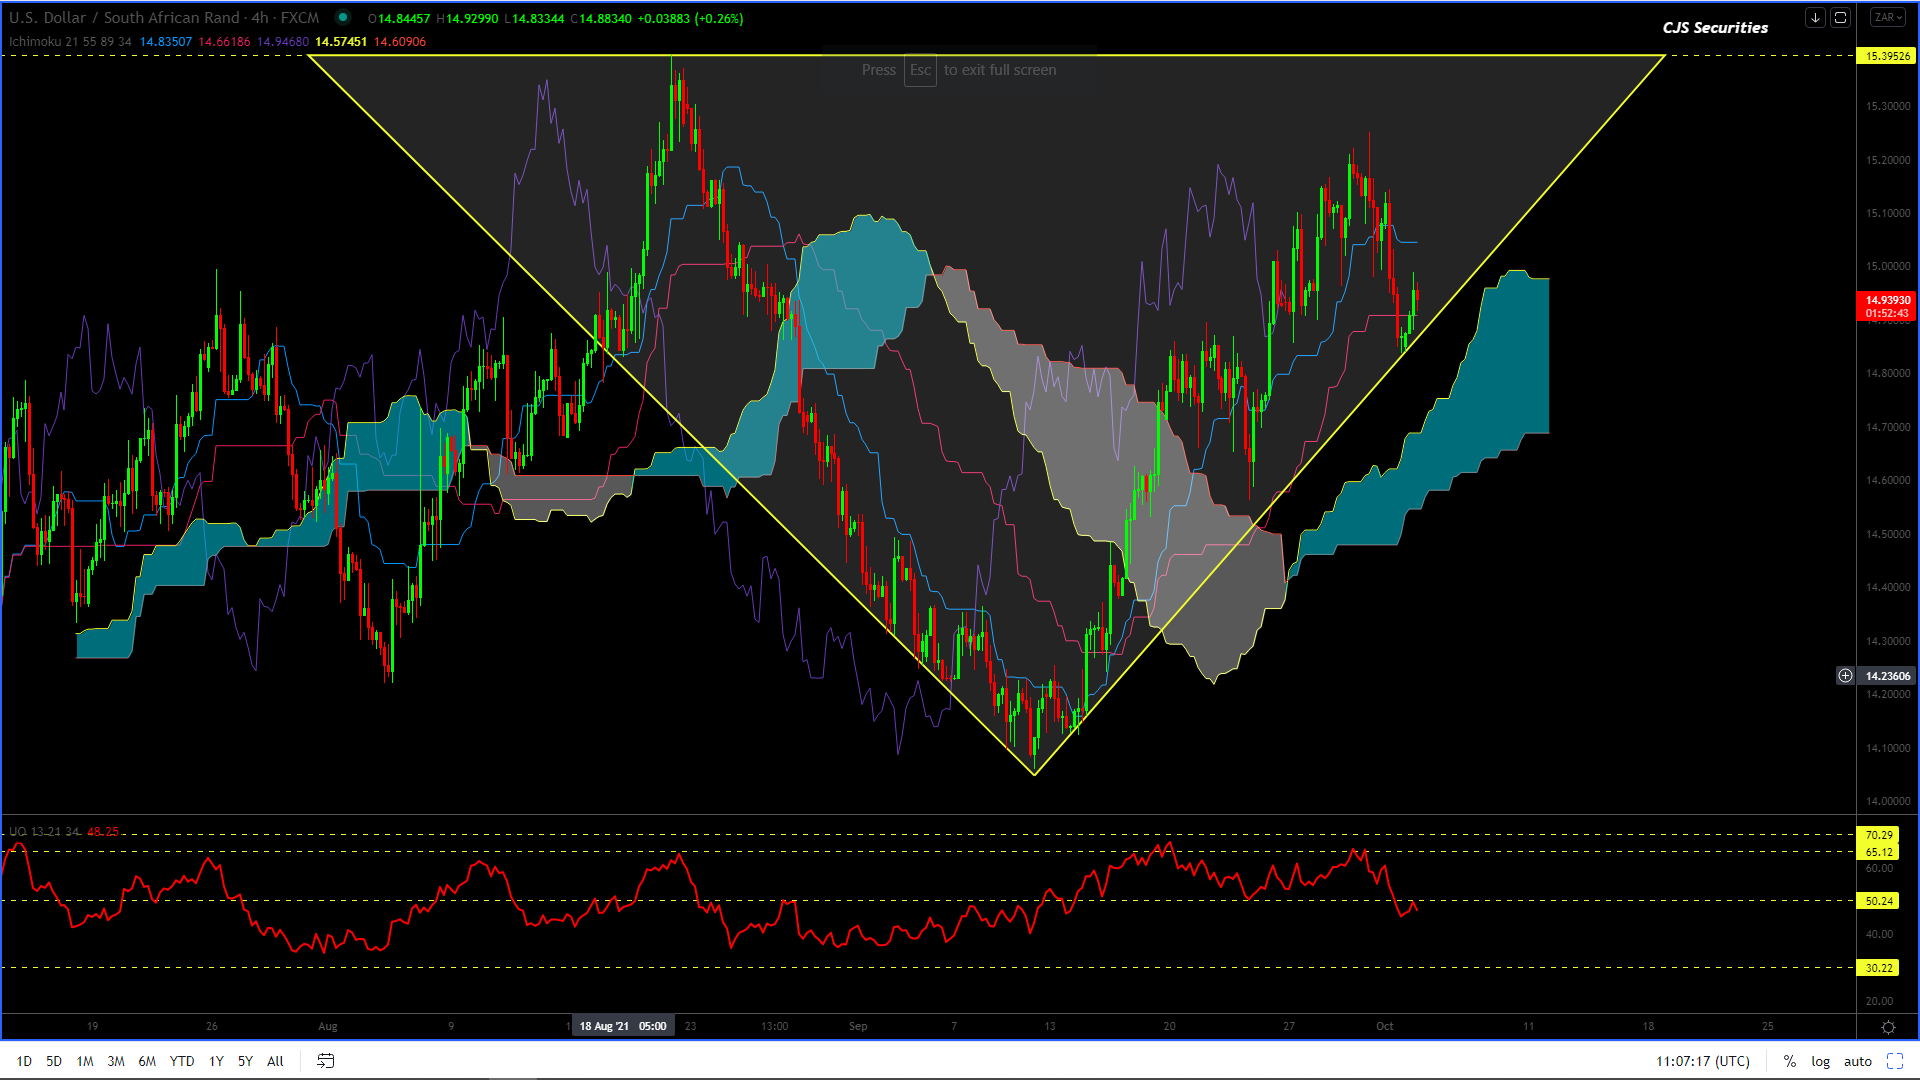
Dollar/Rand 240 min Candle
#No Change in Commentary
I would now be buying scale down from R14.73 – R14.49 with a stop overR14.4650.
Targets on this view would be in excess of R15.50 and hence have a minimum RR of 32/10.
Fingers crossed we can execute.
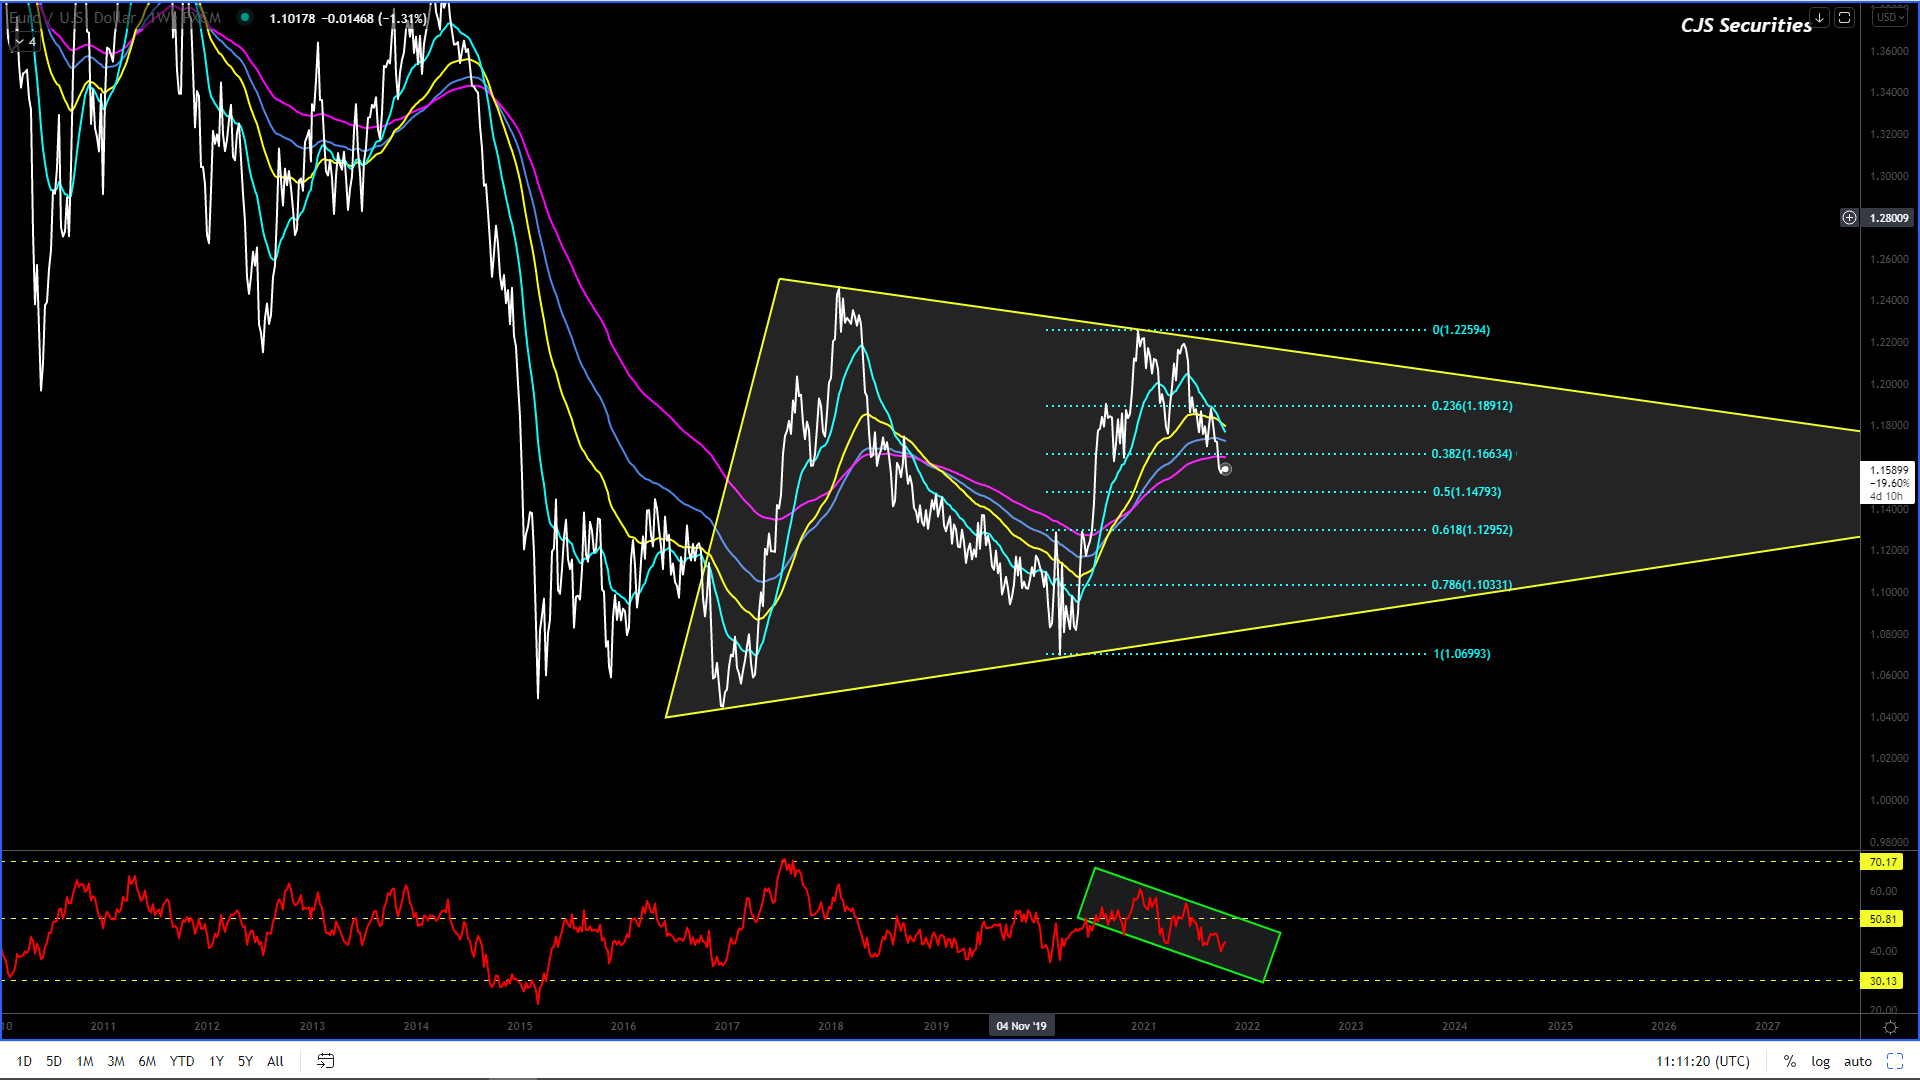
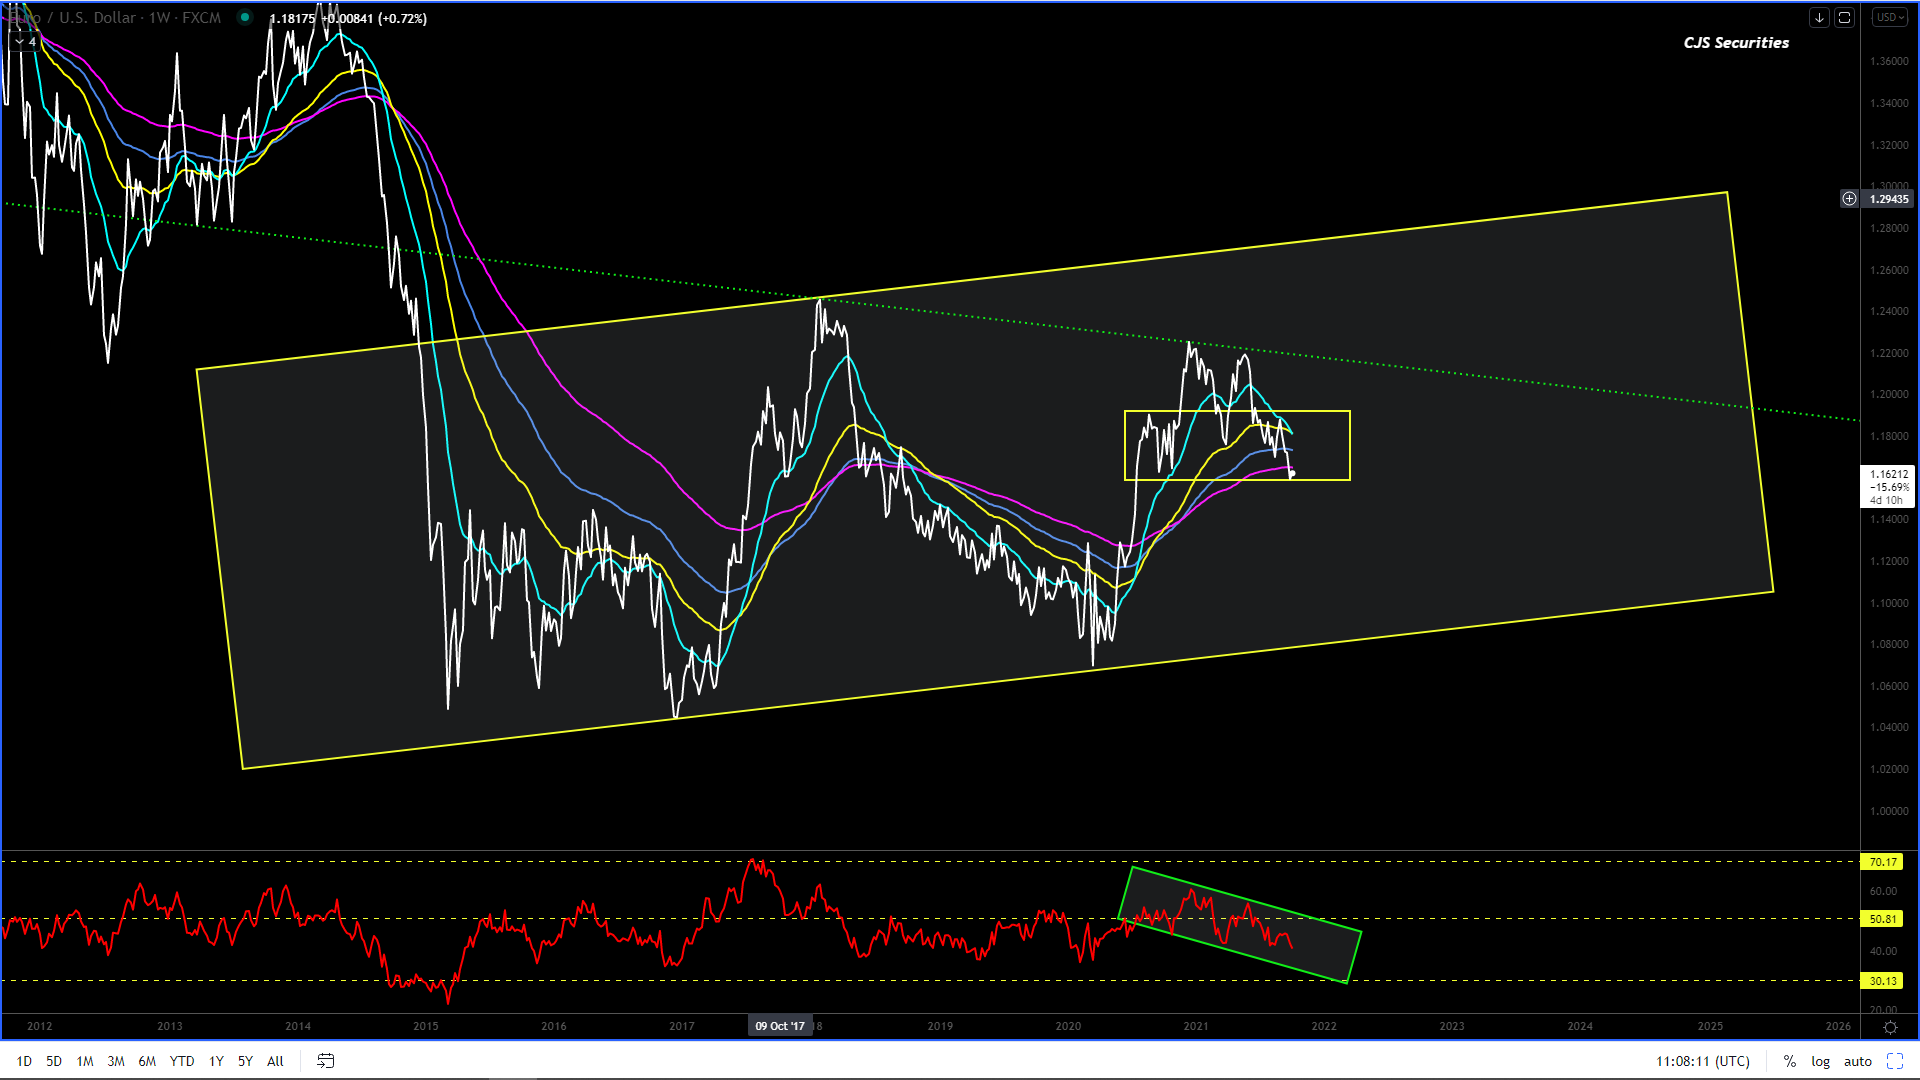
Euro/USD Weekly Close
I remain disappointed with this chart as I would have thought that the breach of $1.16 would induce a violent move lower.
And its with this in mind that I am starting to think that the chart is creating a triangle or a classical correction, but TBH I am pretty confused.
With the breach, and the market now consistently trading below $1.16, we will take a week or two before looking to enter the market again.
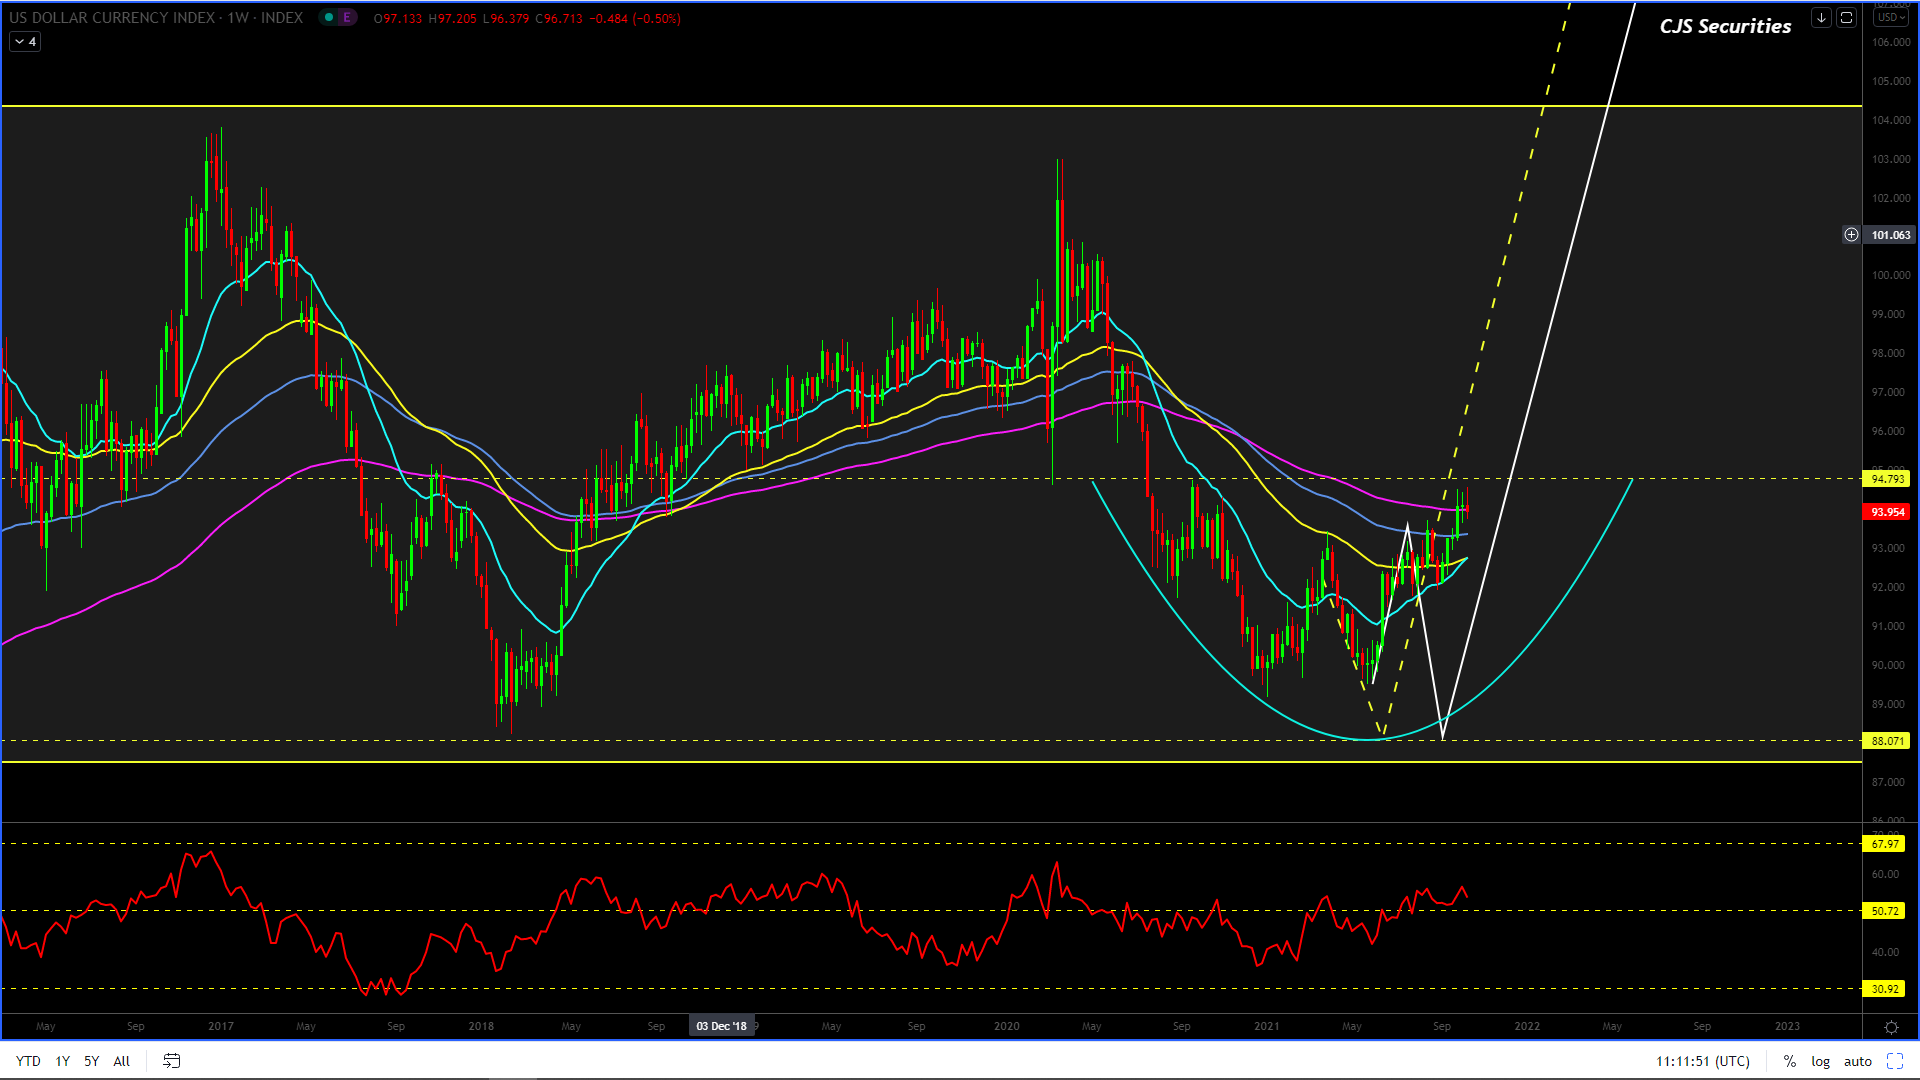
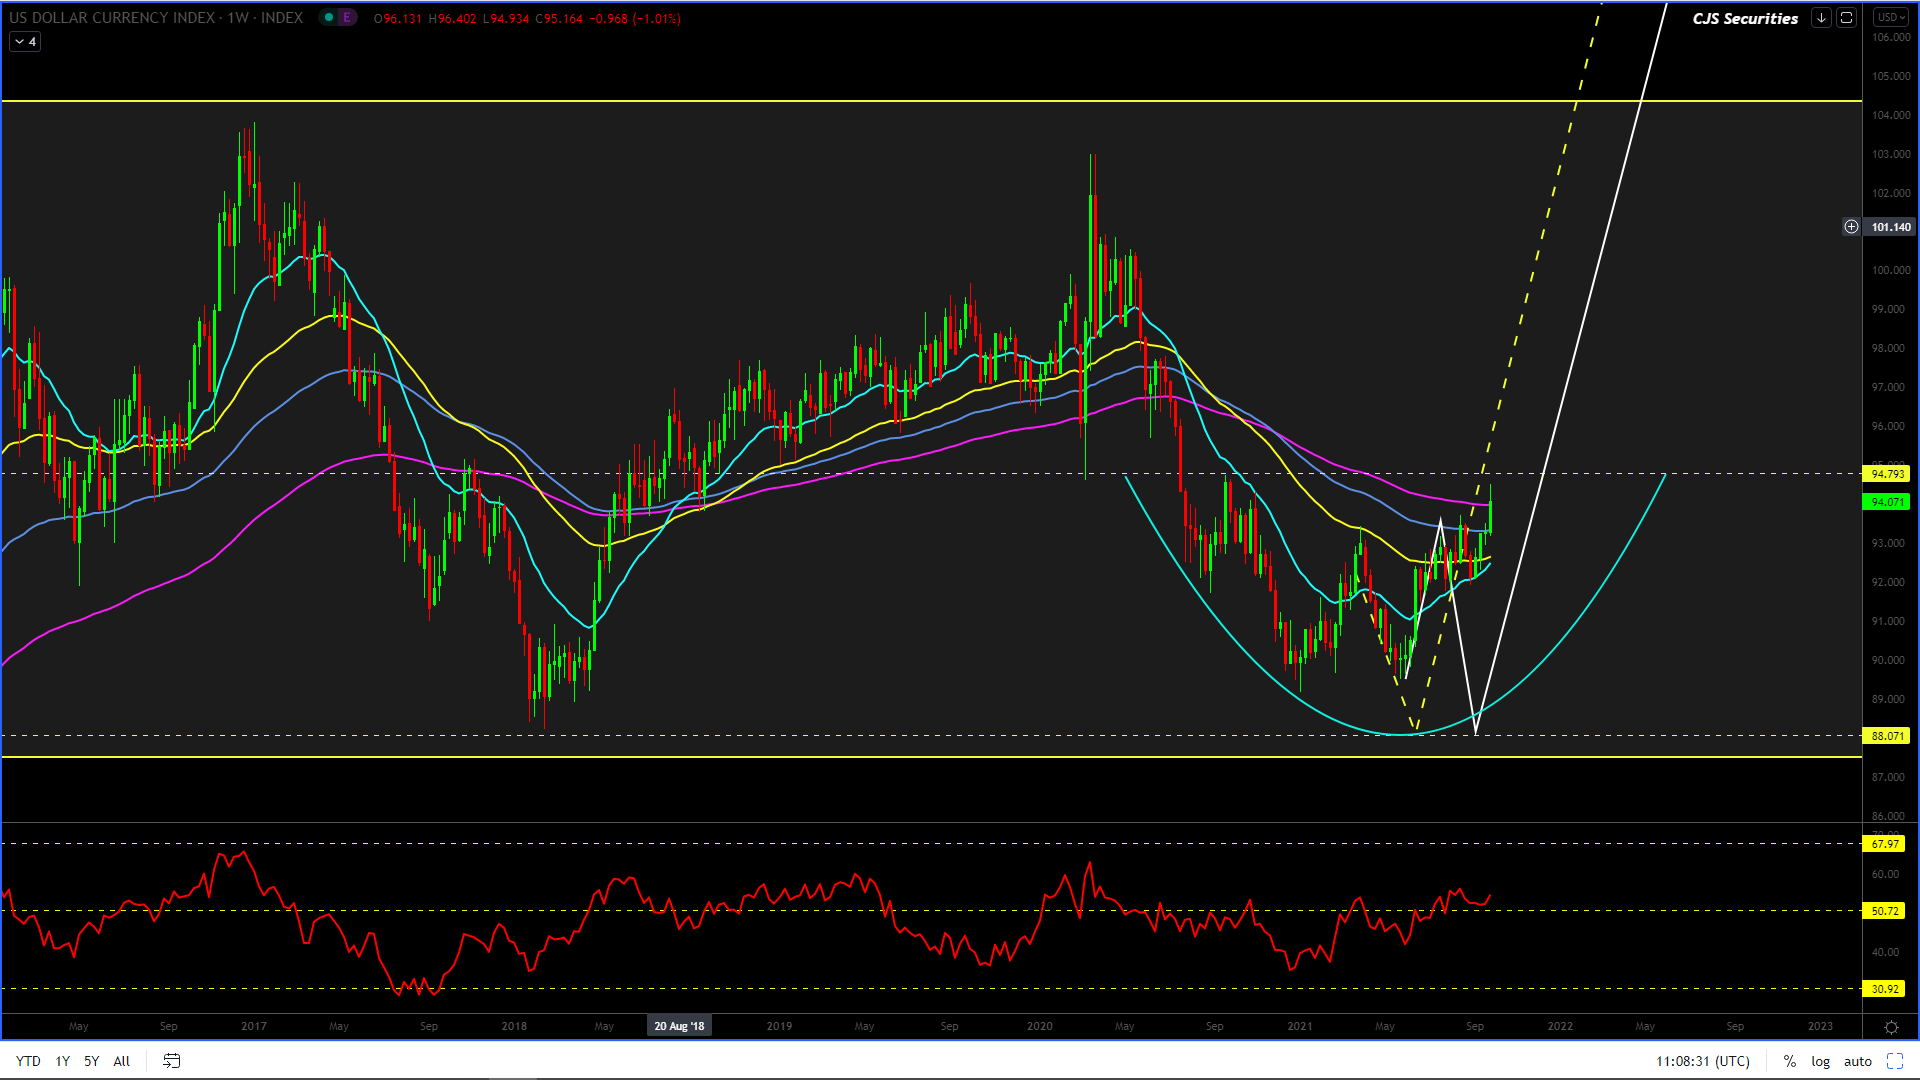
US Dollar Index Weekly Candle
#No Change in Commentary
The range REMAINS 95 -88 and a dip sub 90 is a buy of note while a rally and daily close over 95 would also get me long and until then we will sit on our hands and wait!
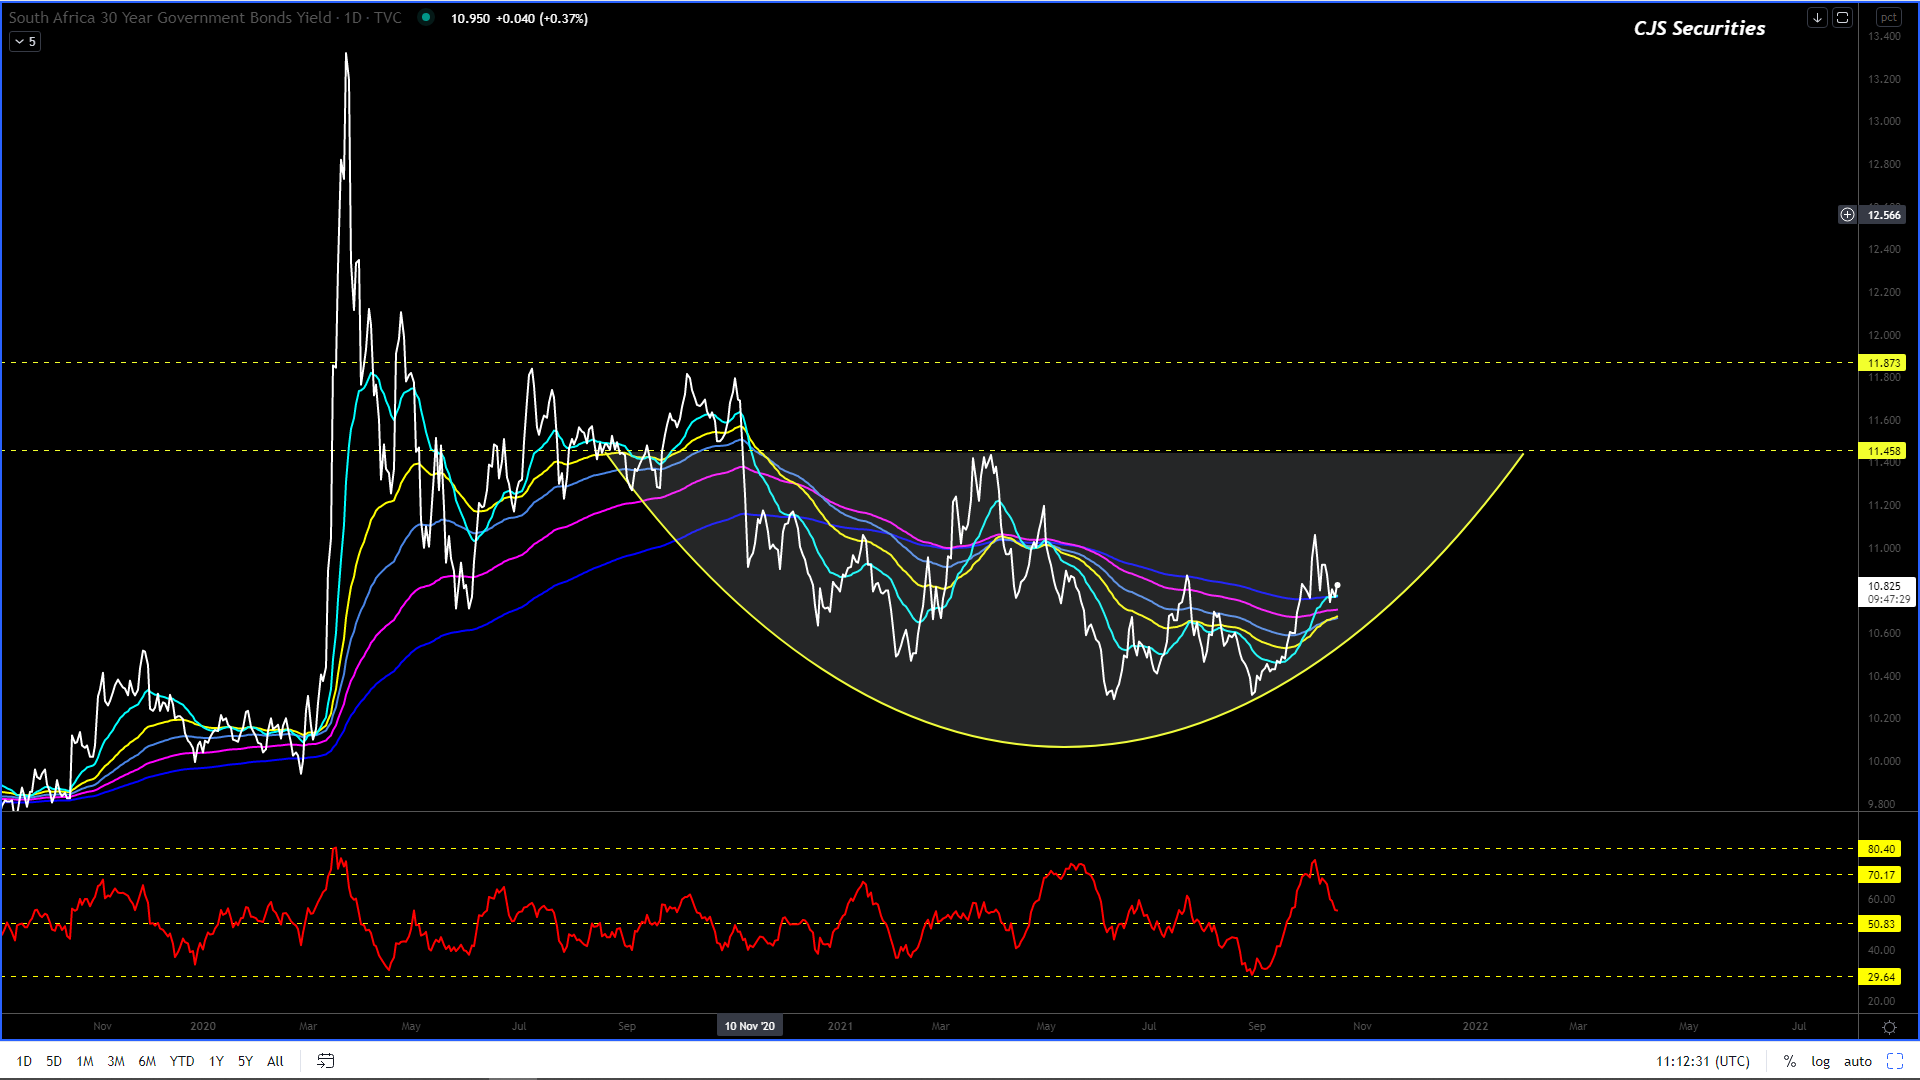
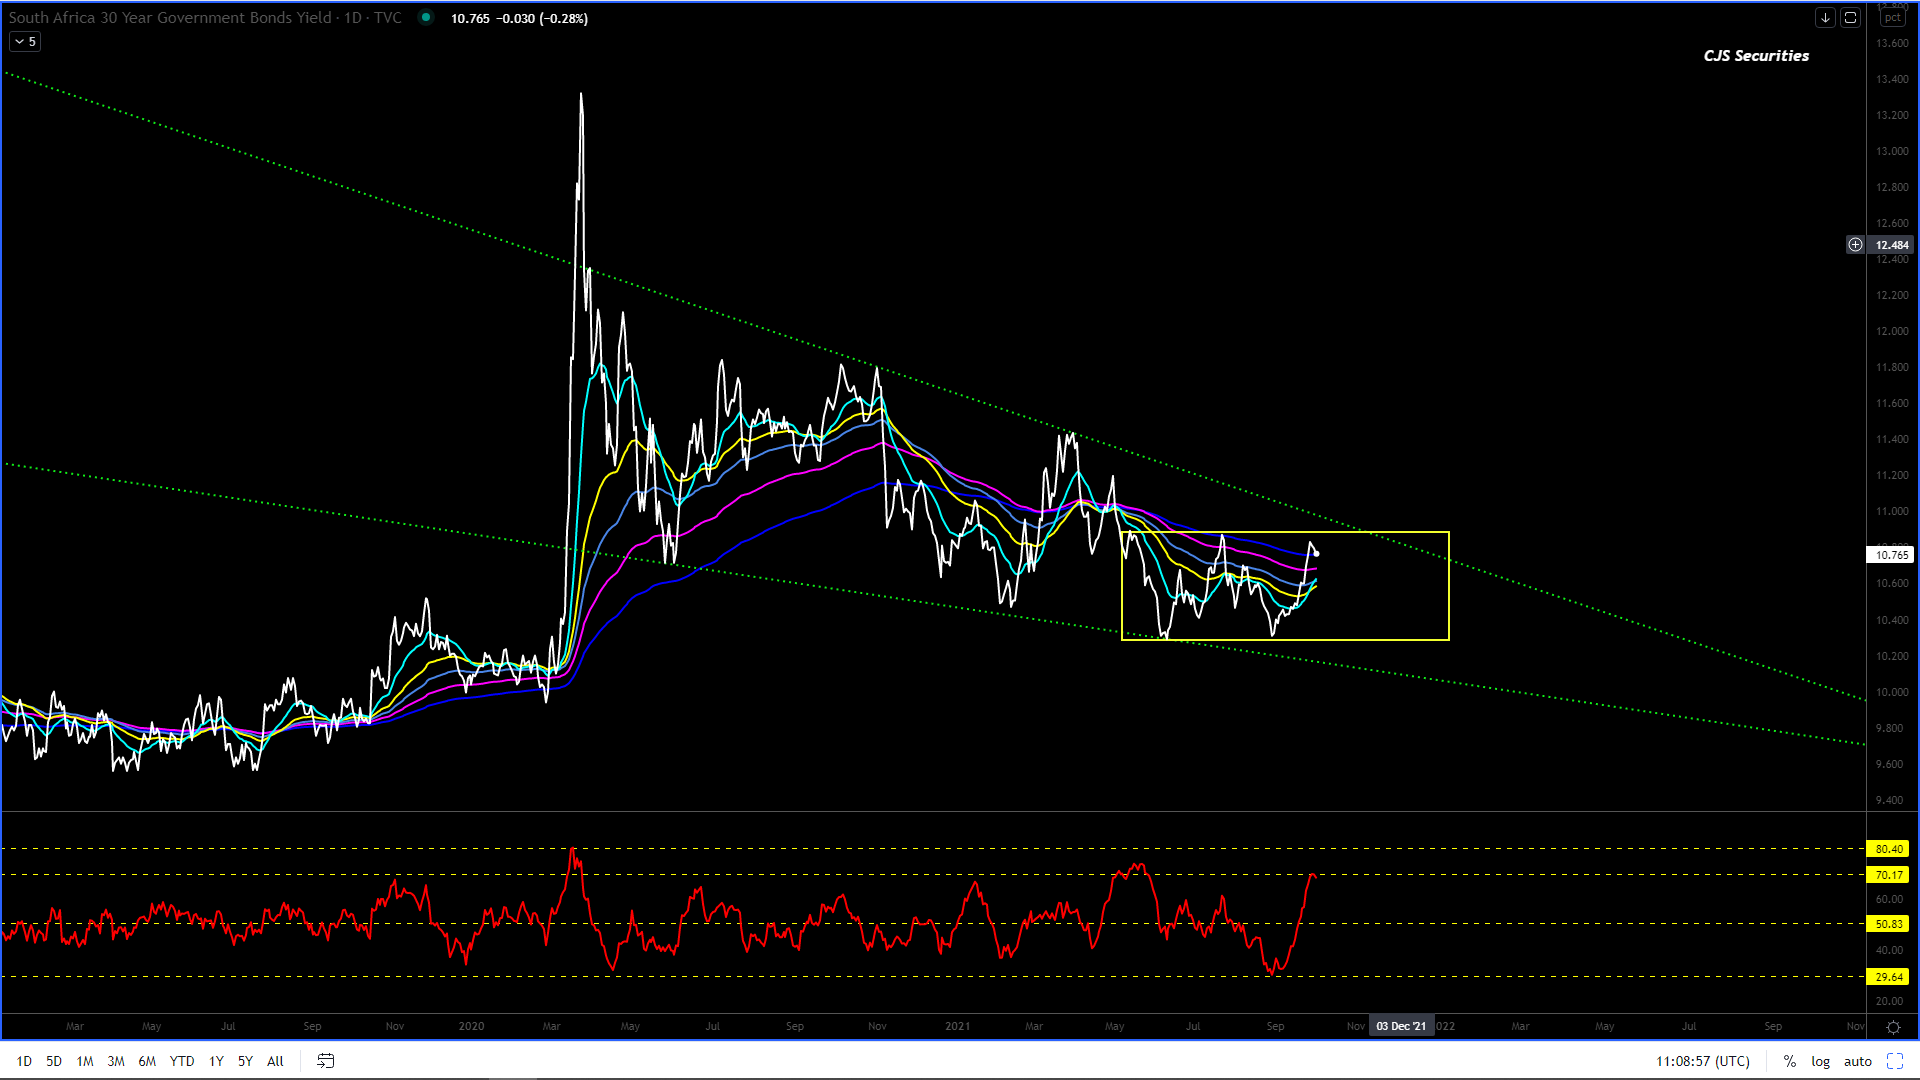
SA Government Bond 30 Year Yield Daily Close
#No Change in Commentary
With 10.30% hold beautifully, the chart has a nice rounding bottom and we could potentially look at targeting the 11.40% level.
The current formation has more than two potential outcomes and hence we are keen to stay out until we have a better view.
As predicted, the chart printing 10.90% has played out nicely and with this chart trading higher than expected, the downside at 10.30% should remain very solid.
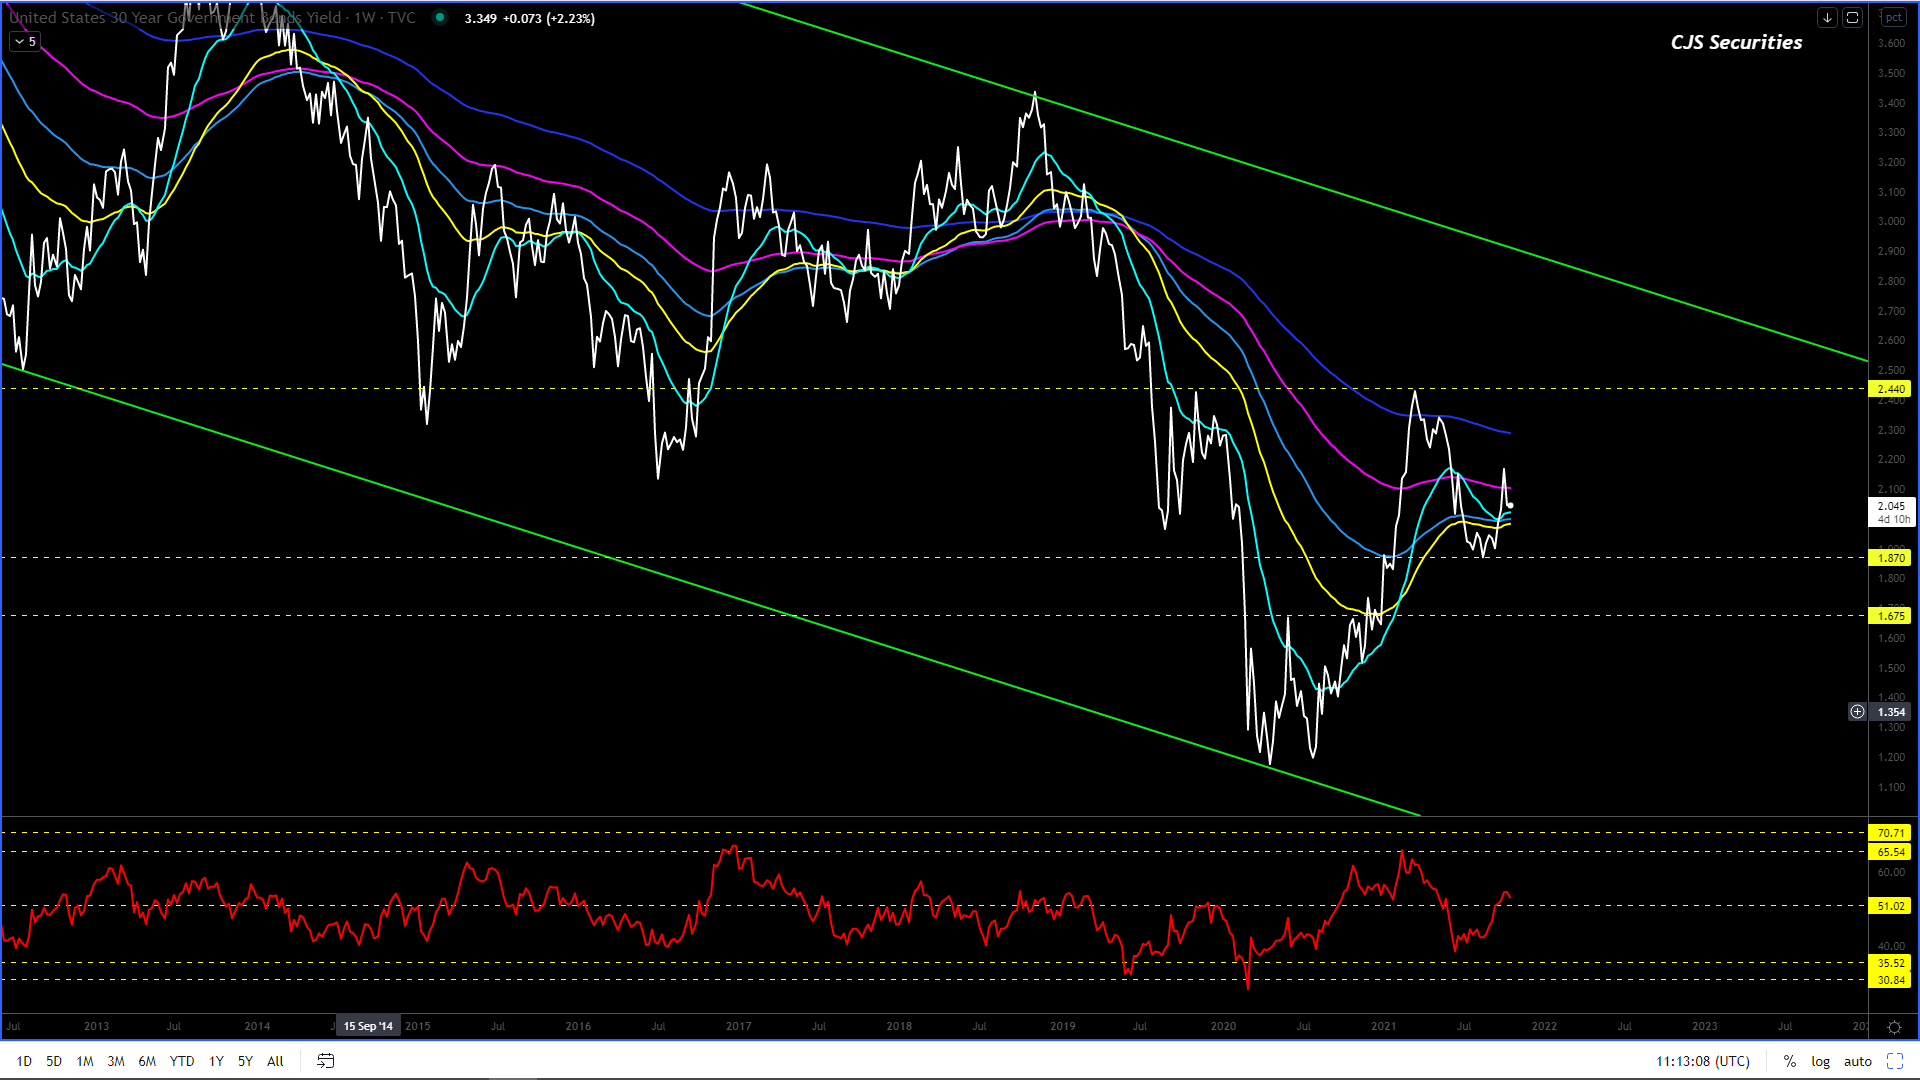
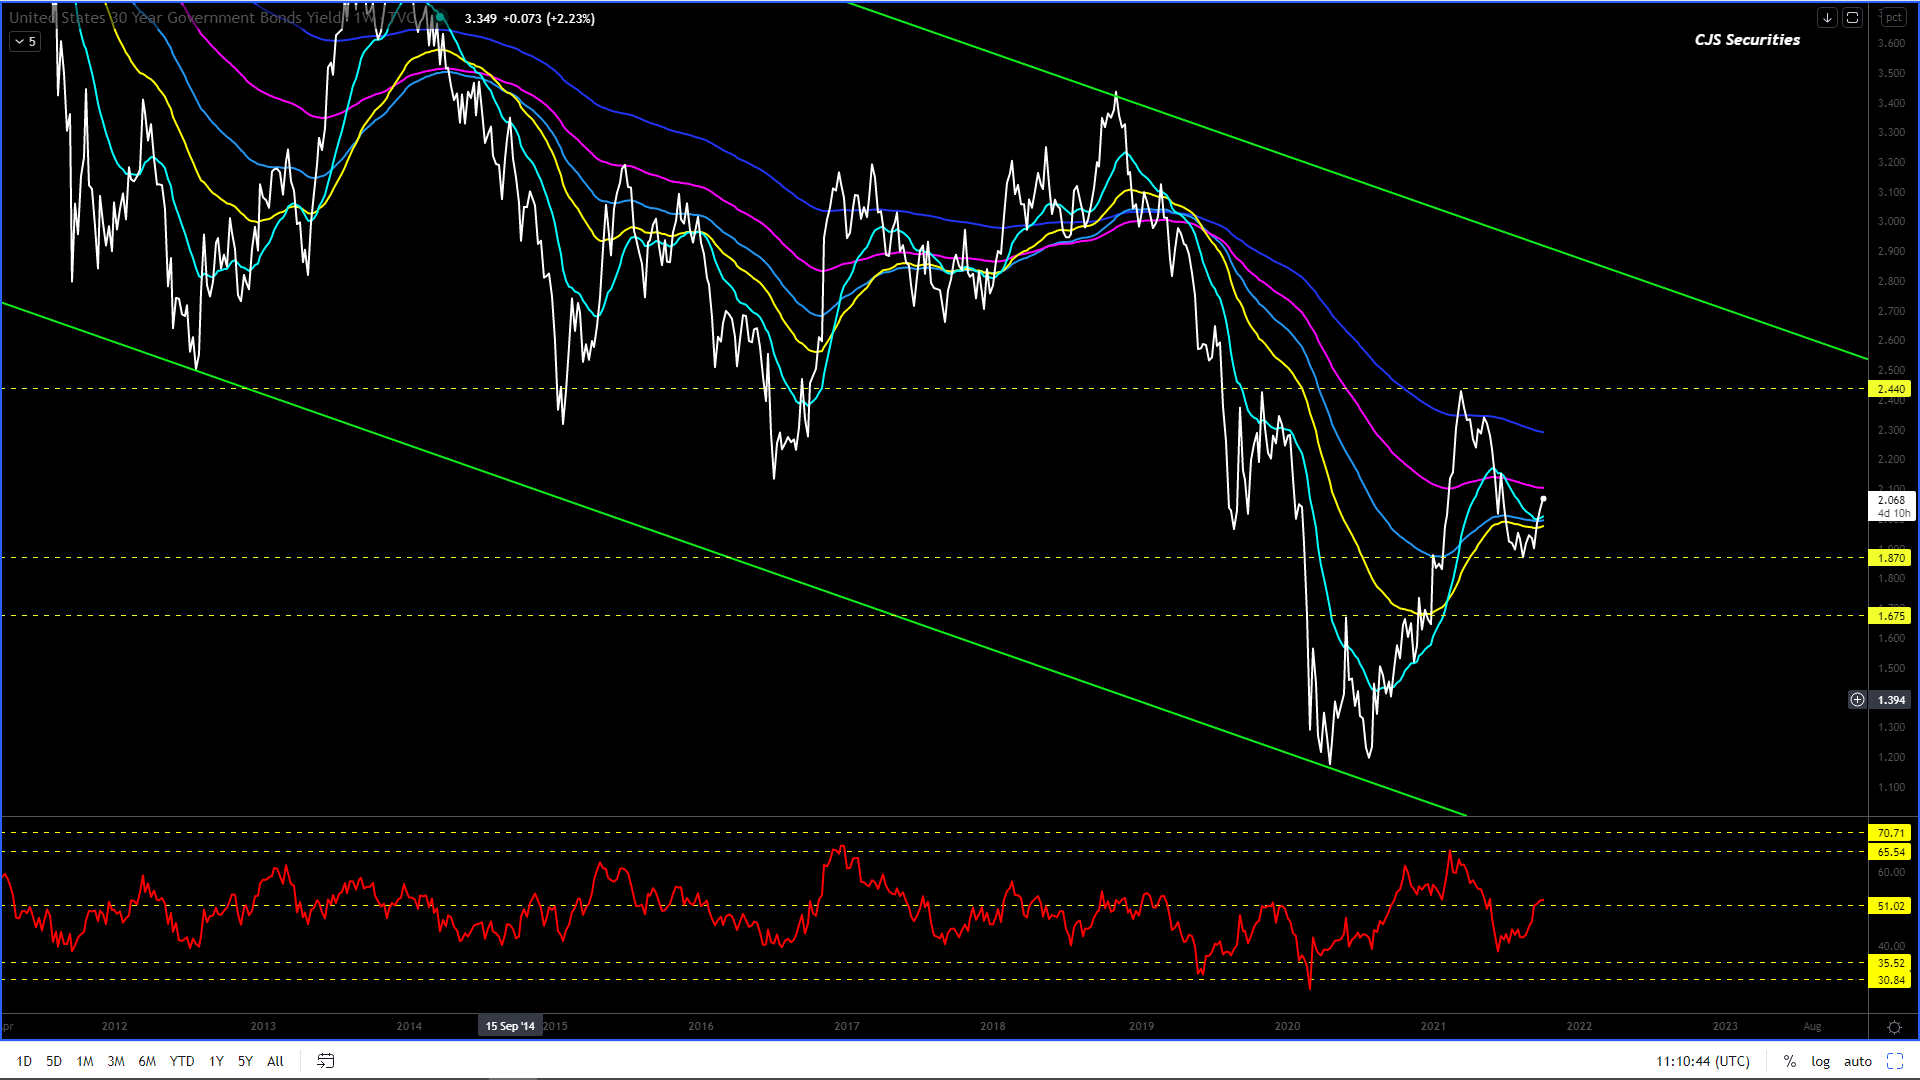
US Government Bond 30 Year Yield Weekly Close
#No Change in Commentary
I would look at buying a move back to 1.90% – 1.80%that will have upside targets from 2.58% – 2.71%.
Use an SL under 1.70%.
Please note that only a weekly close of over 3.50% will confirm that the trend has been broken.
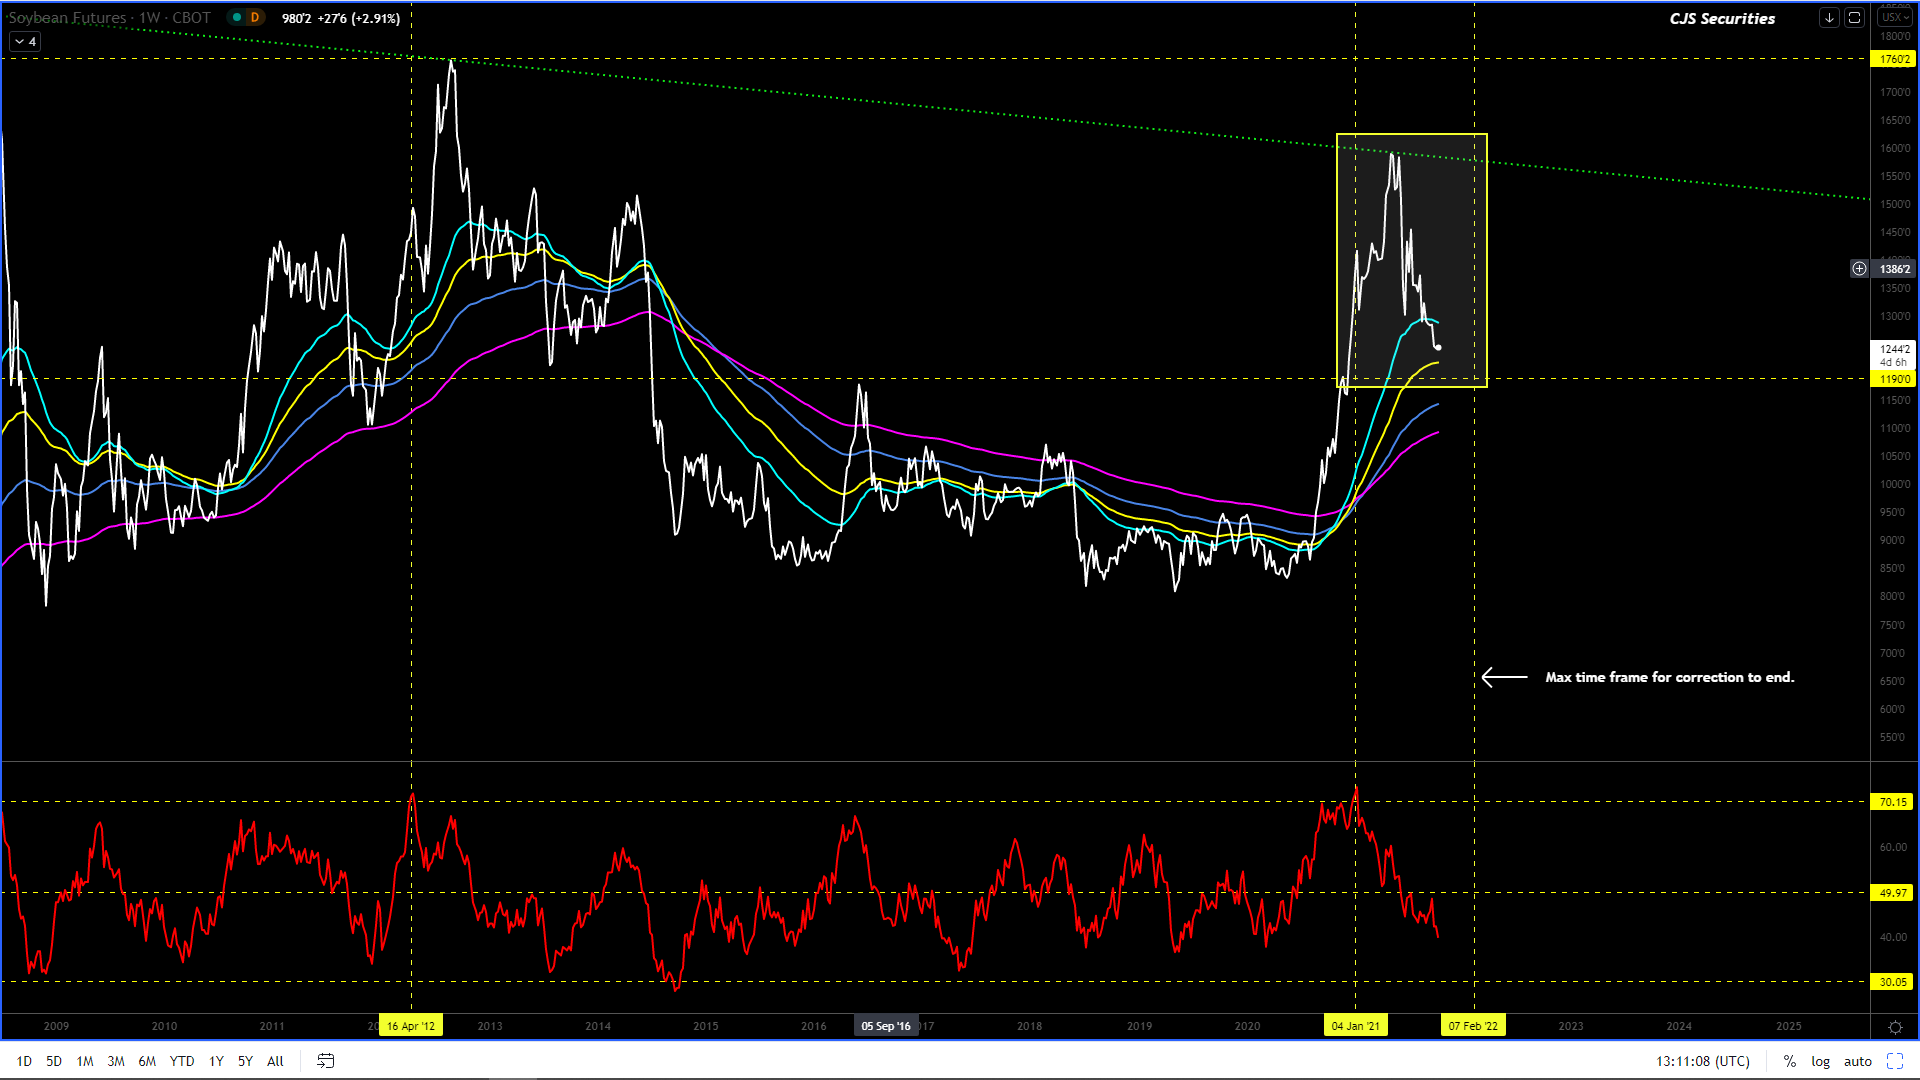
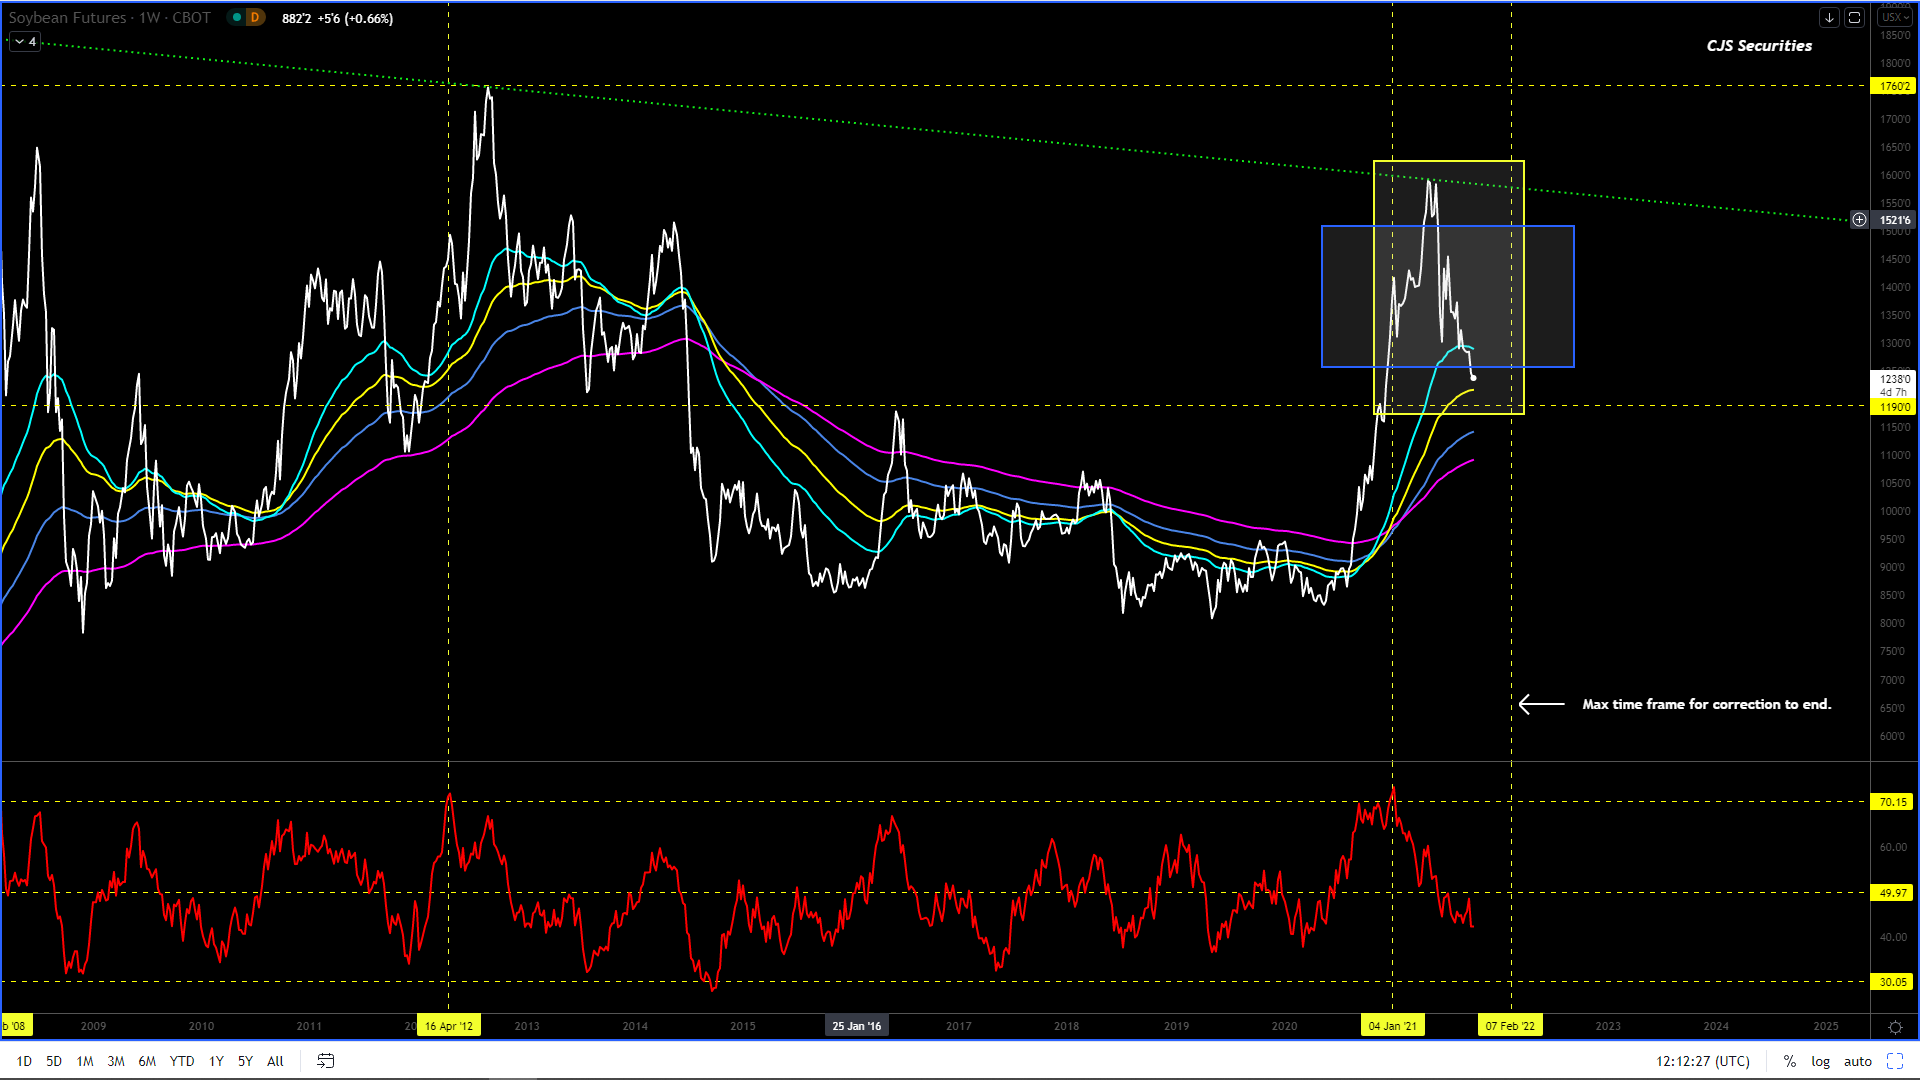
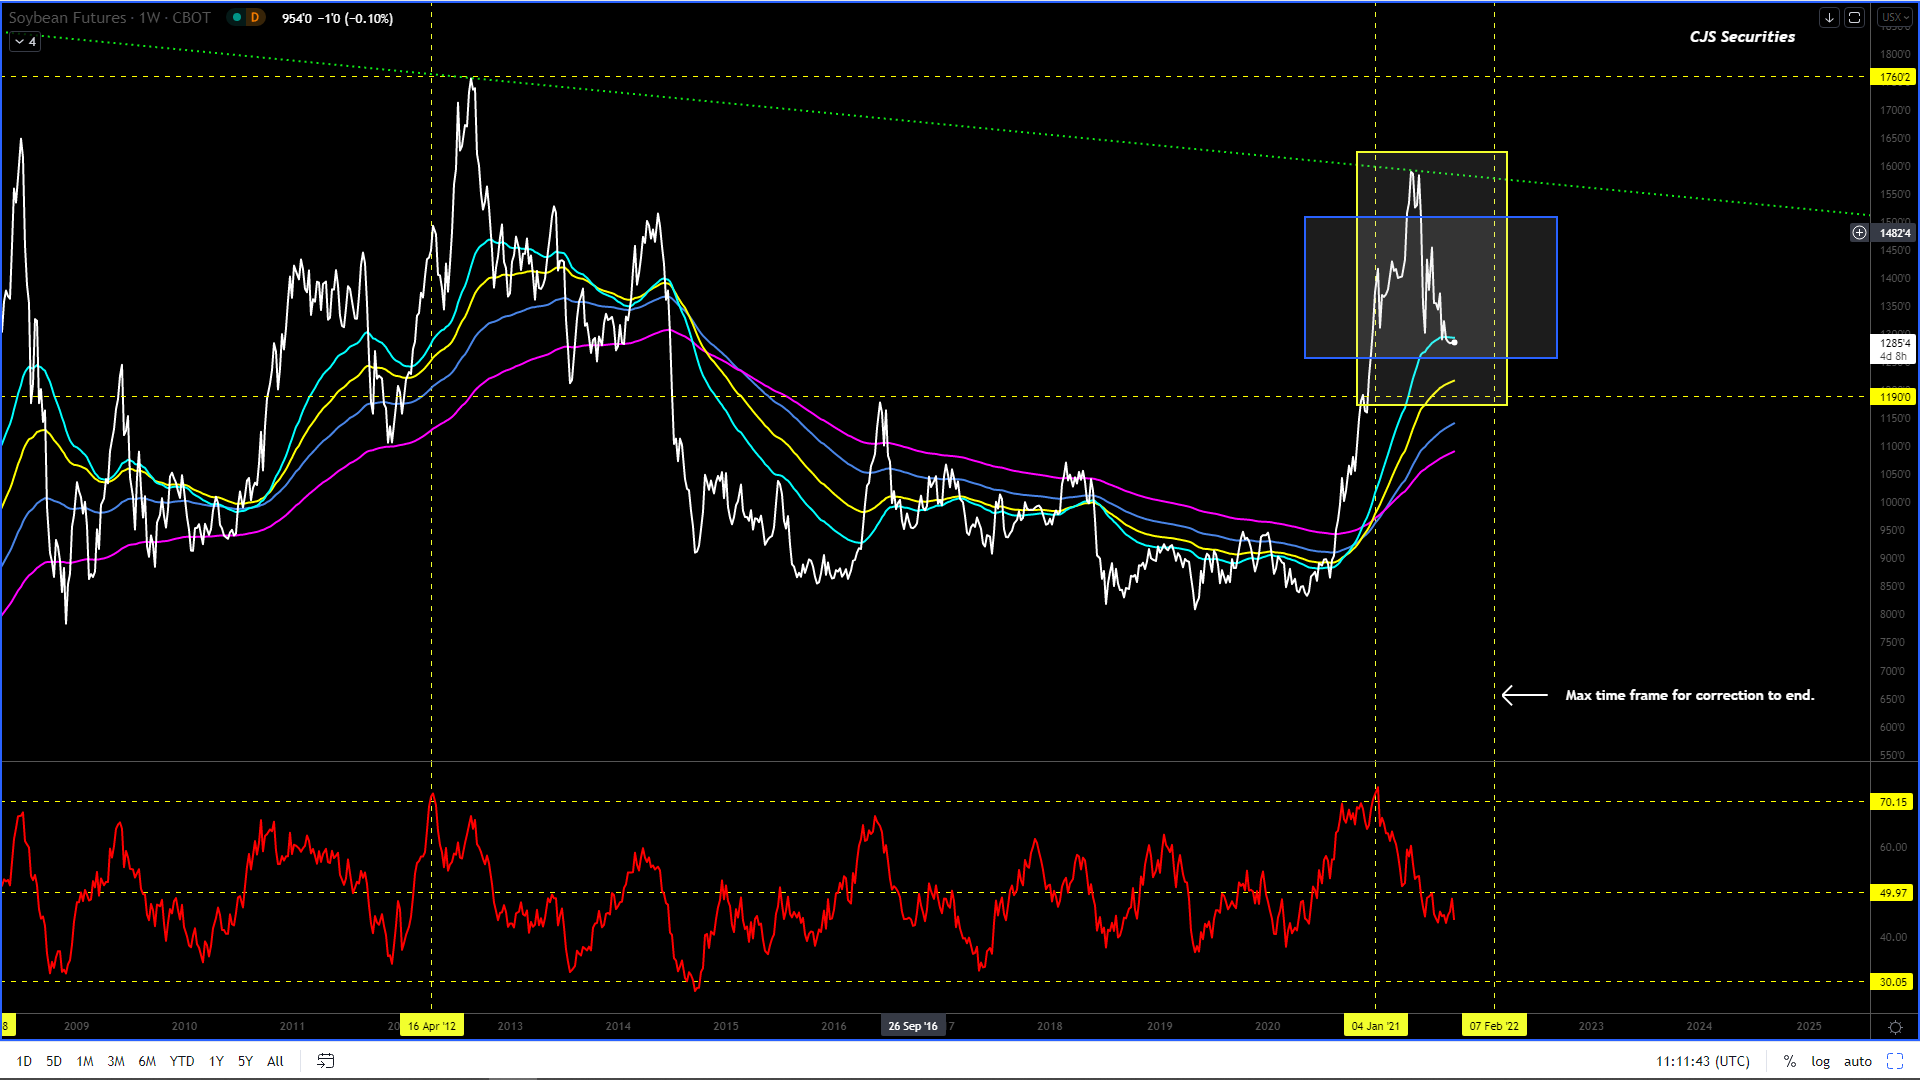
This chart needs some more downside IMO, before we can buy with confidence as the correction remains far from over and could last for another few weeks.
One should use the volatility to play the ranges with a bias to building a decent long sub $12.00!
My new downside target is sub $12.00 and potentially $11.70, this would be a massive MT buying opportunity to say the least.
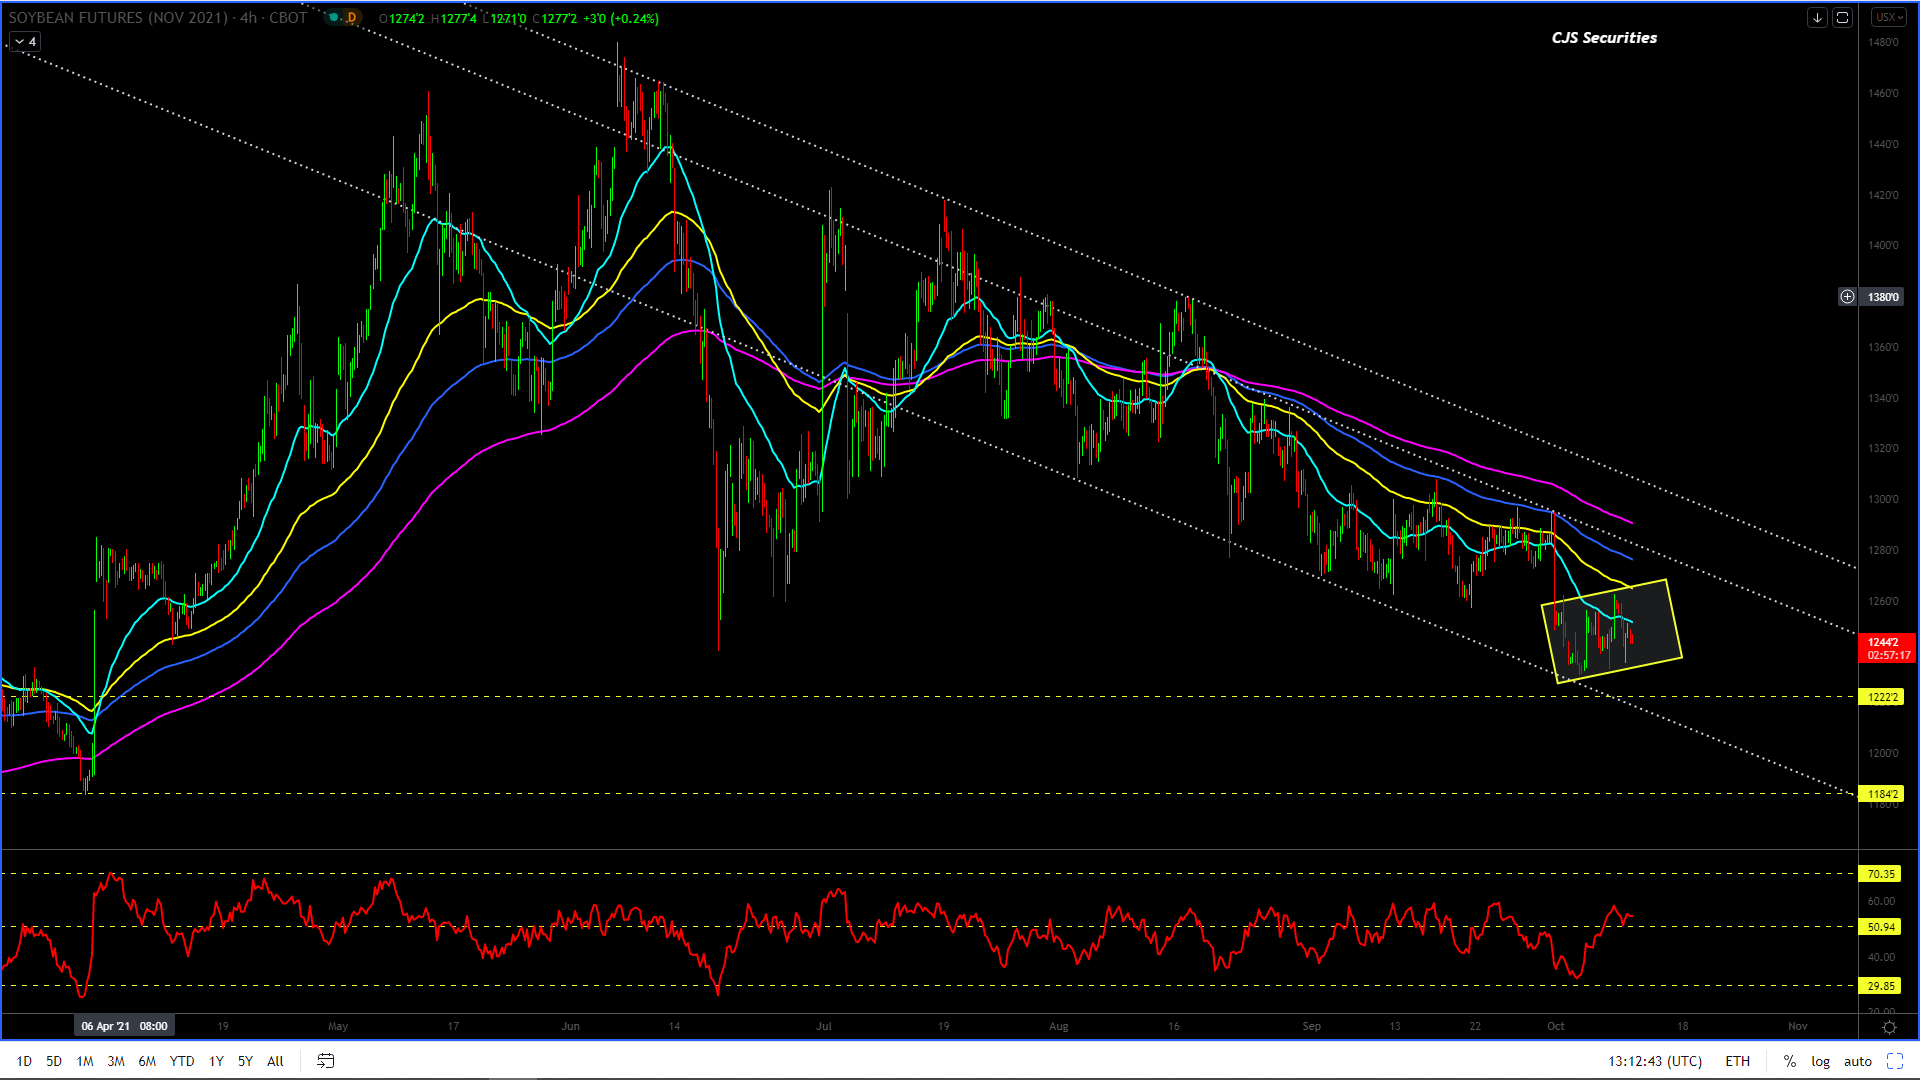
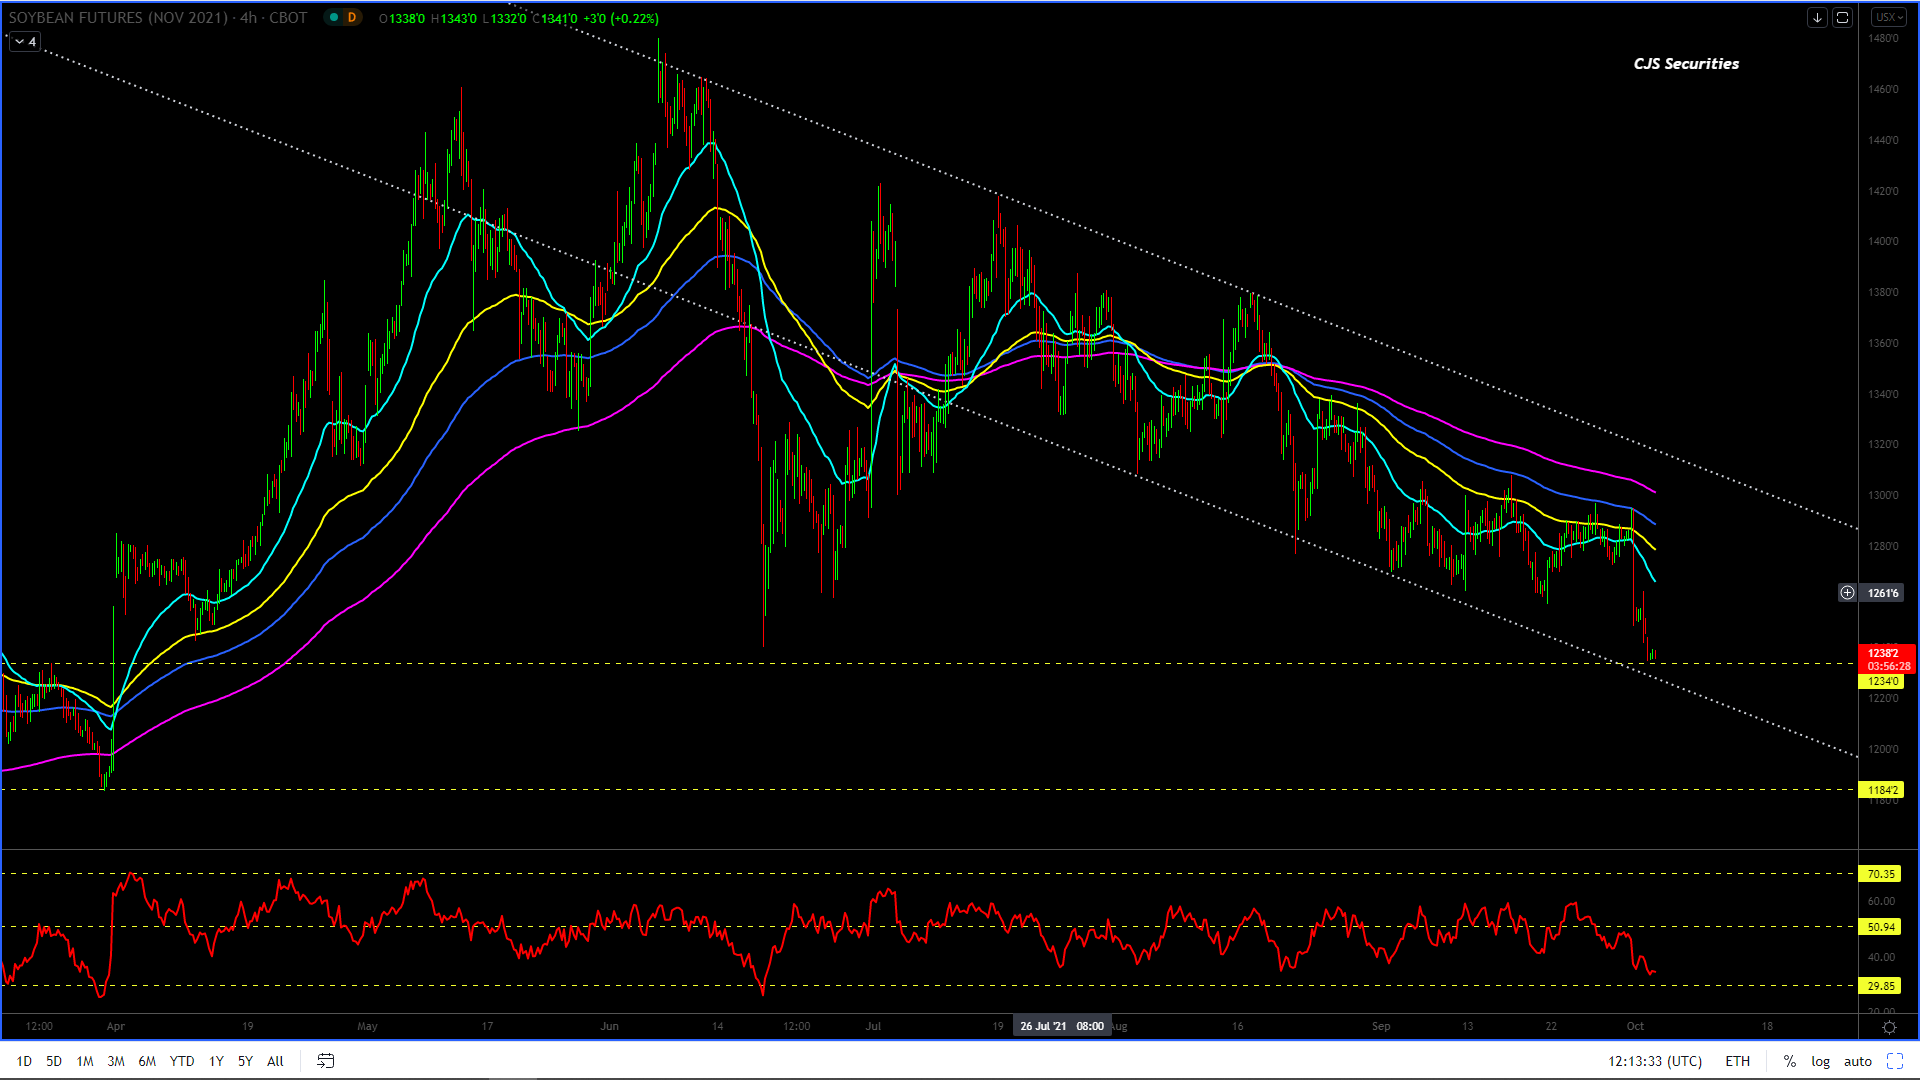
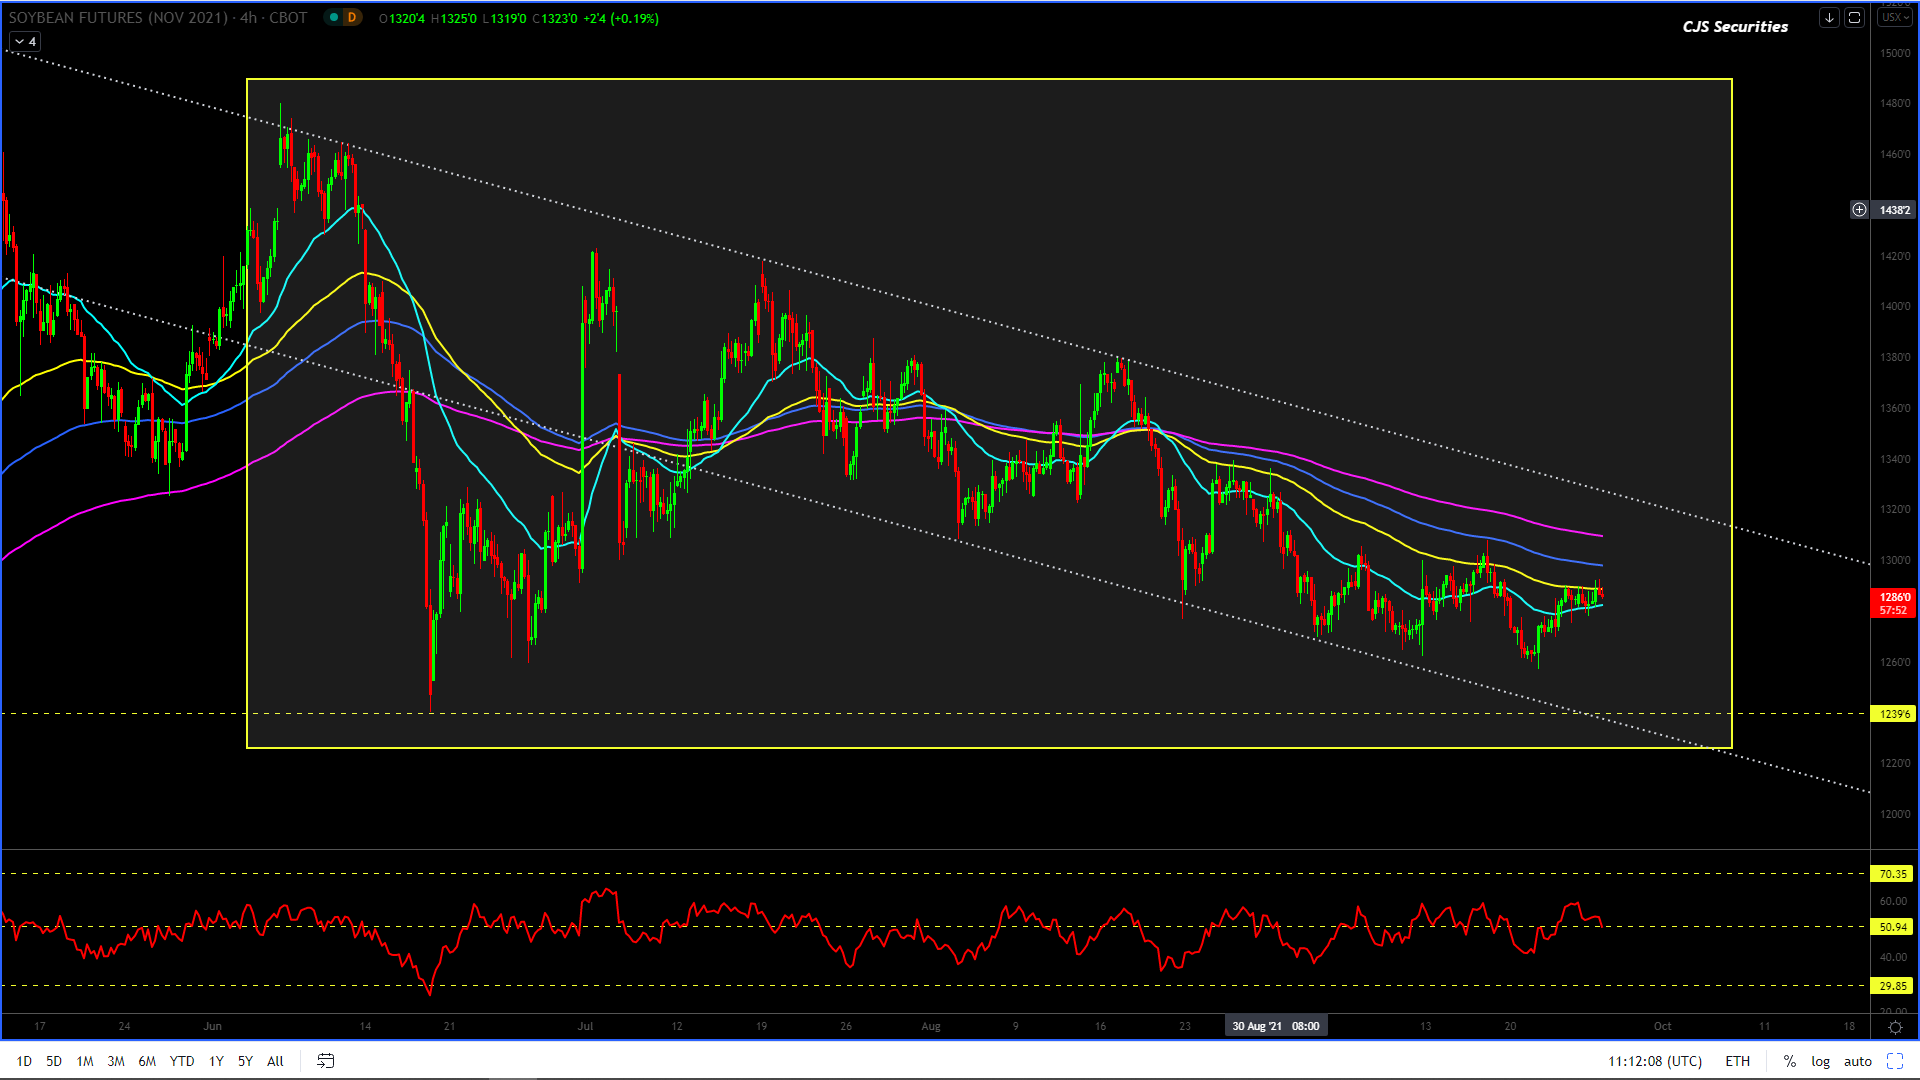
240 Min CBOT November 21 Soybean Candle Chart
The overall formation is bearish, as we now have a lovely consolidation waiting to burst lower.
I would sell any hard rally as we could see a sub $12.00 move in the coming weeks, but note that sub $12.00 I would want to own it all week long and twice on a Sunday.
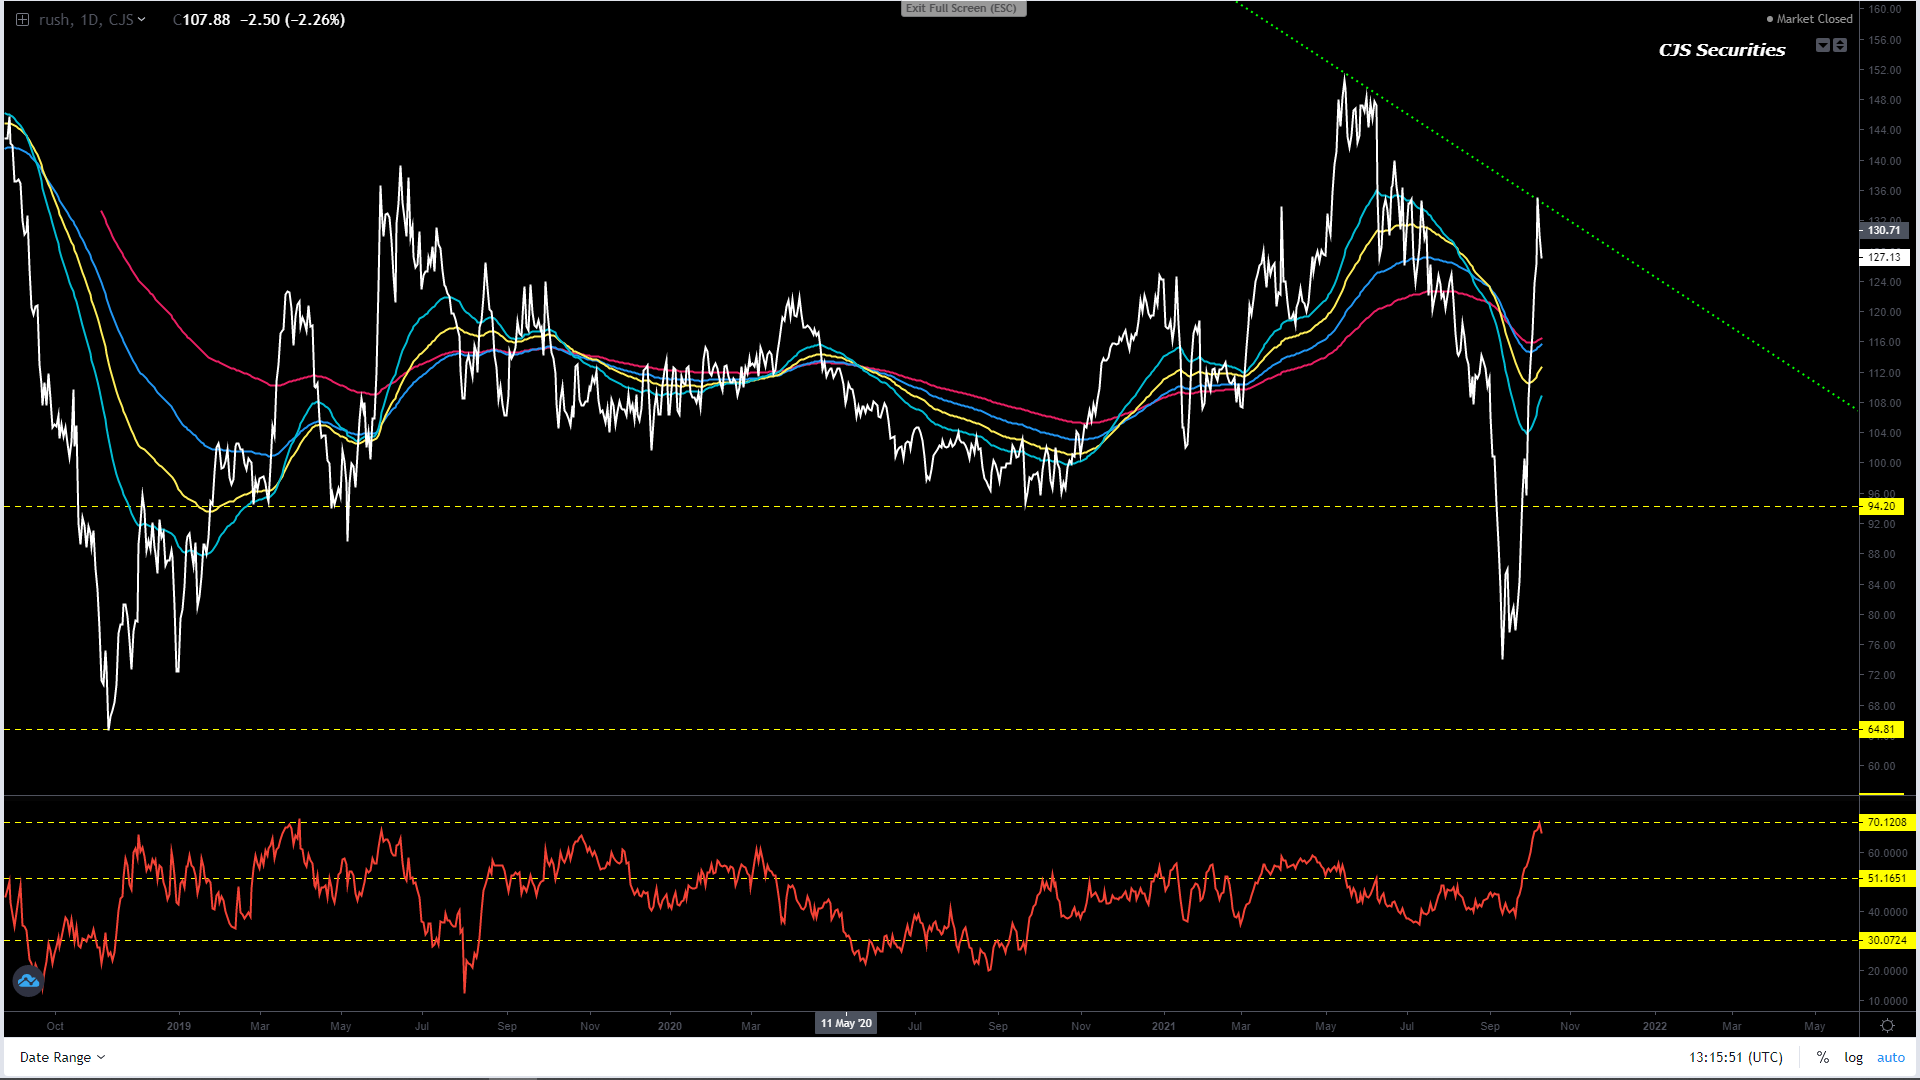
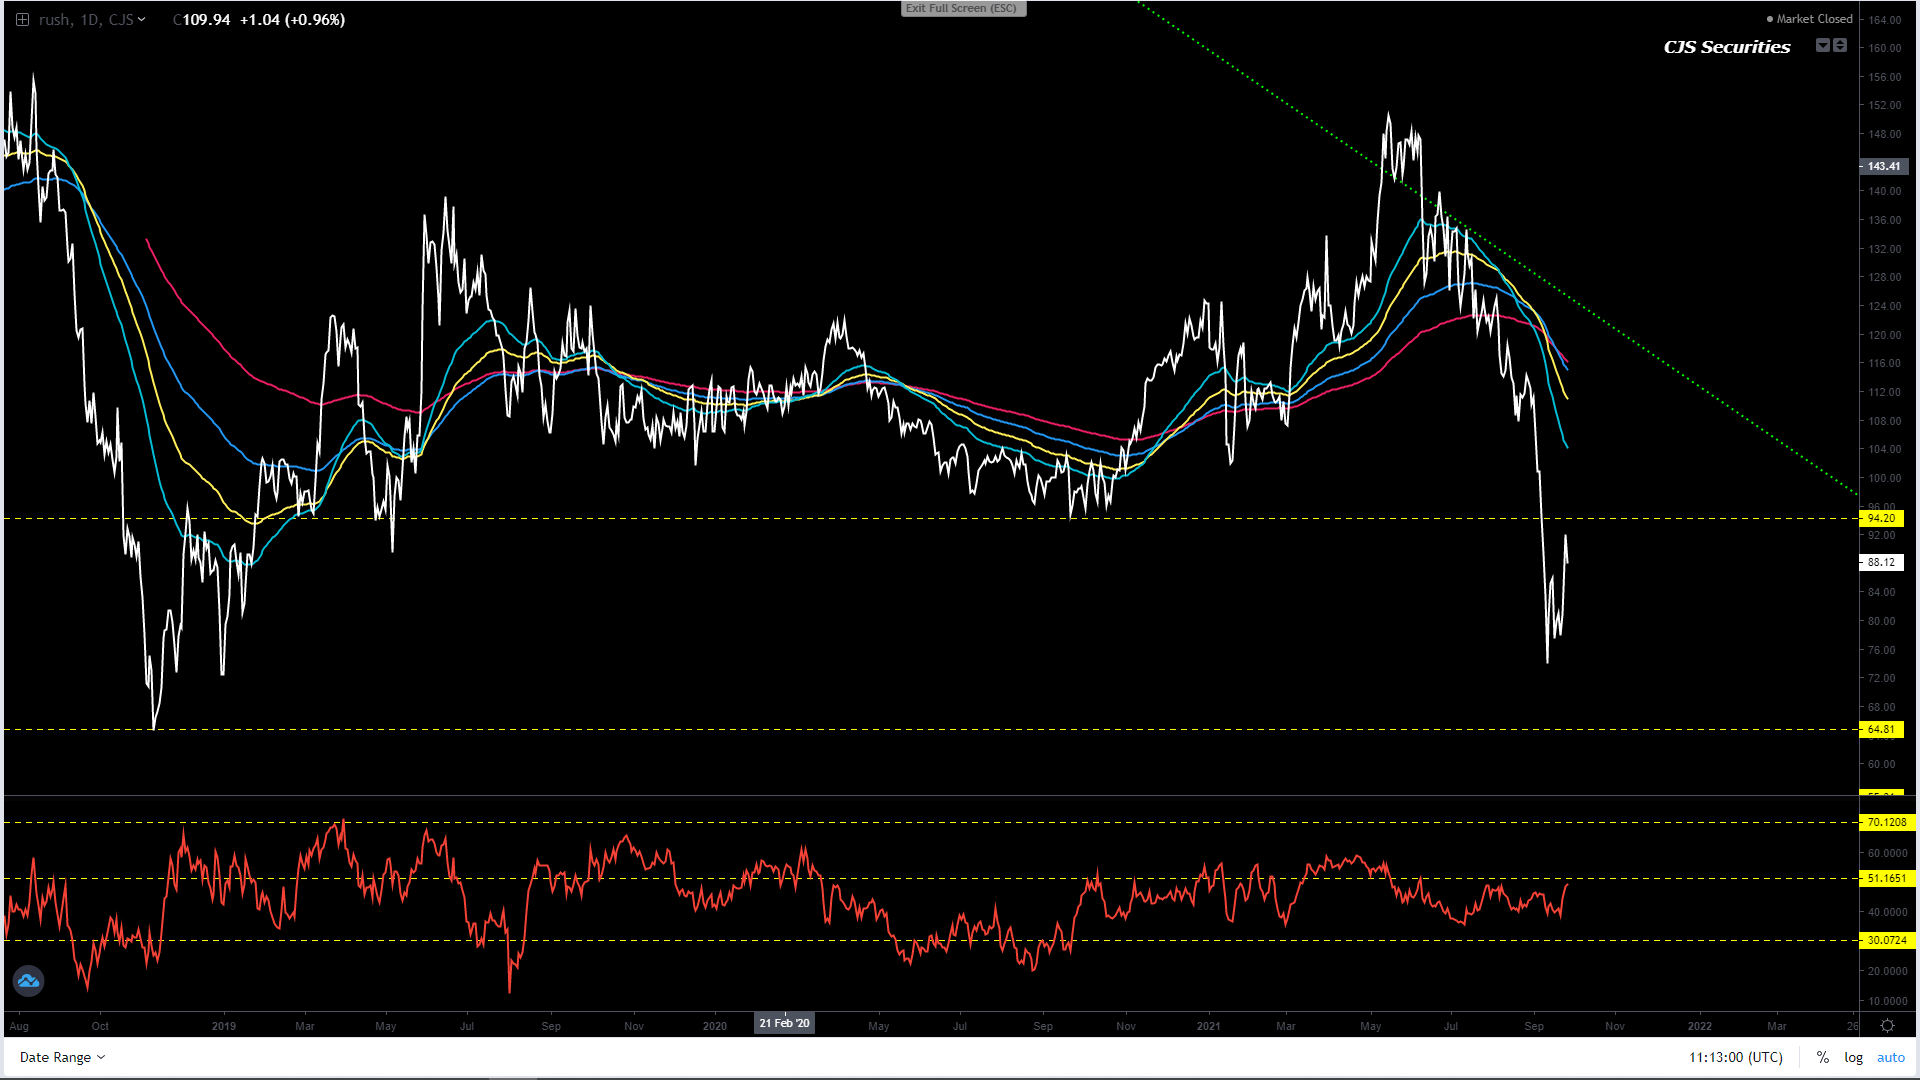
Board Crush Continuous Daily Close
#NO Change in Commentary
This
chart can take you to the cleaners and return your dirty!
I
would stay out until further notice.
The
price action now feels binary!
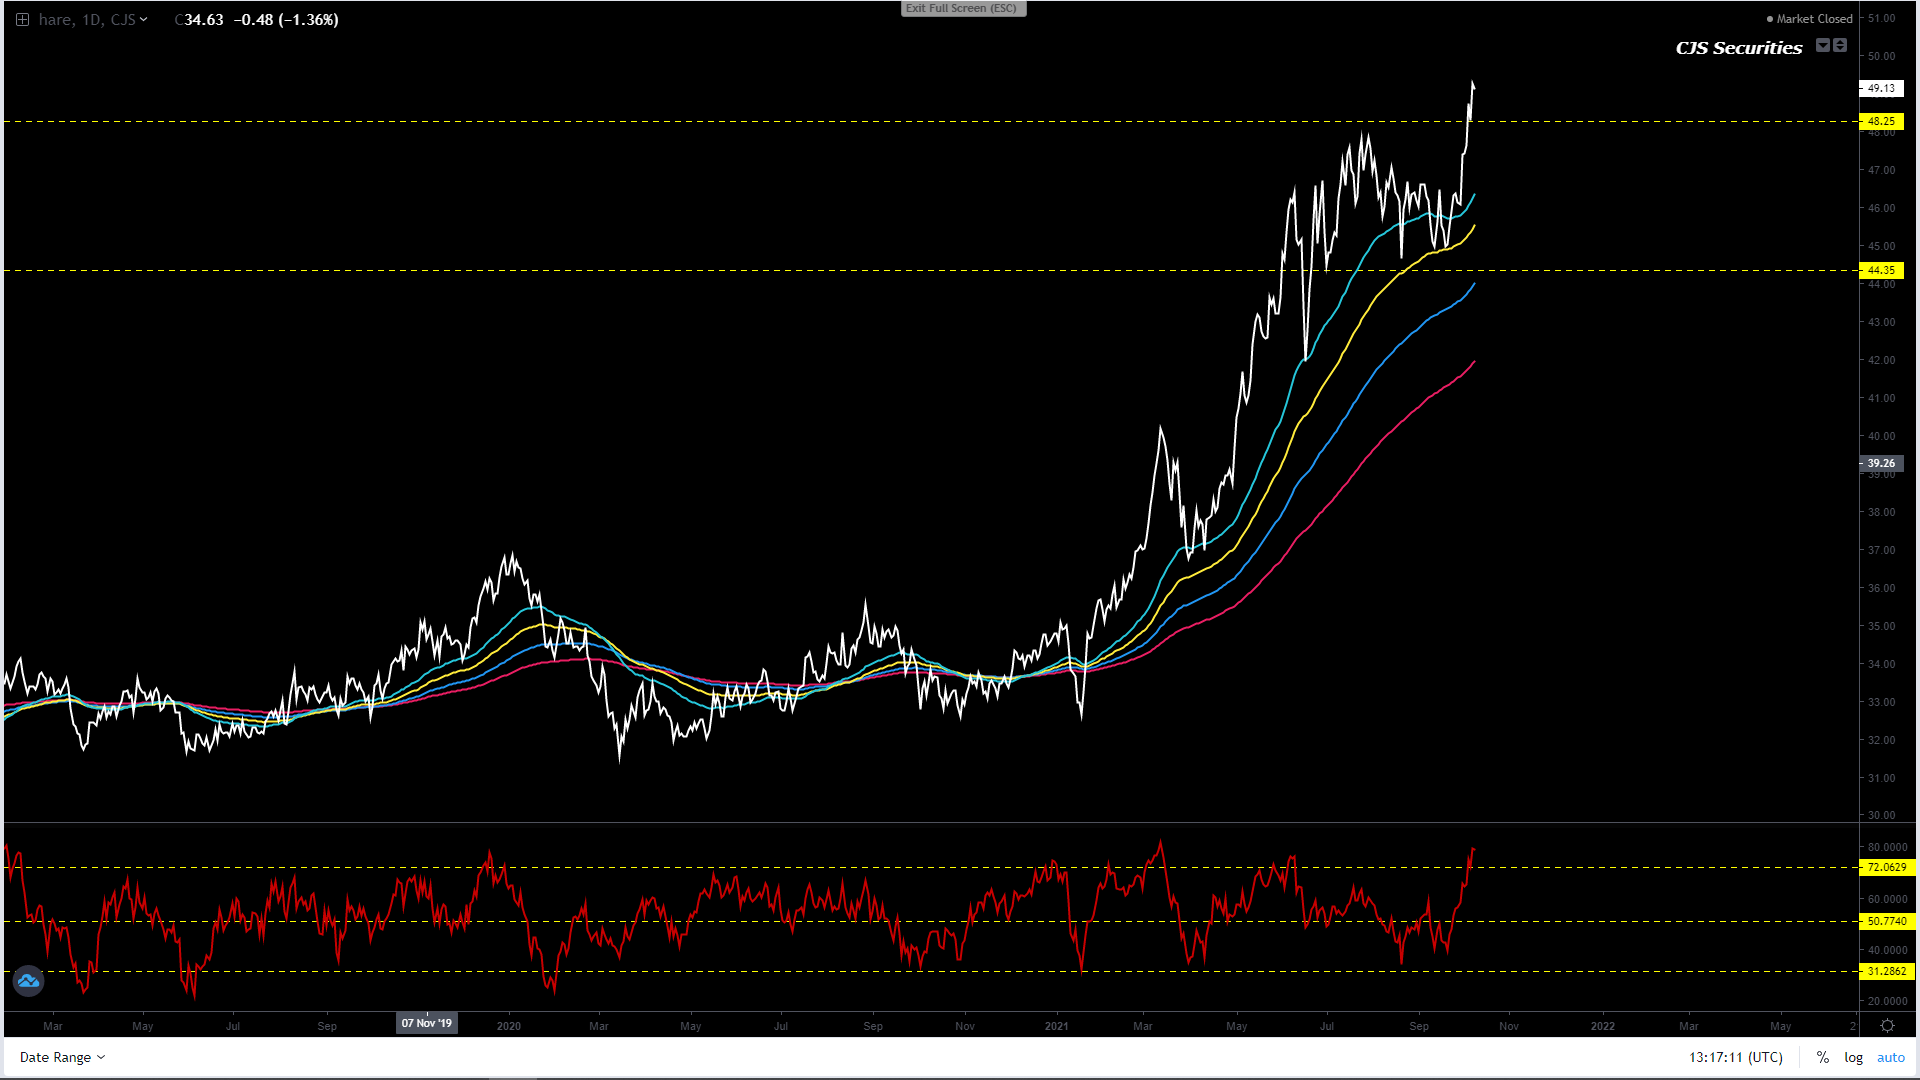
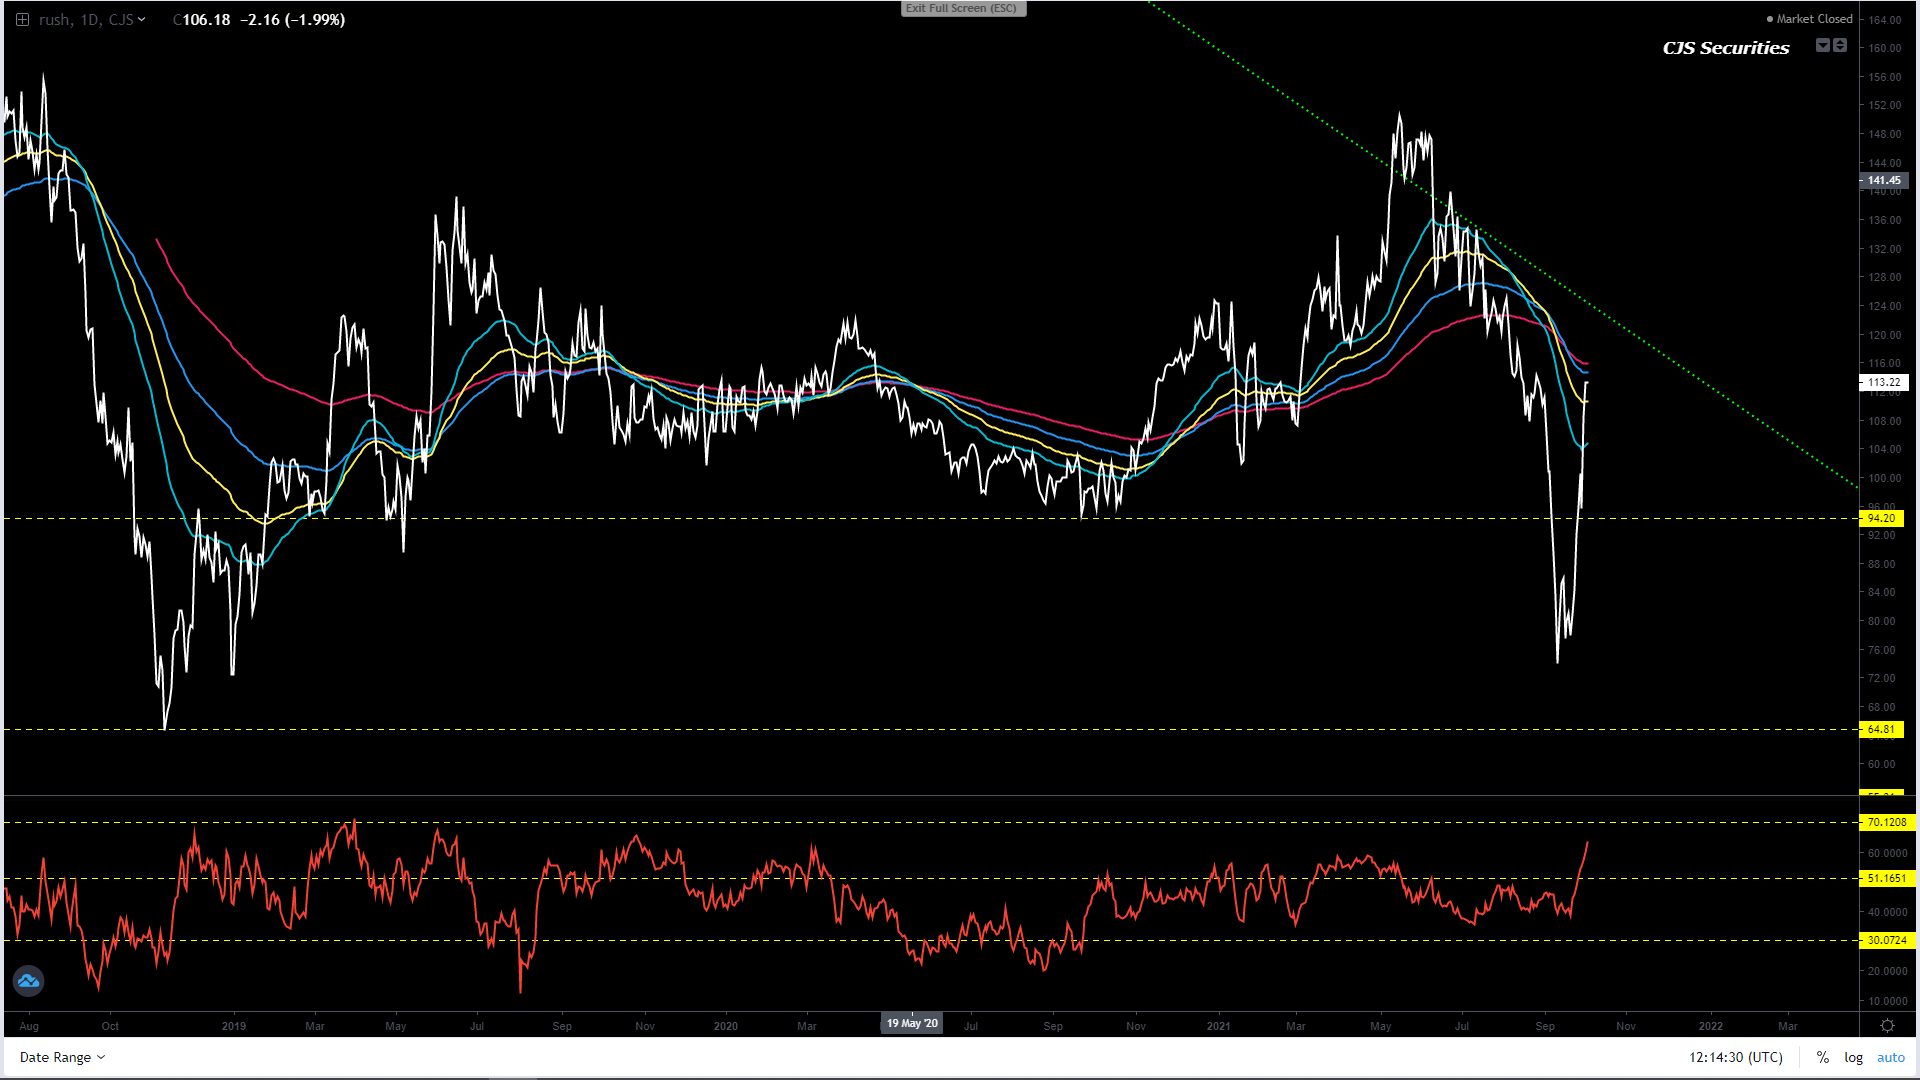
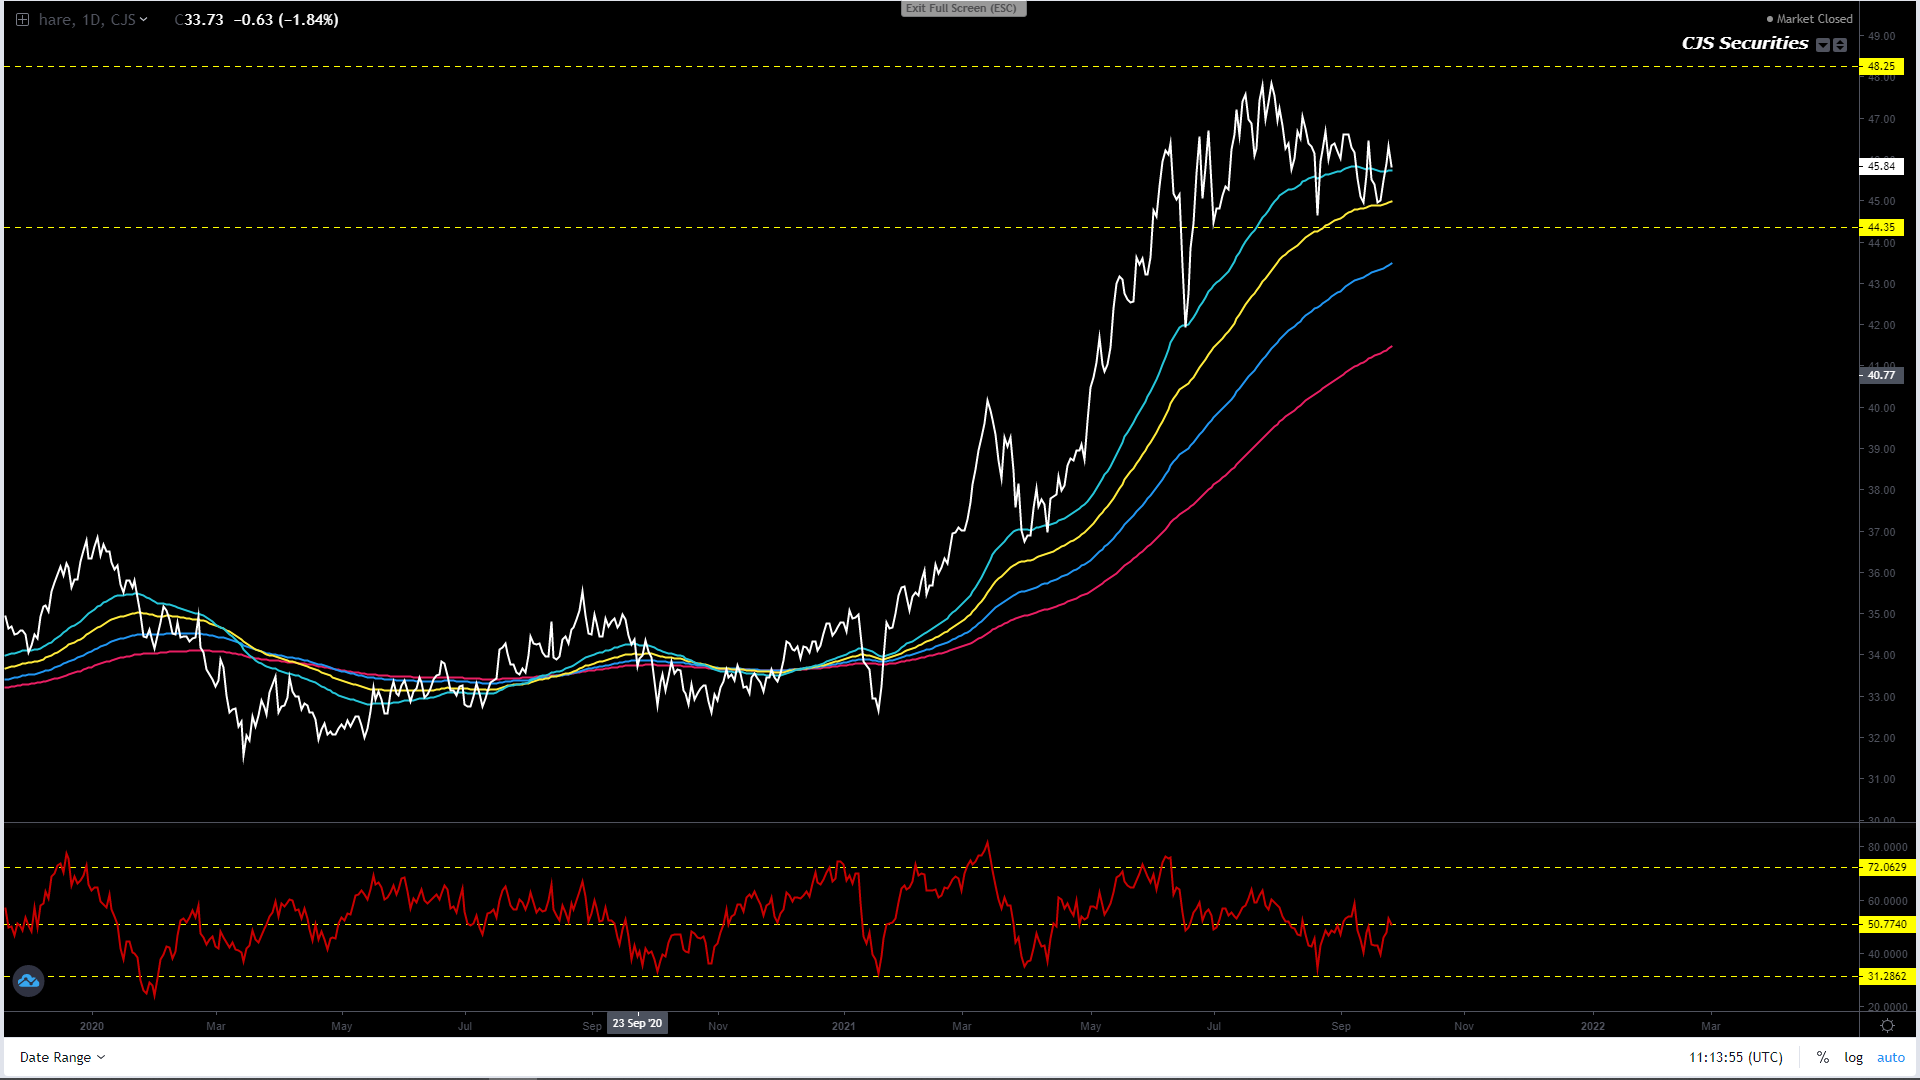
Oil Share Continuous Daily Close
We
have been long and loving it!
Now
that we are supremely in the money all I want to say is, CASH IN and stay out!
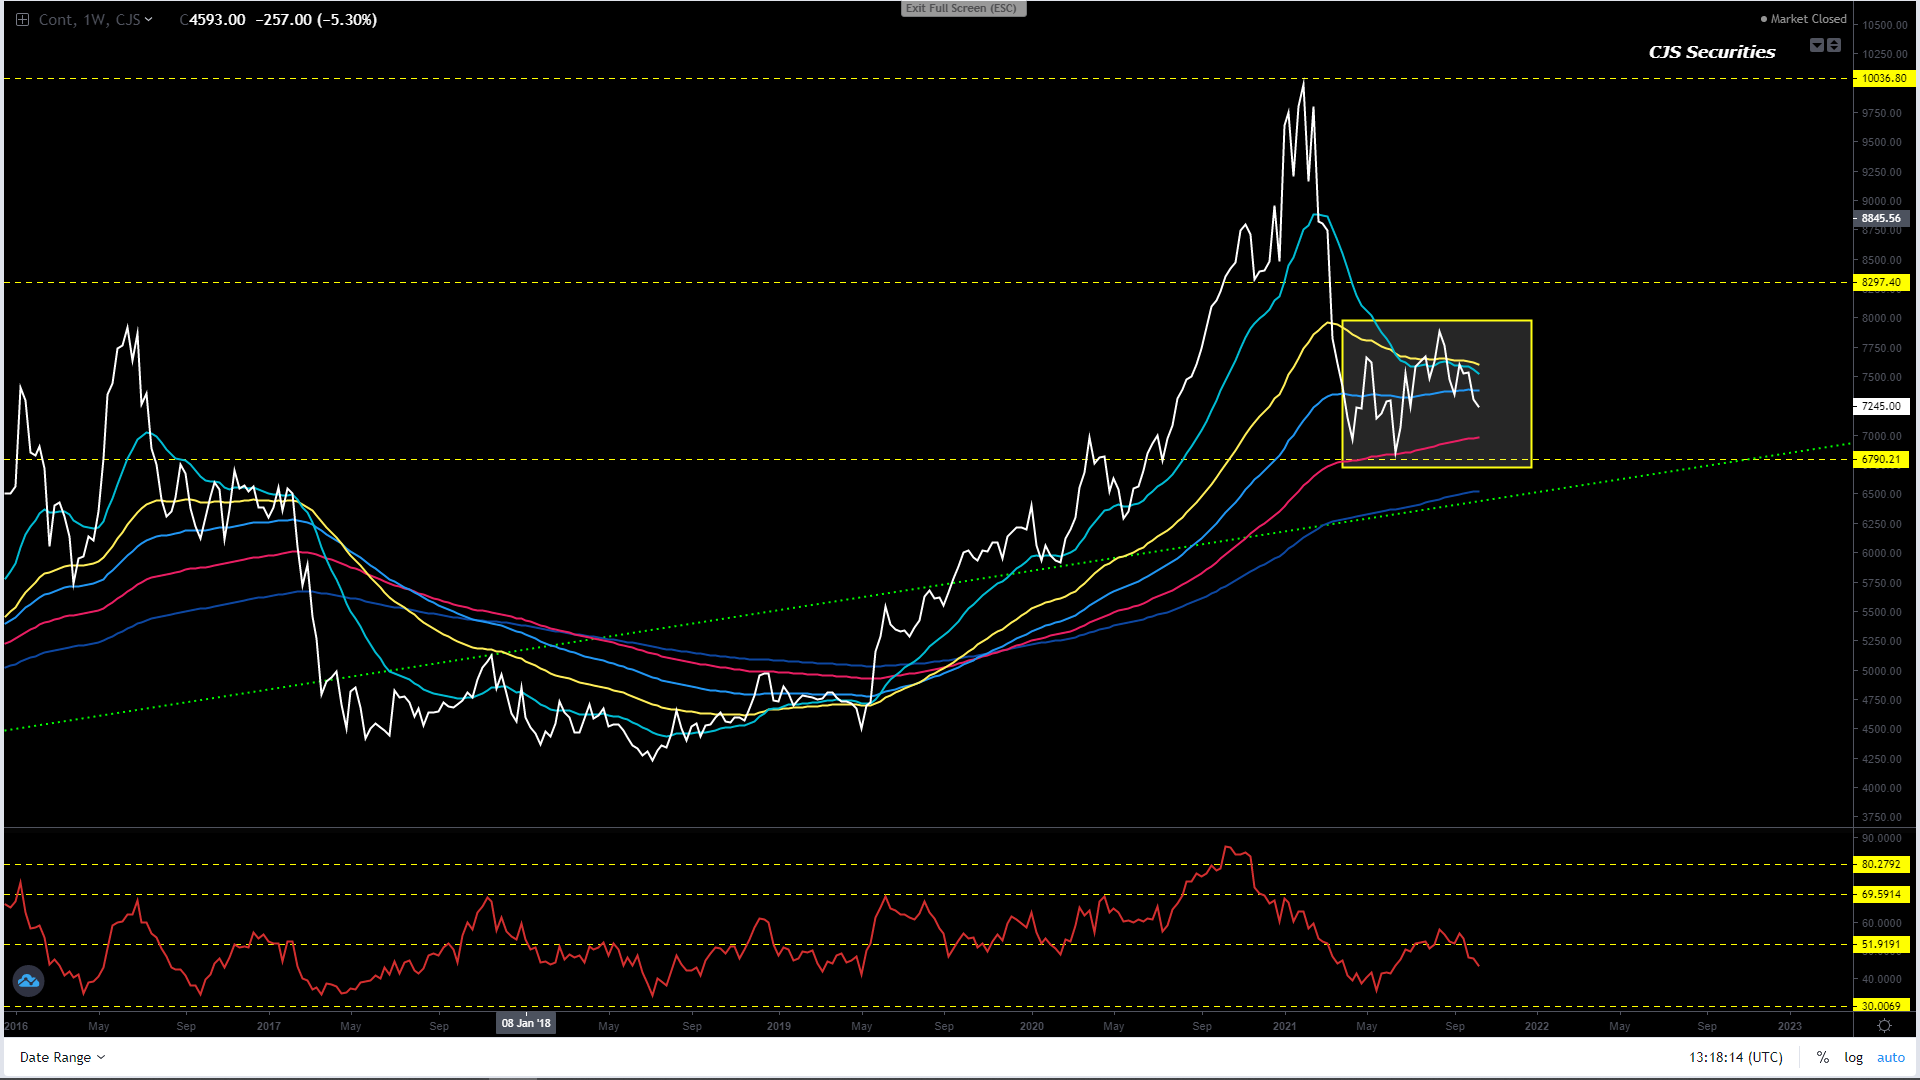
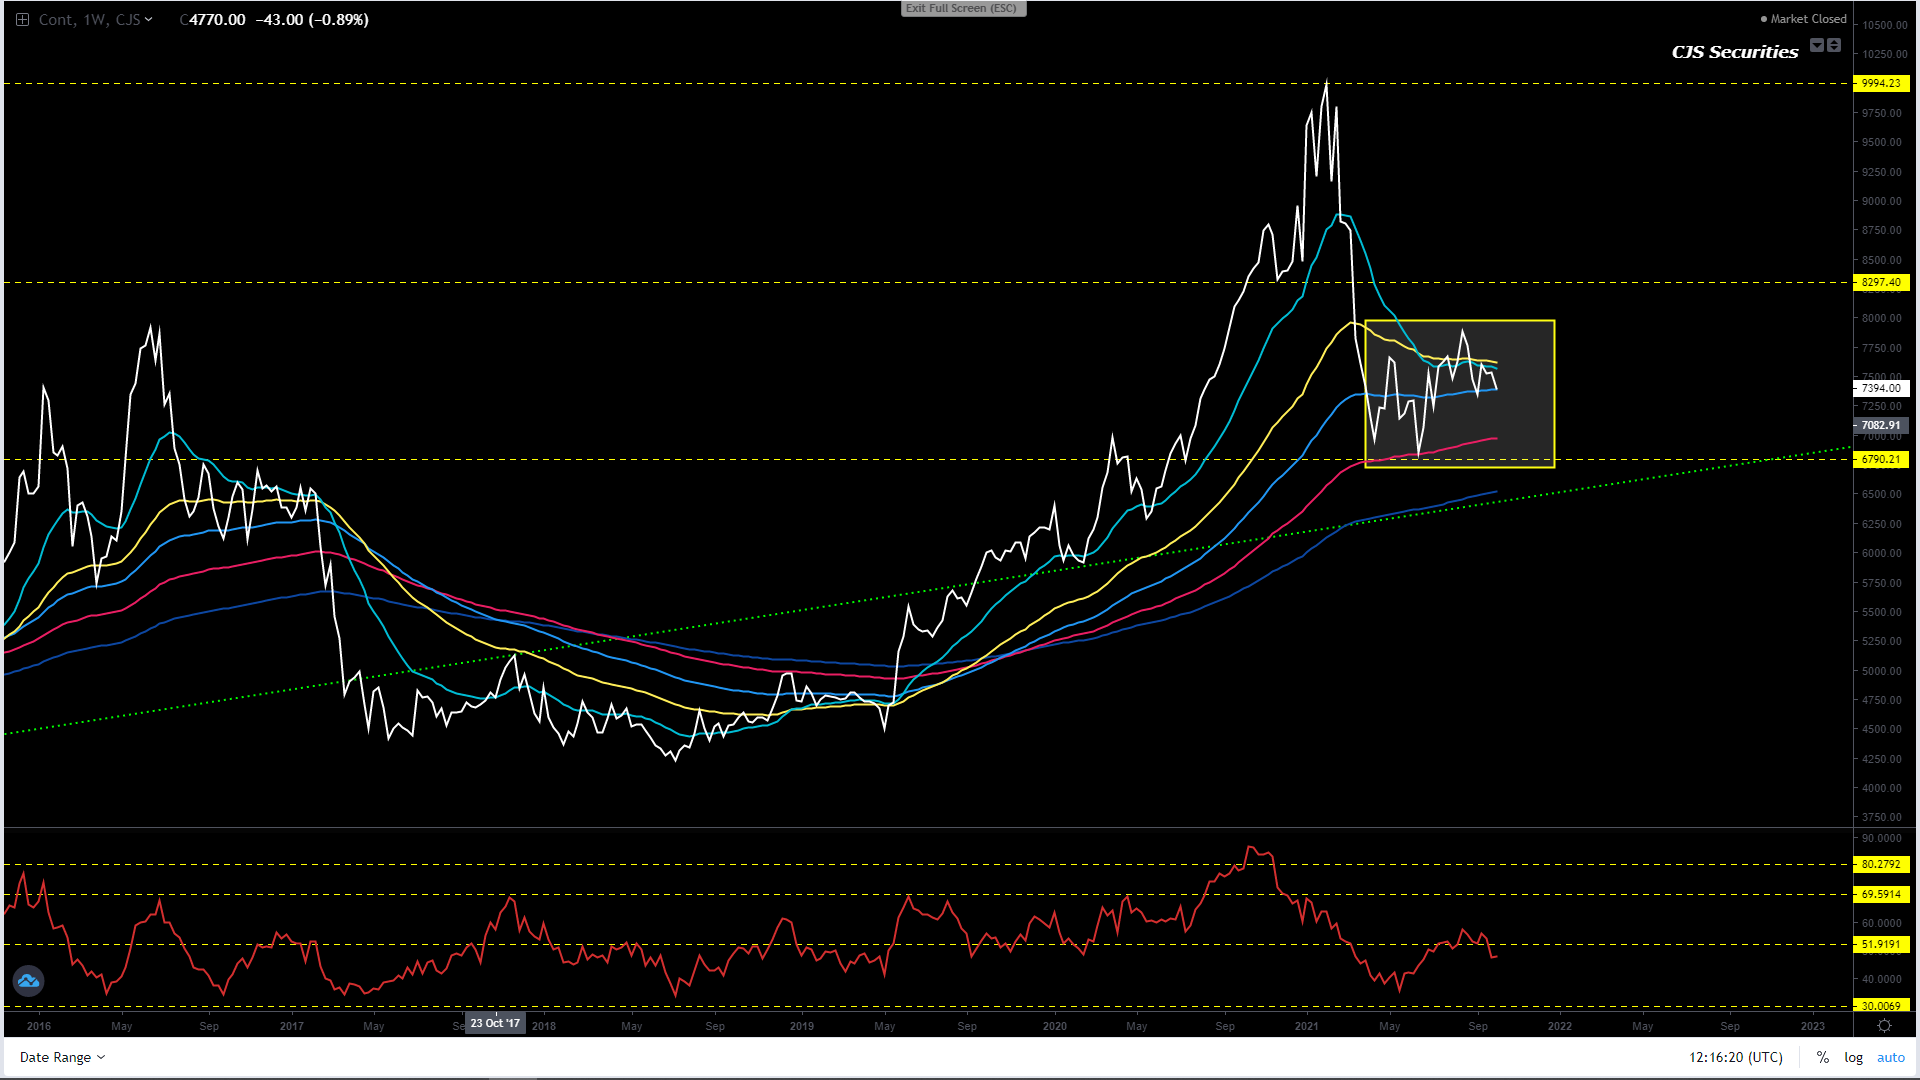
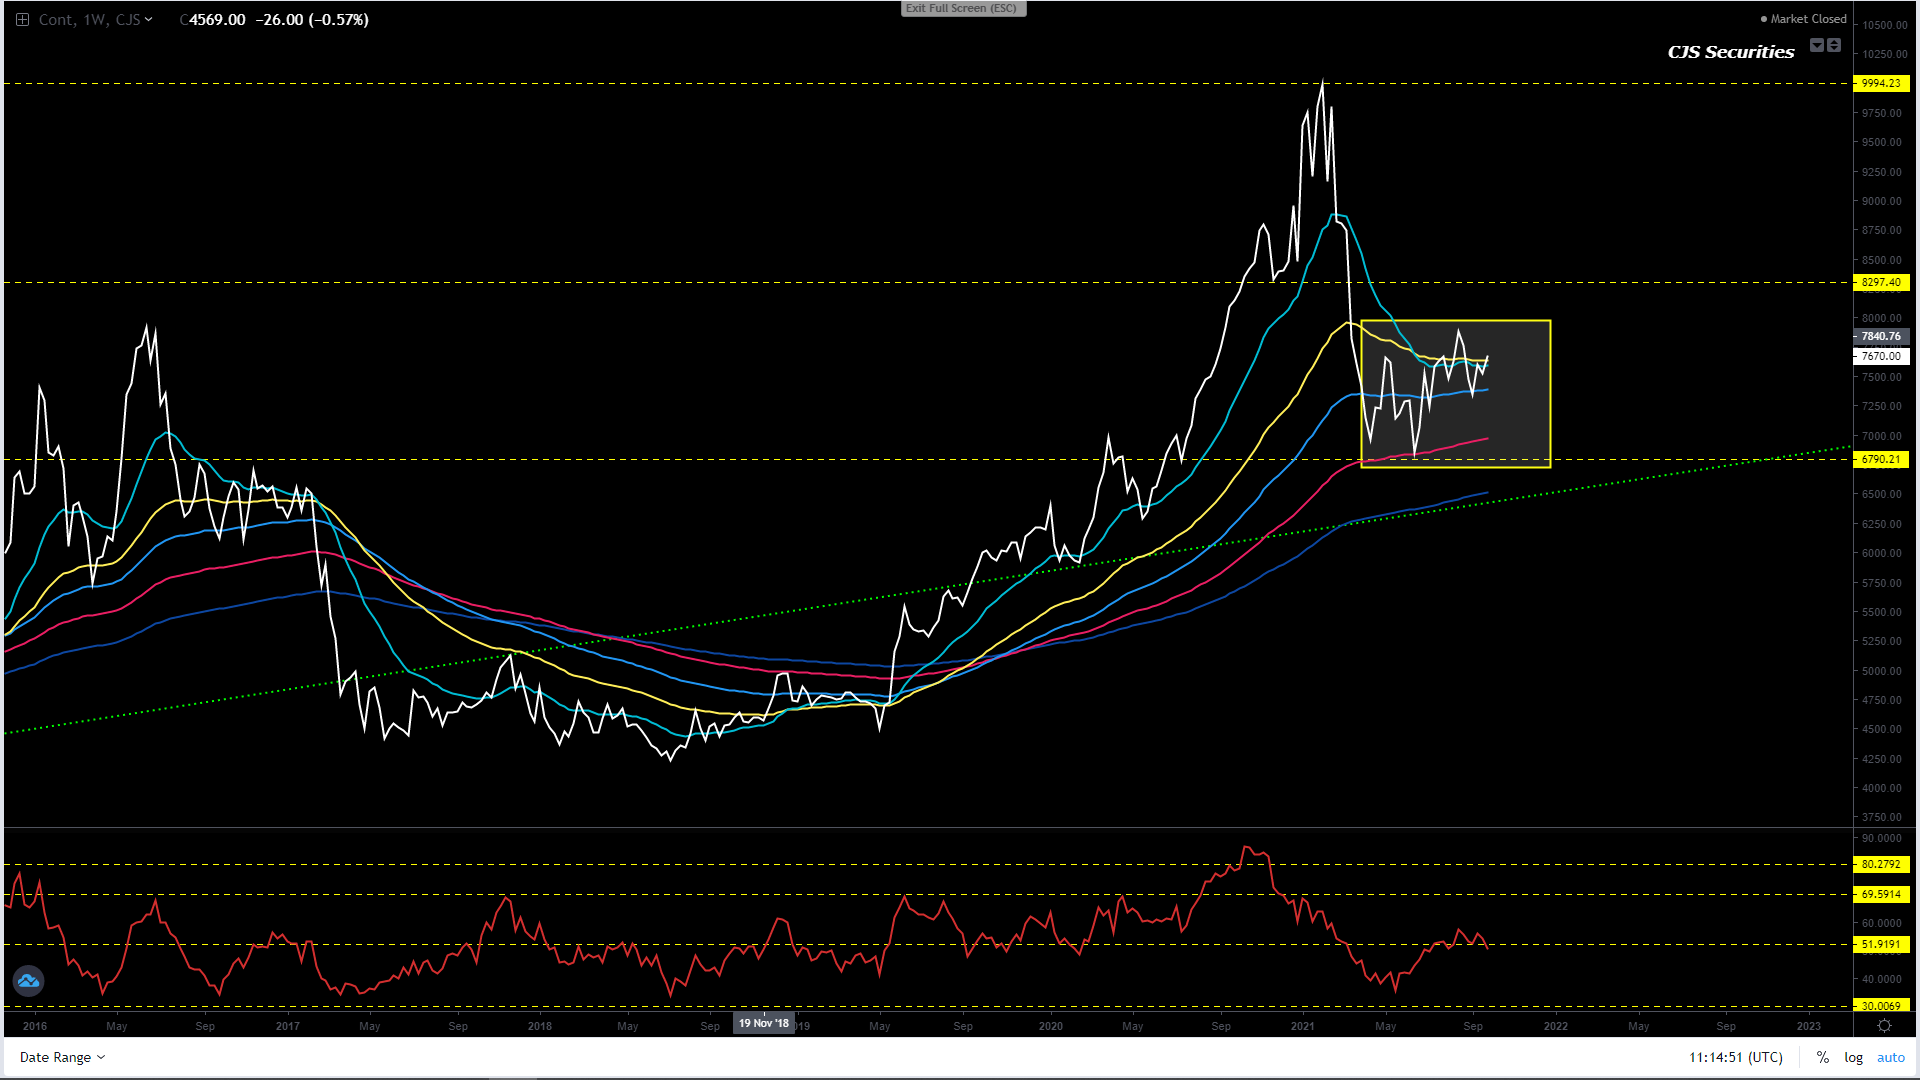
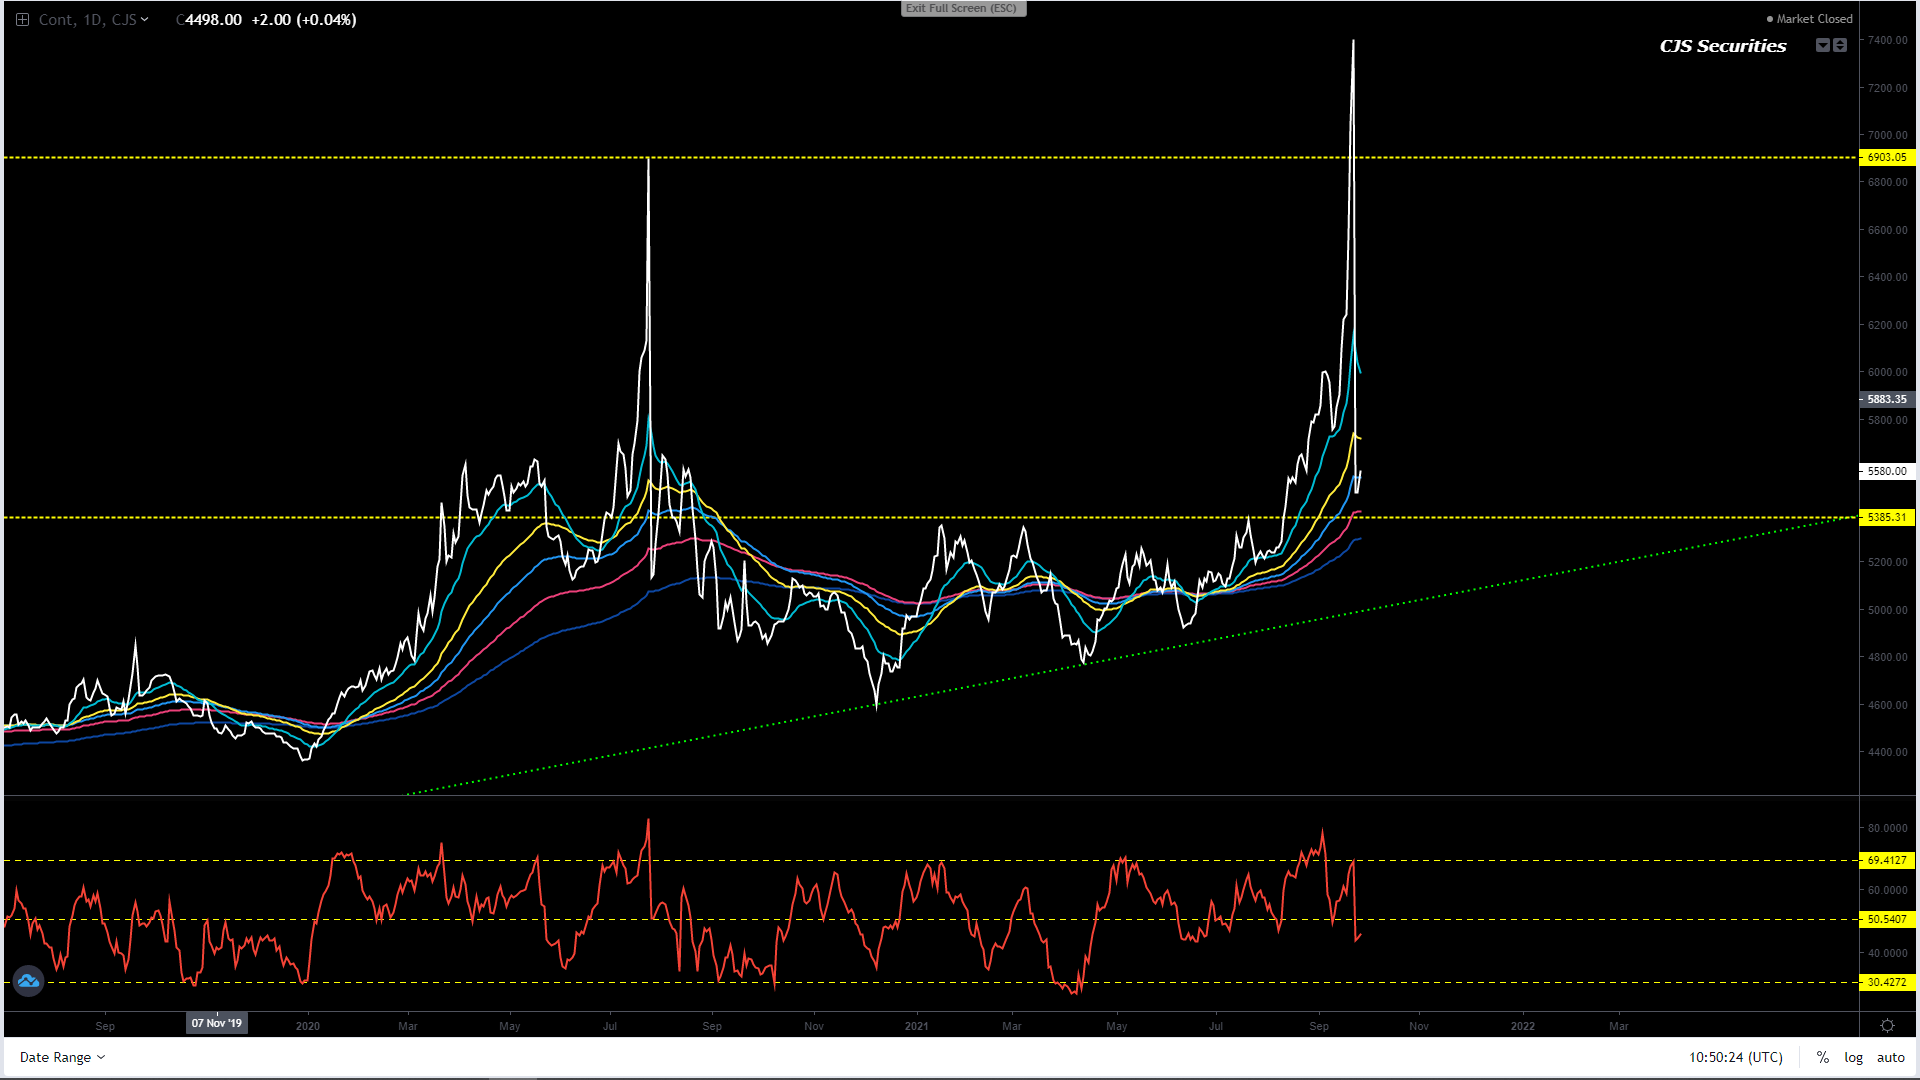
Weekly SAF Soy Continuous Close
The
chart is coming off beautifully and with a little luck could still trade as low
as R6700.00.
Irrespective
of the market moving one should be using weakness daily to price!
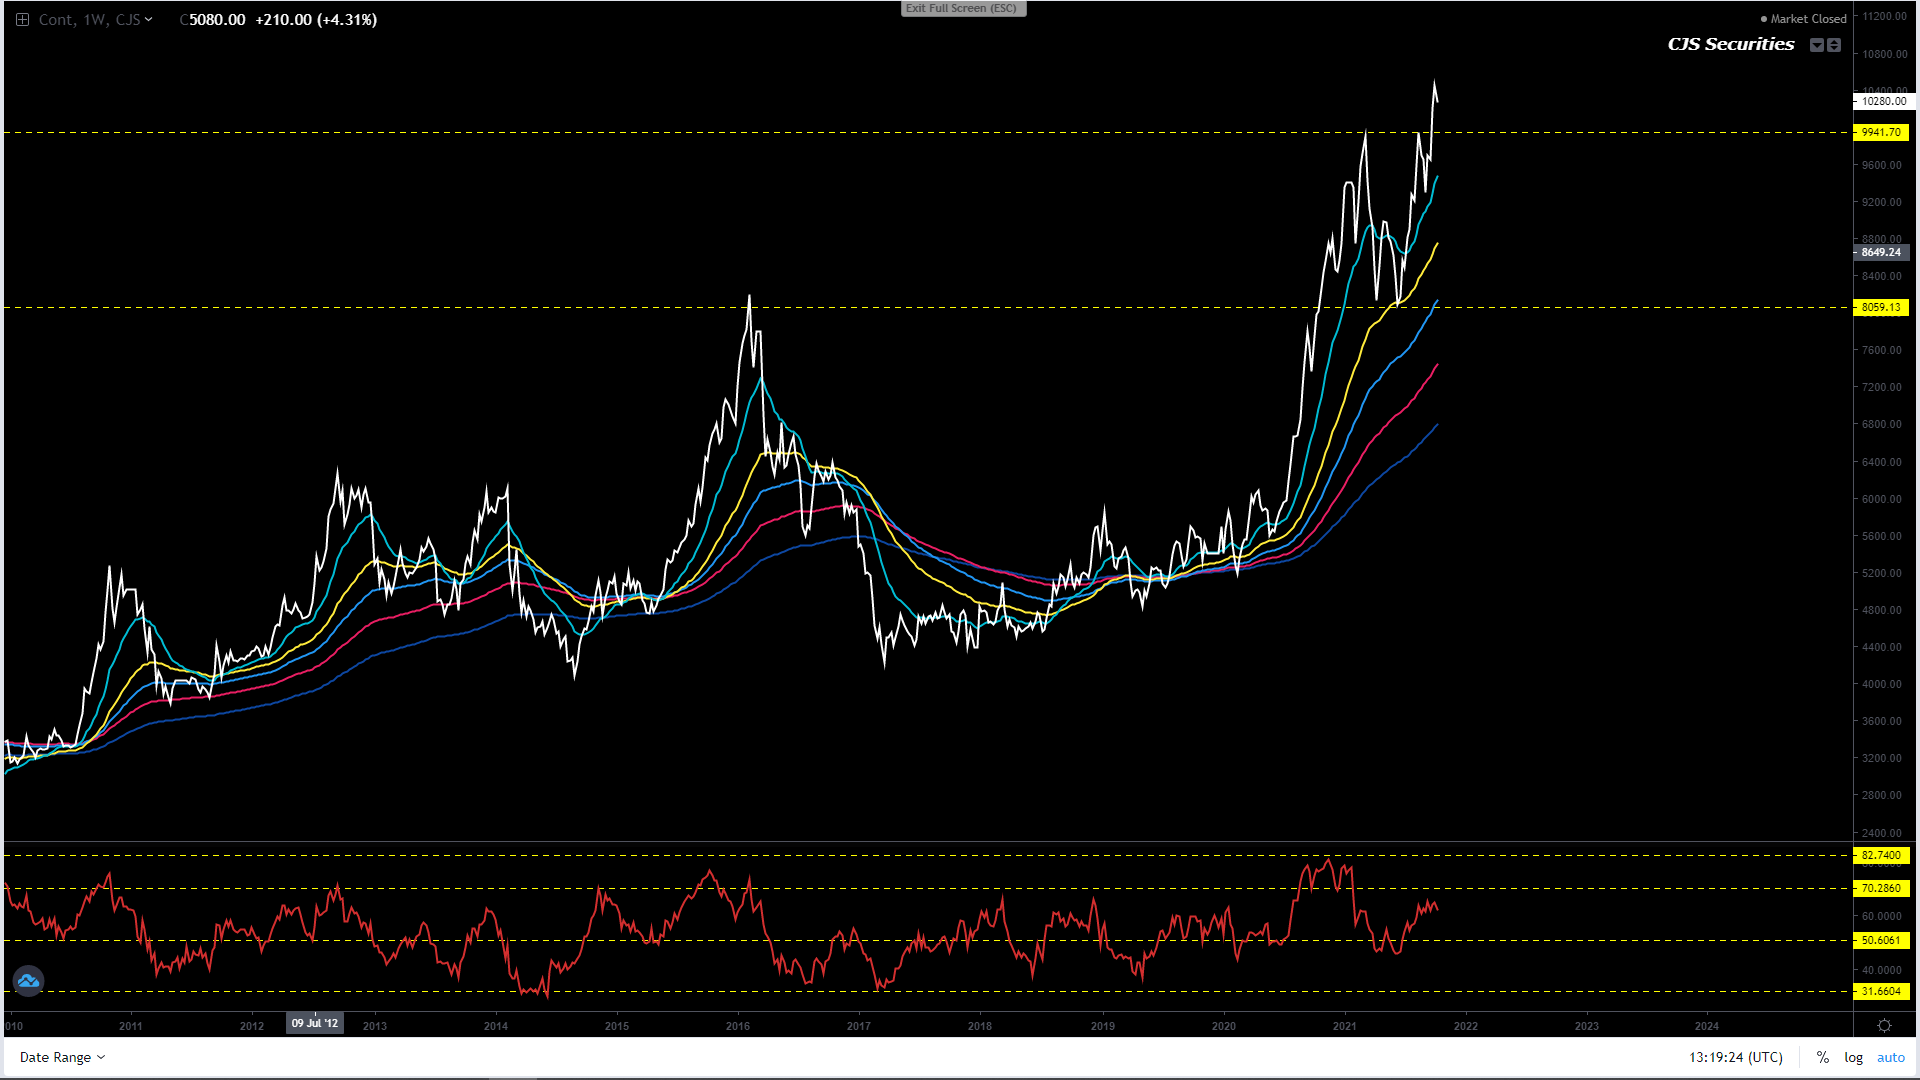
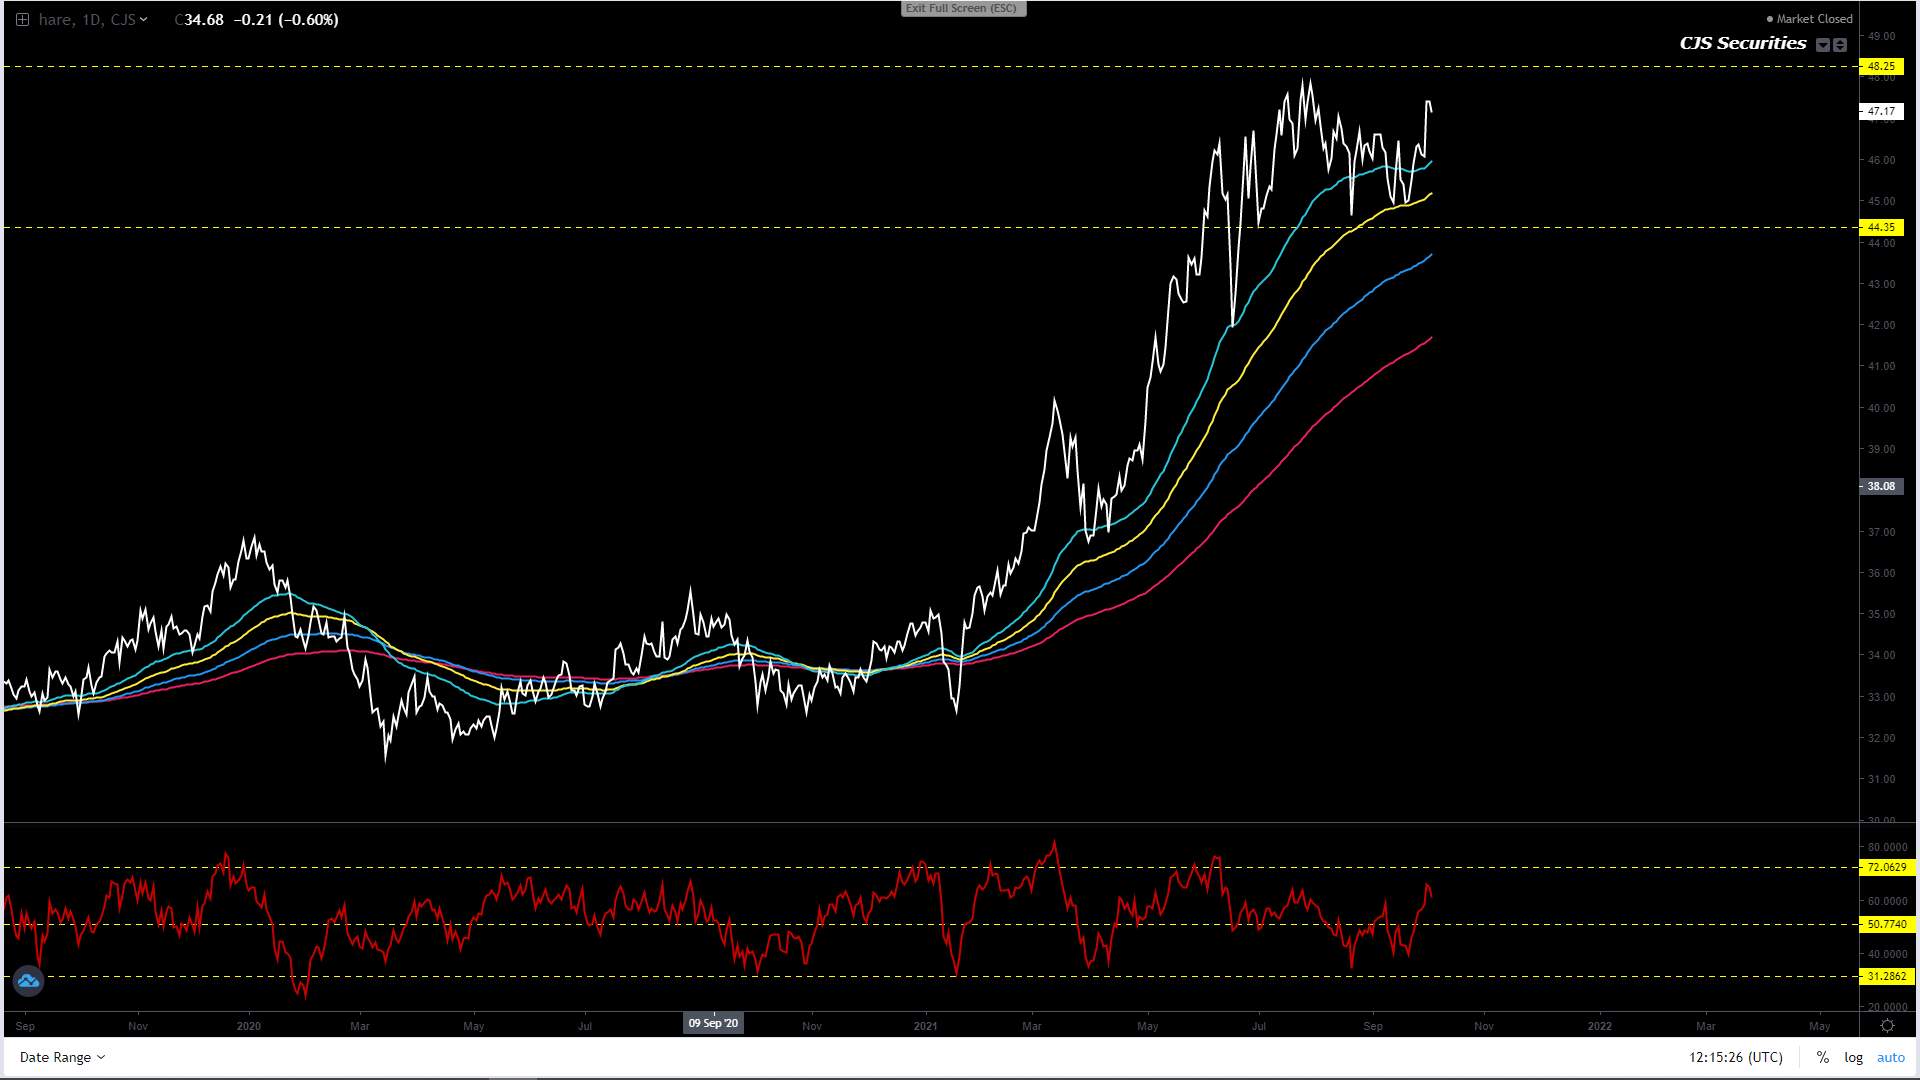
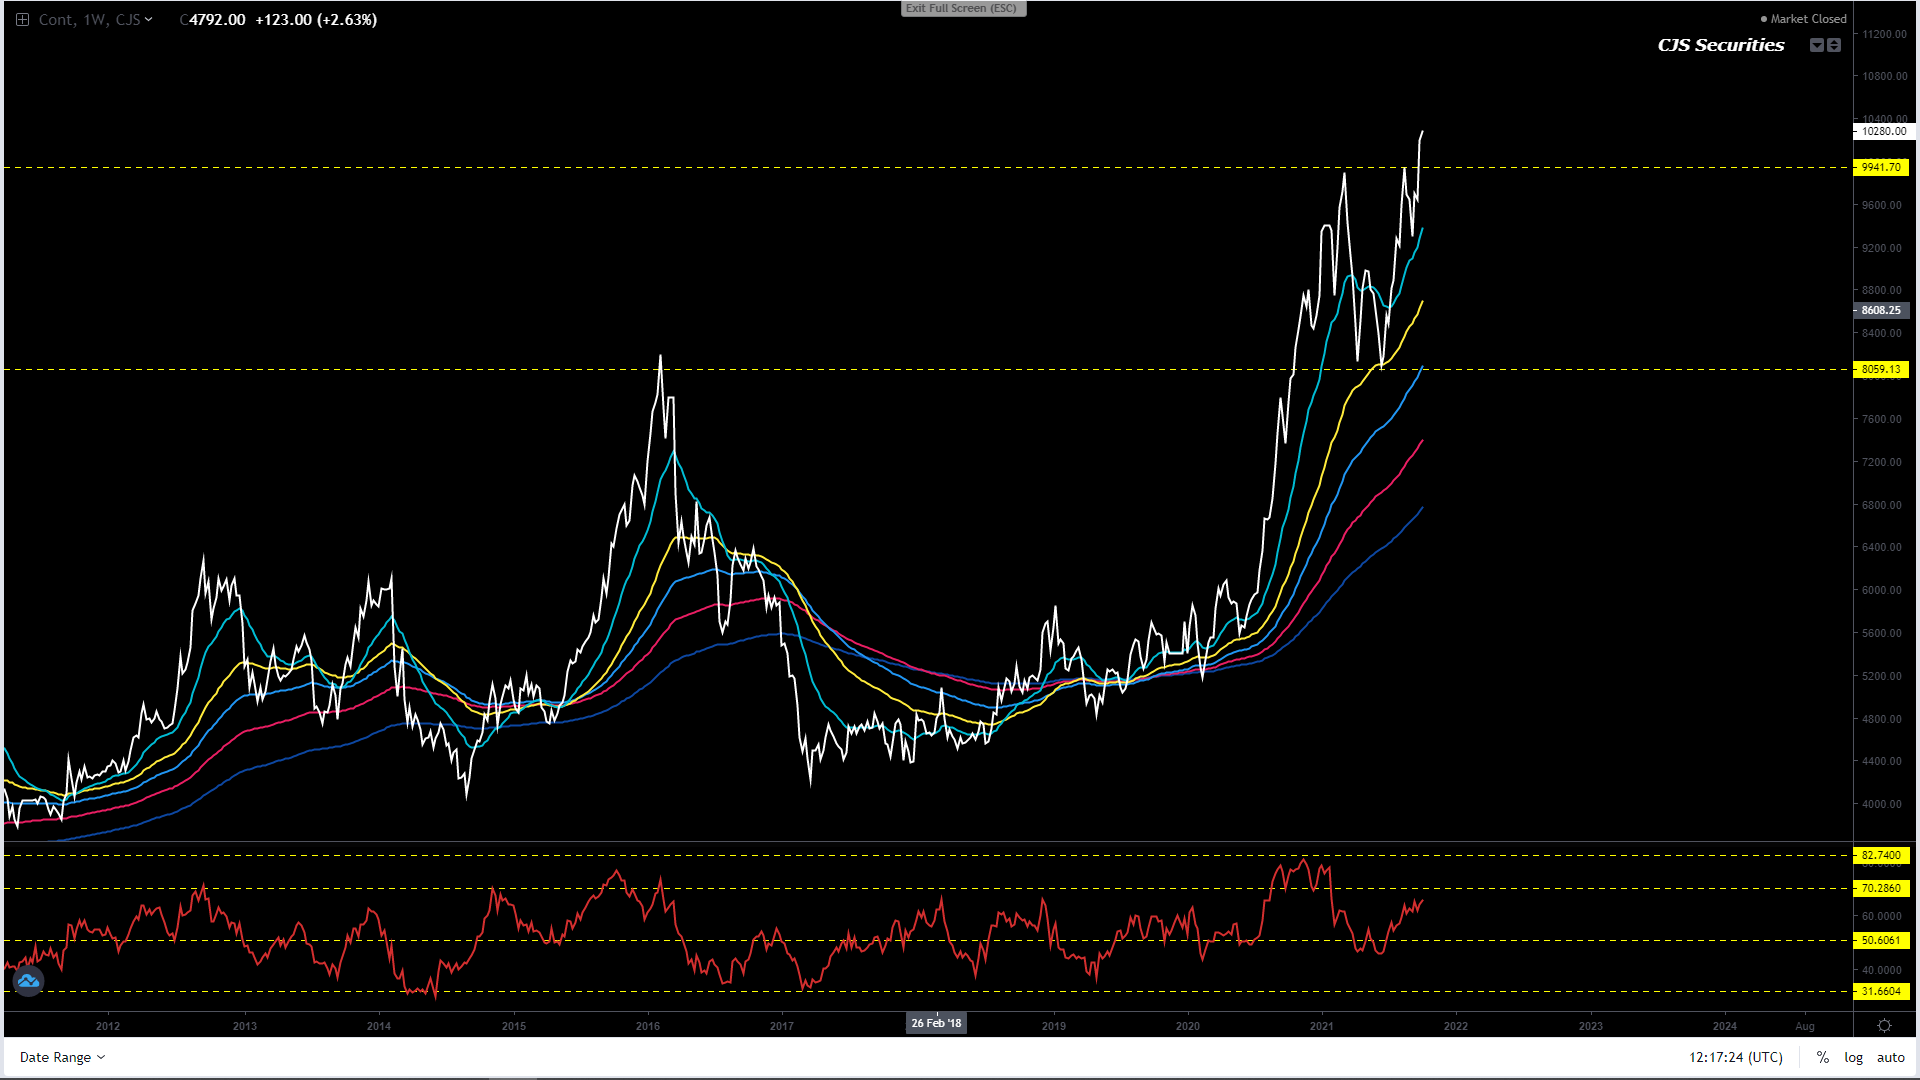
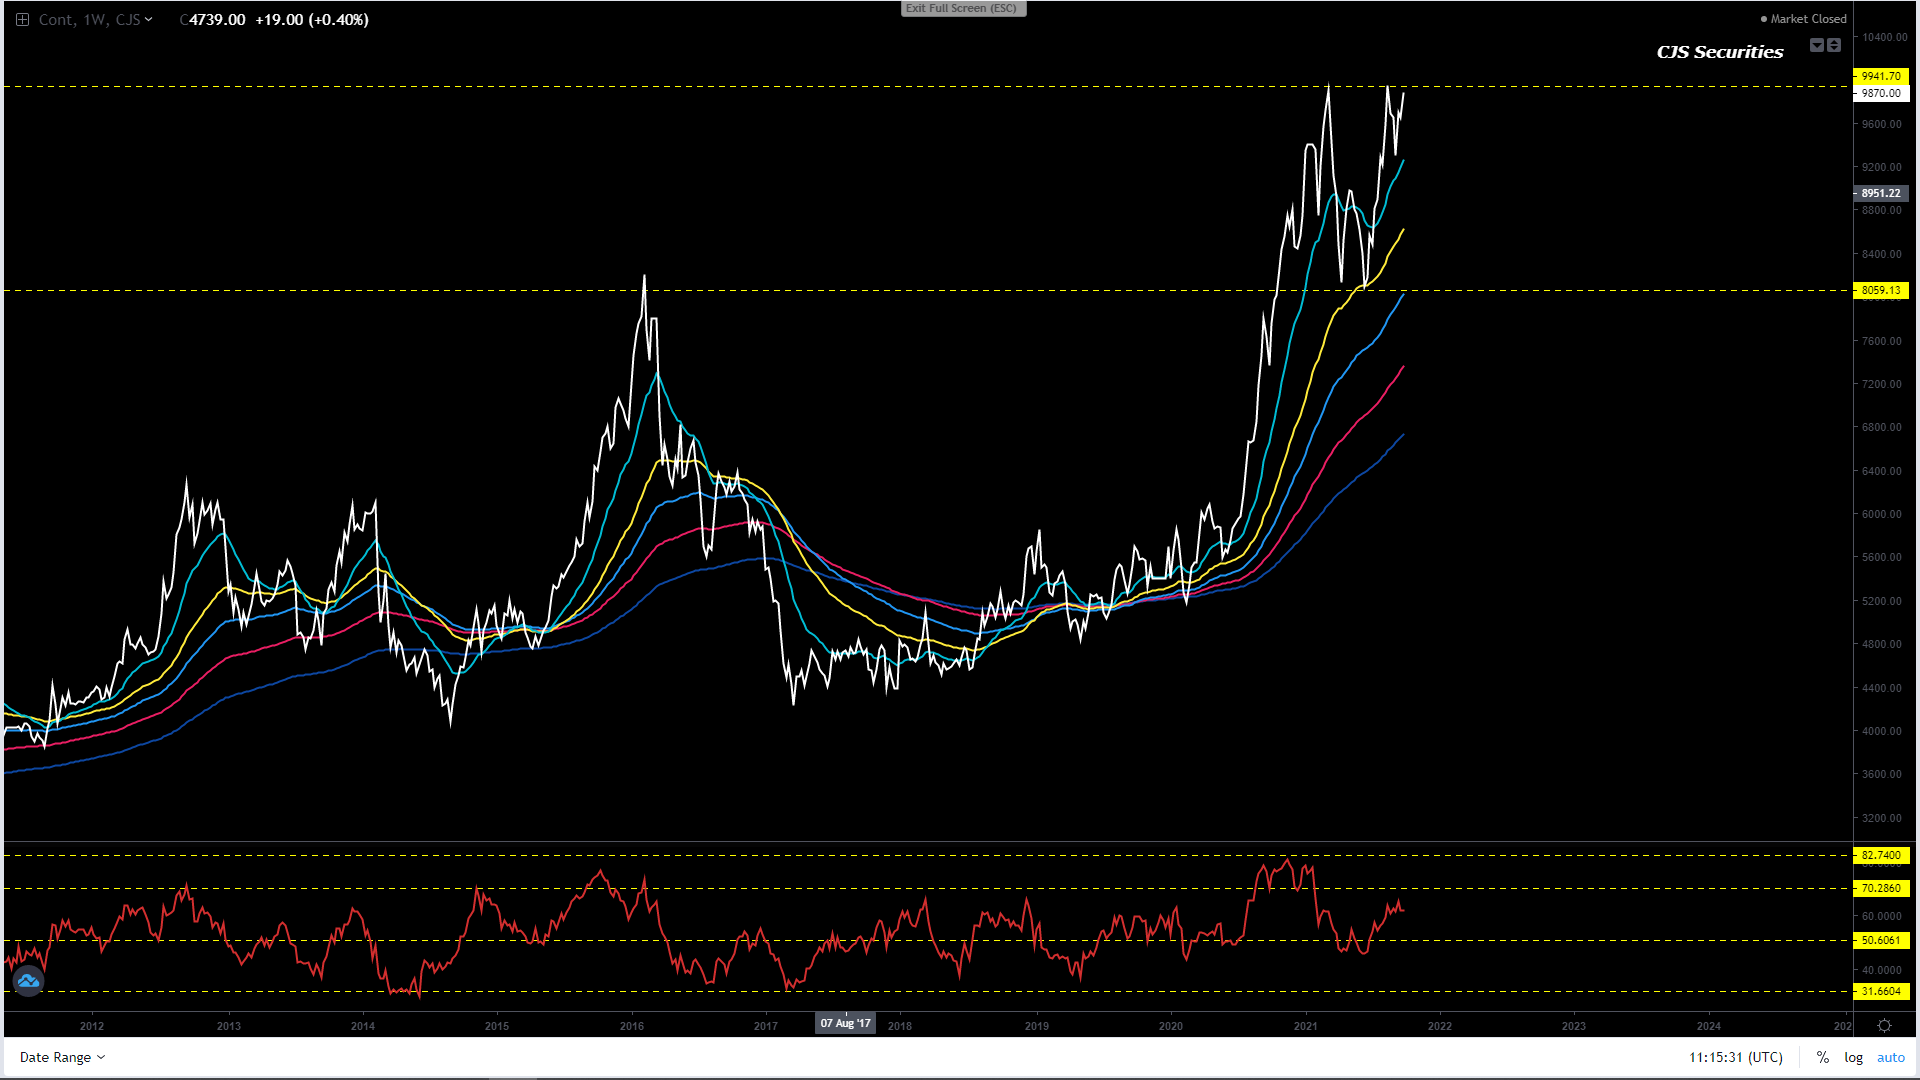
Weekly SAF Suns Continuous Close
This market is now binary and could trade as high as R11 000 – R12000.
No matter how high it goes now is the time to be grateful for our wonderful long position and call it a day!
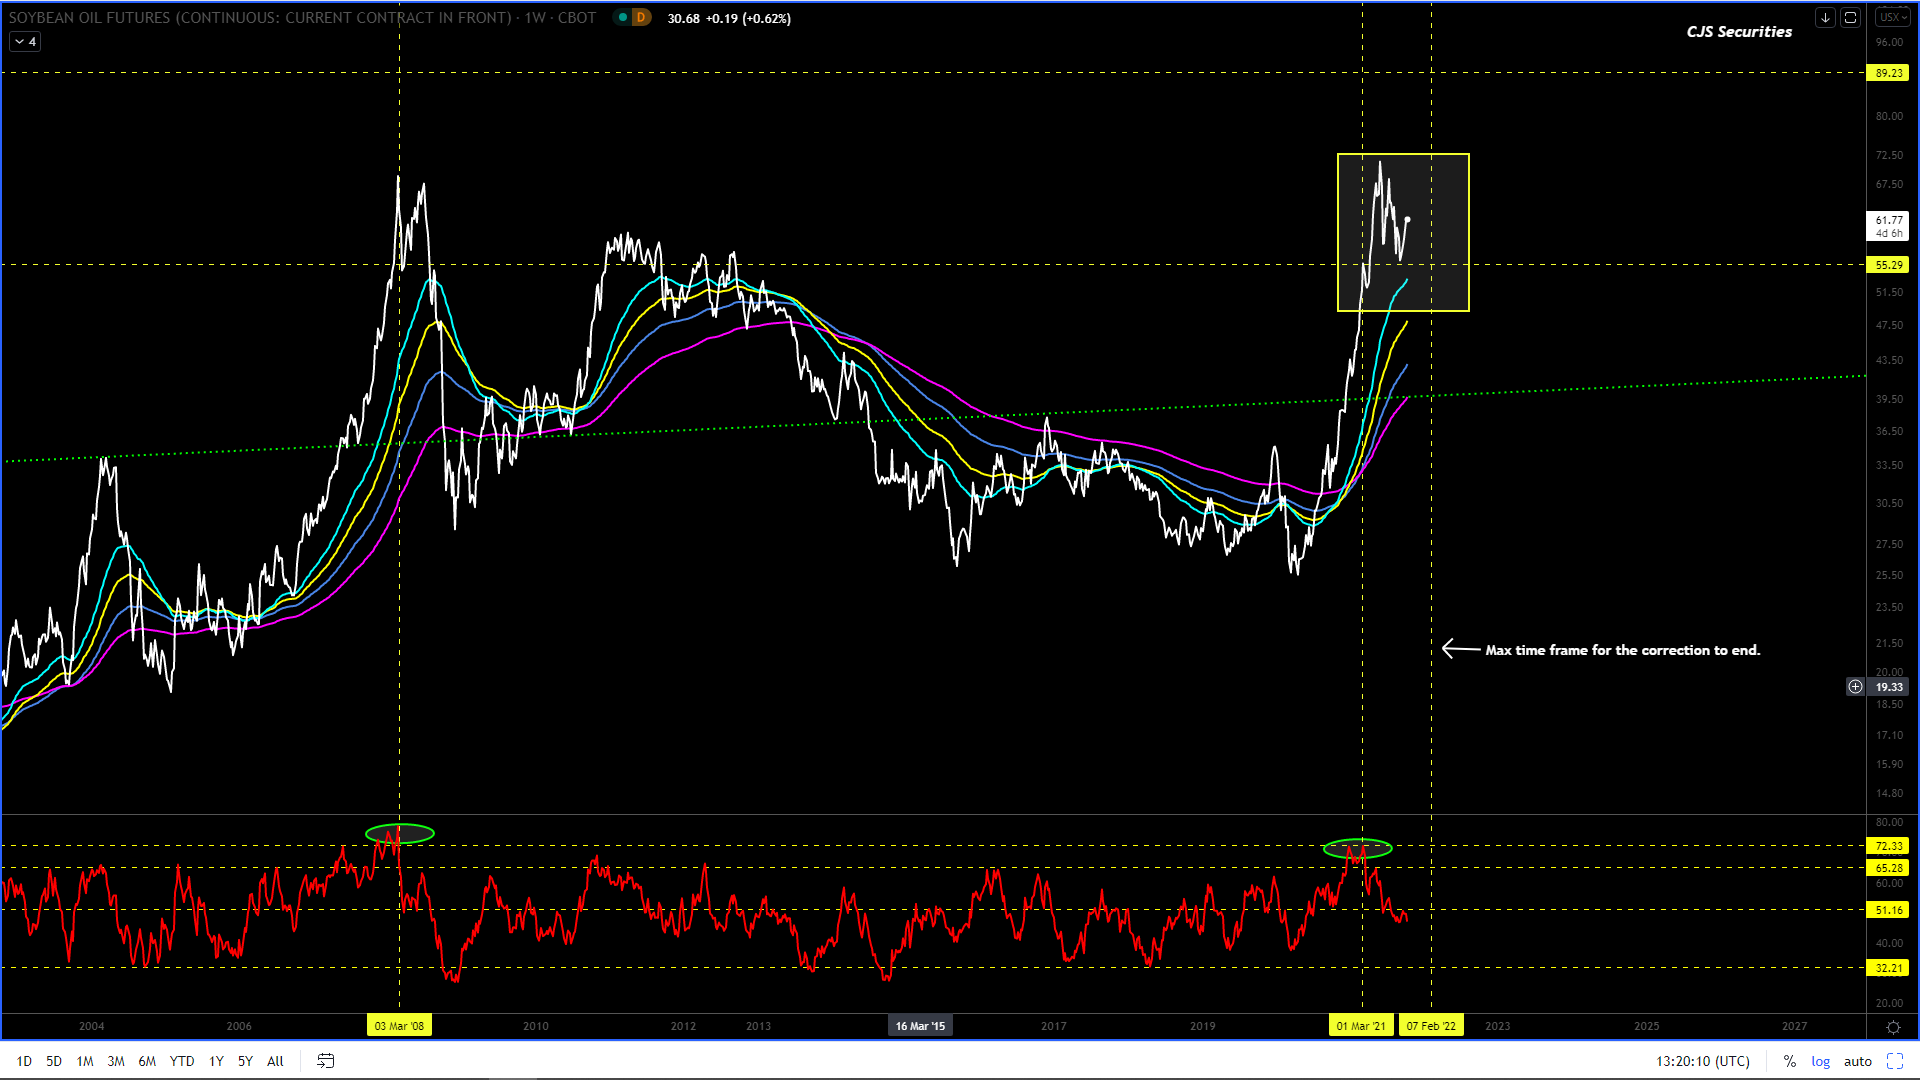
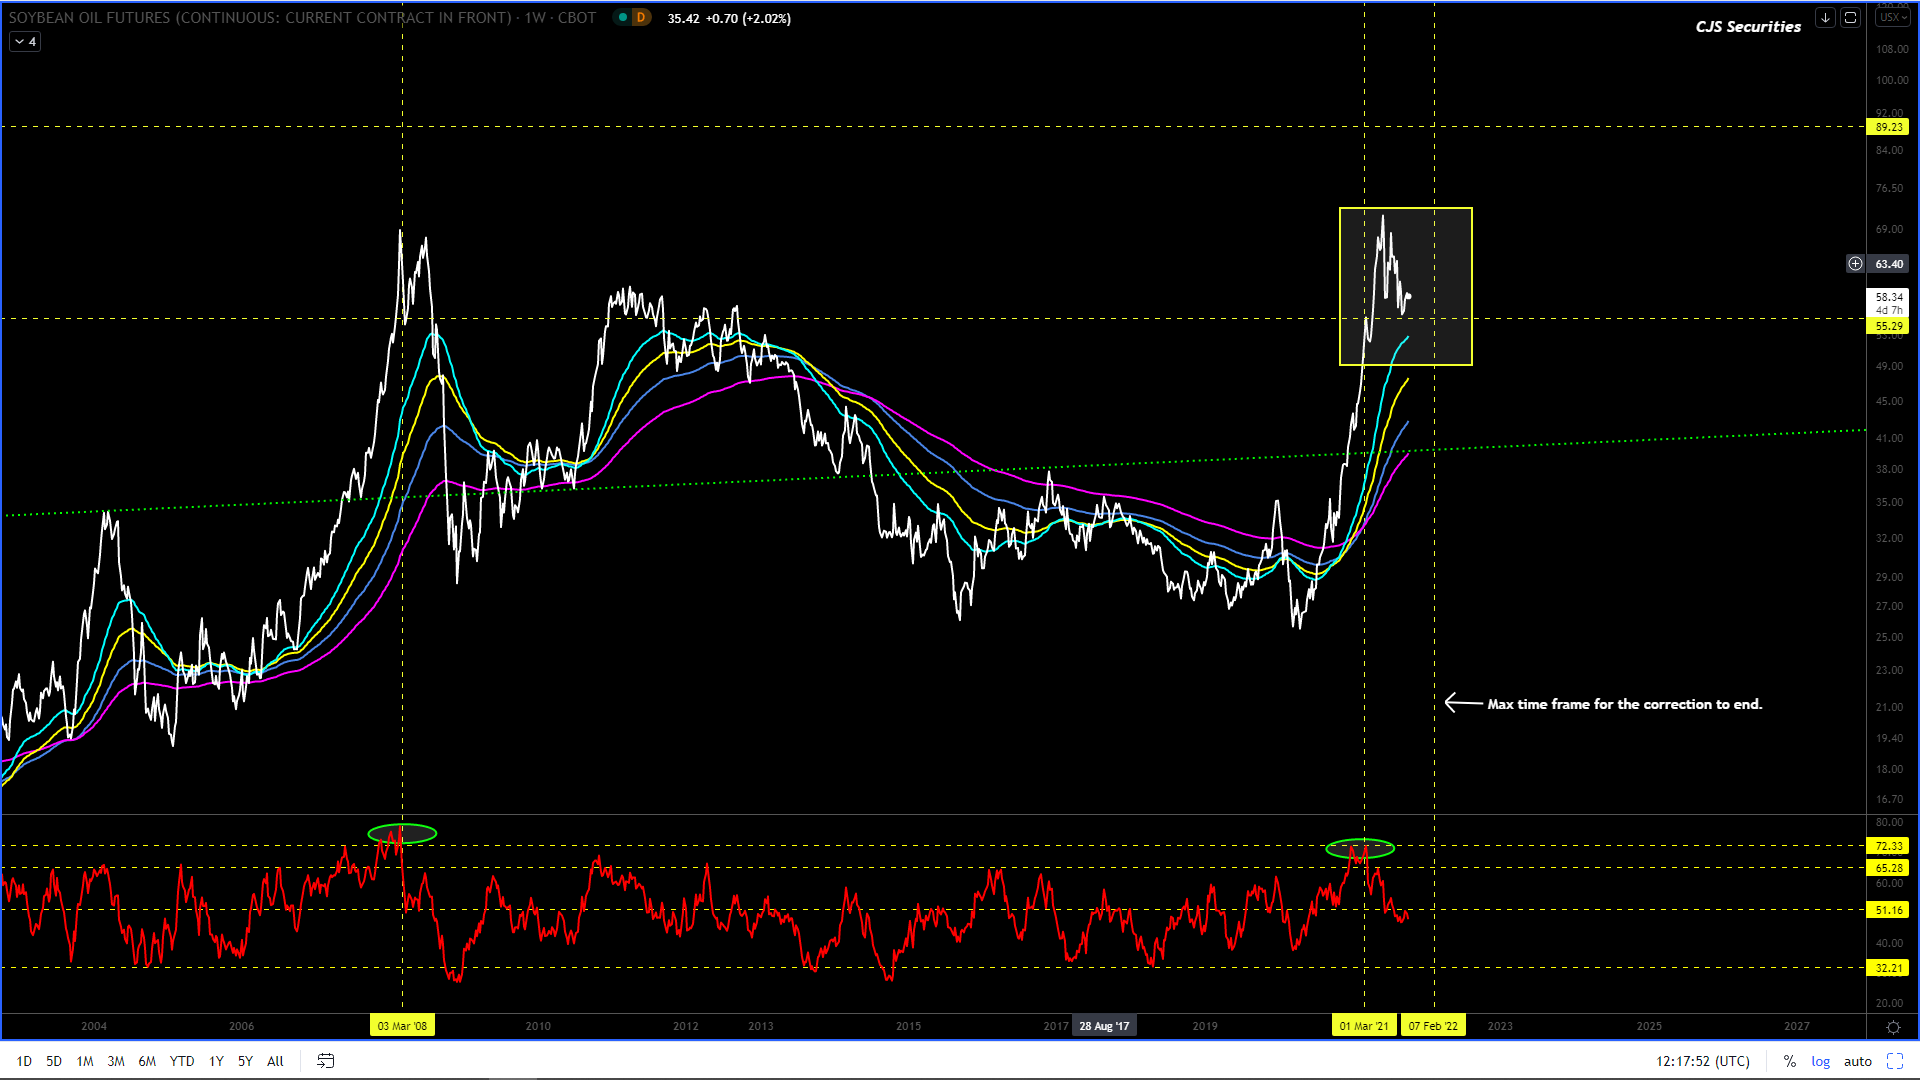
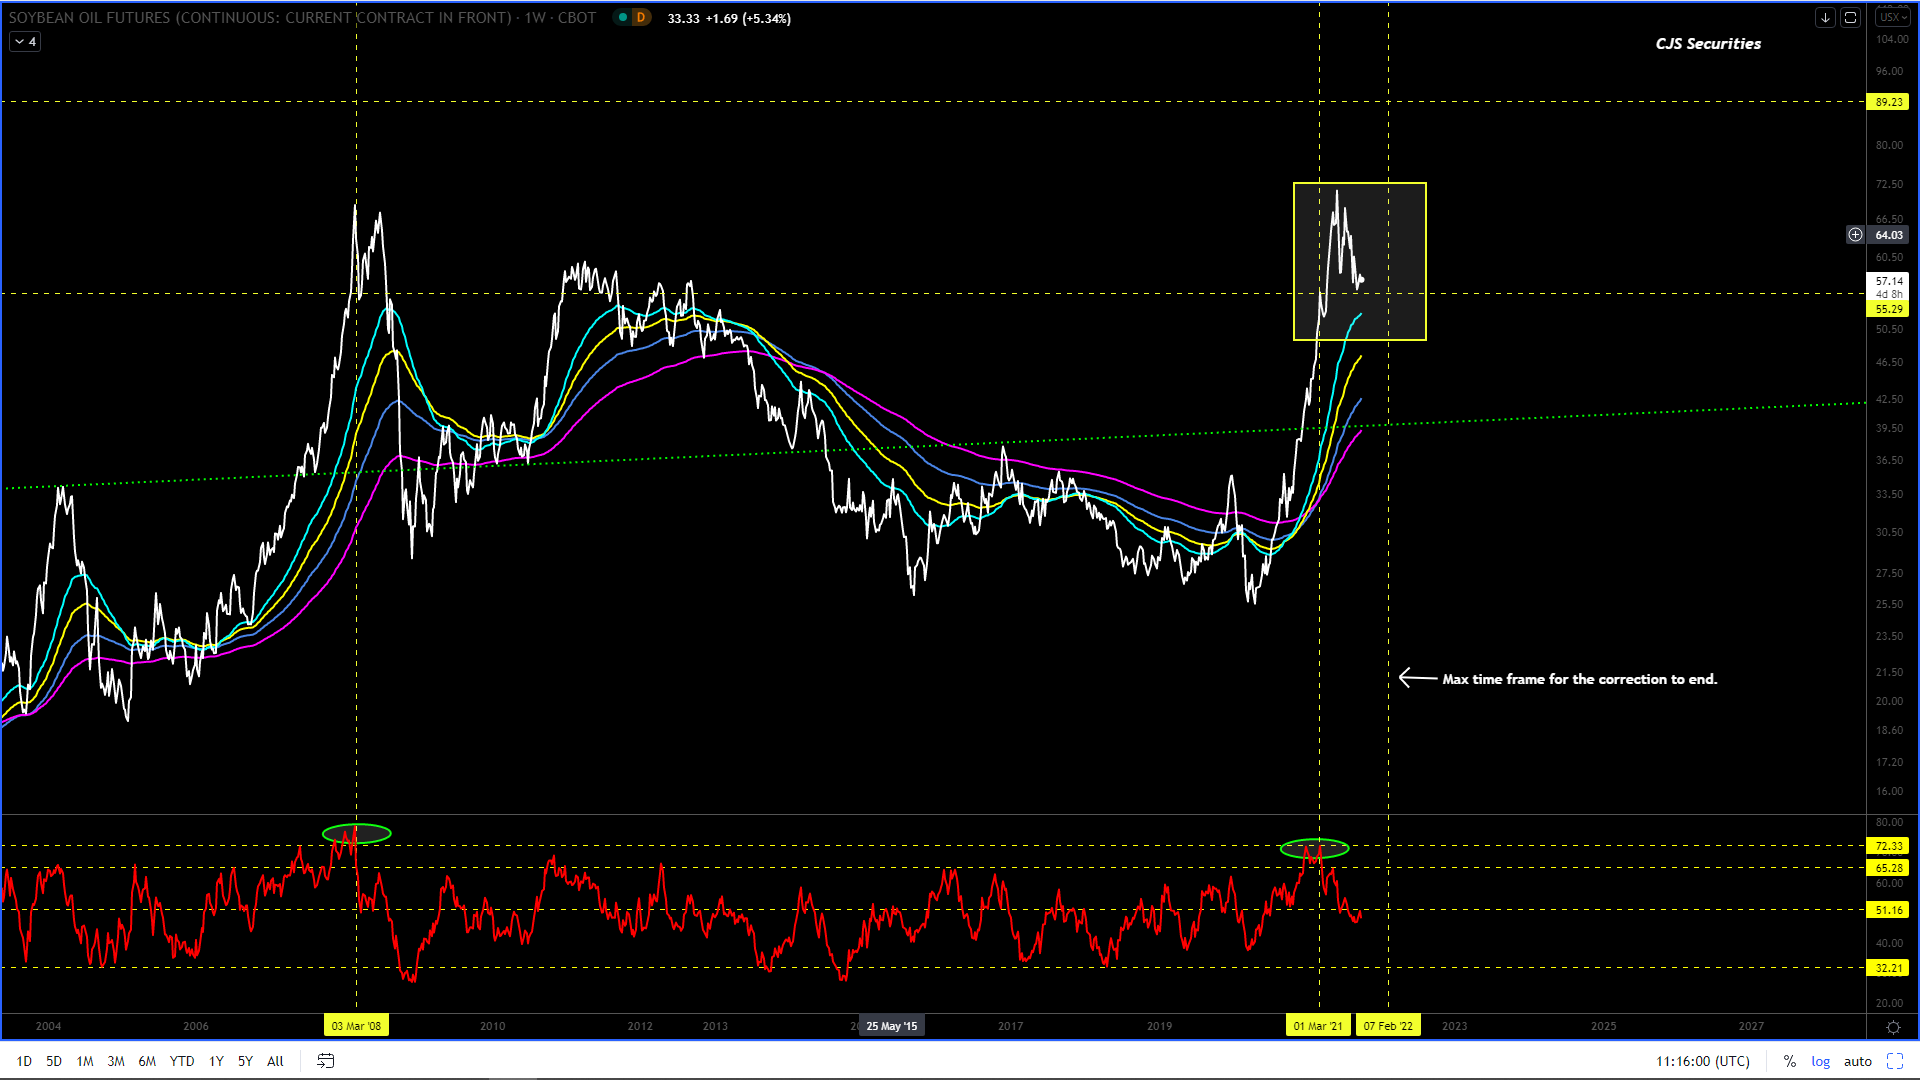
Weekly CBOT Soy Oil Continuous Close
#No Change in Commentary
I
am super bullish and starting to wonder if the energy / power issues in China
will transpire as the trigger for the below number to play out?
I
feel the correction is done, (I feel good about this one) and all the pullbacks
from here are buying opportunities with upside targets between $0.85 -$0.89!
I
almost feel that we don’t have enough cash to get as long as we should, buy at
best and scale down, this is budget making stuff with sprinkling of
retirement!!!!
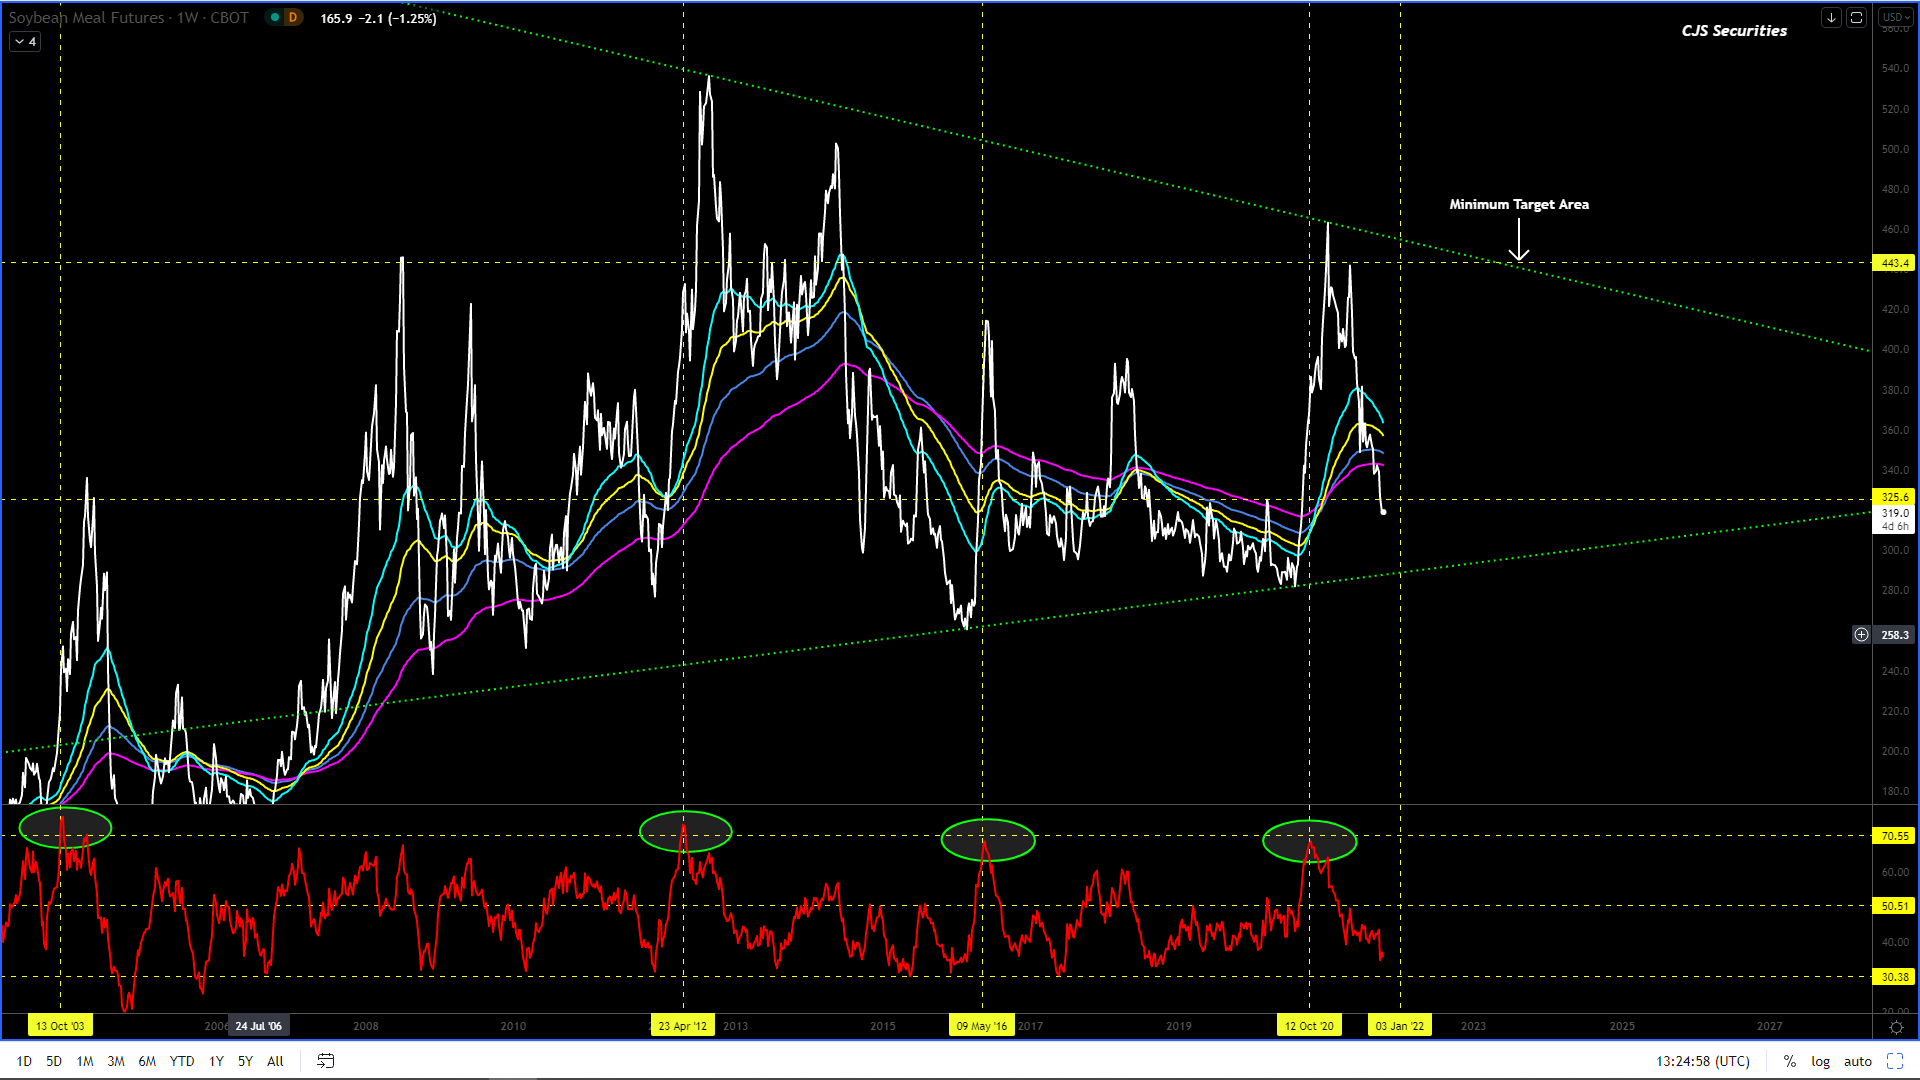
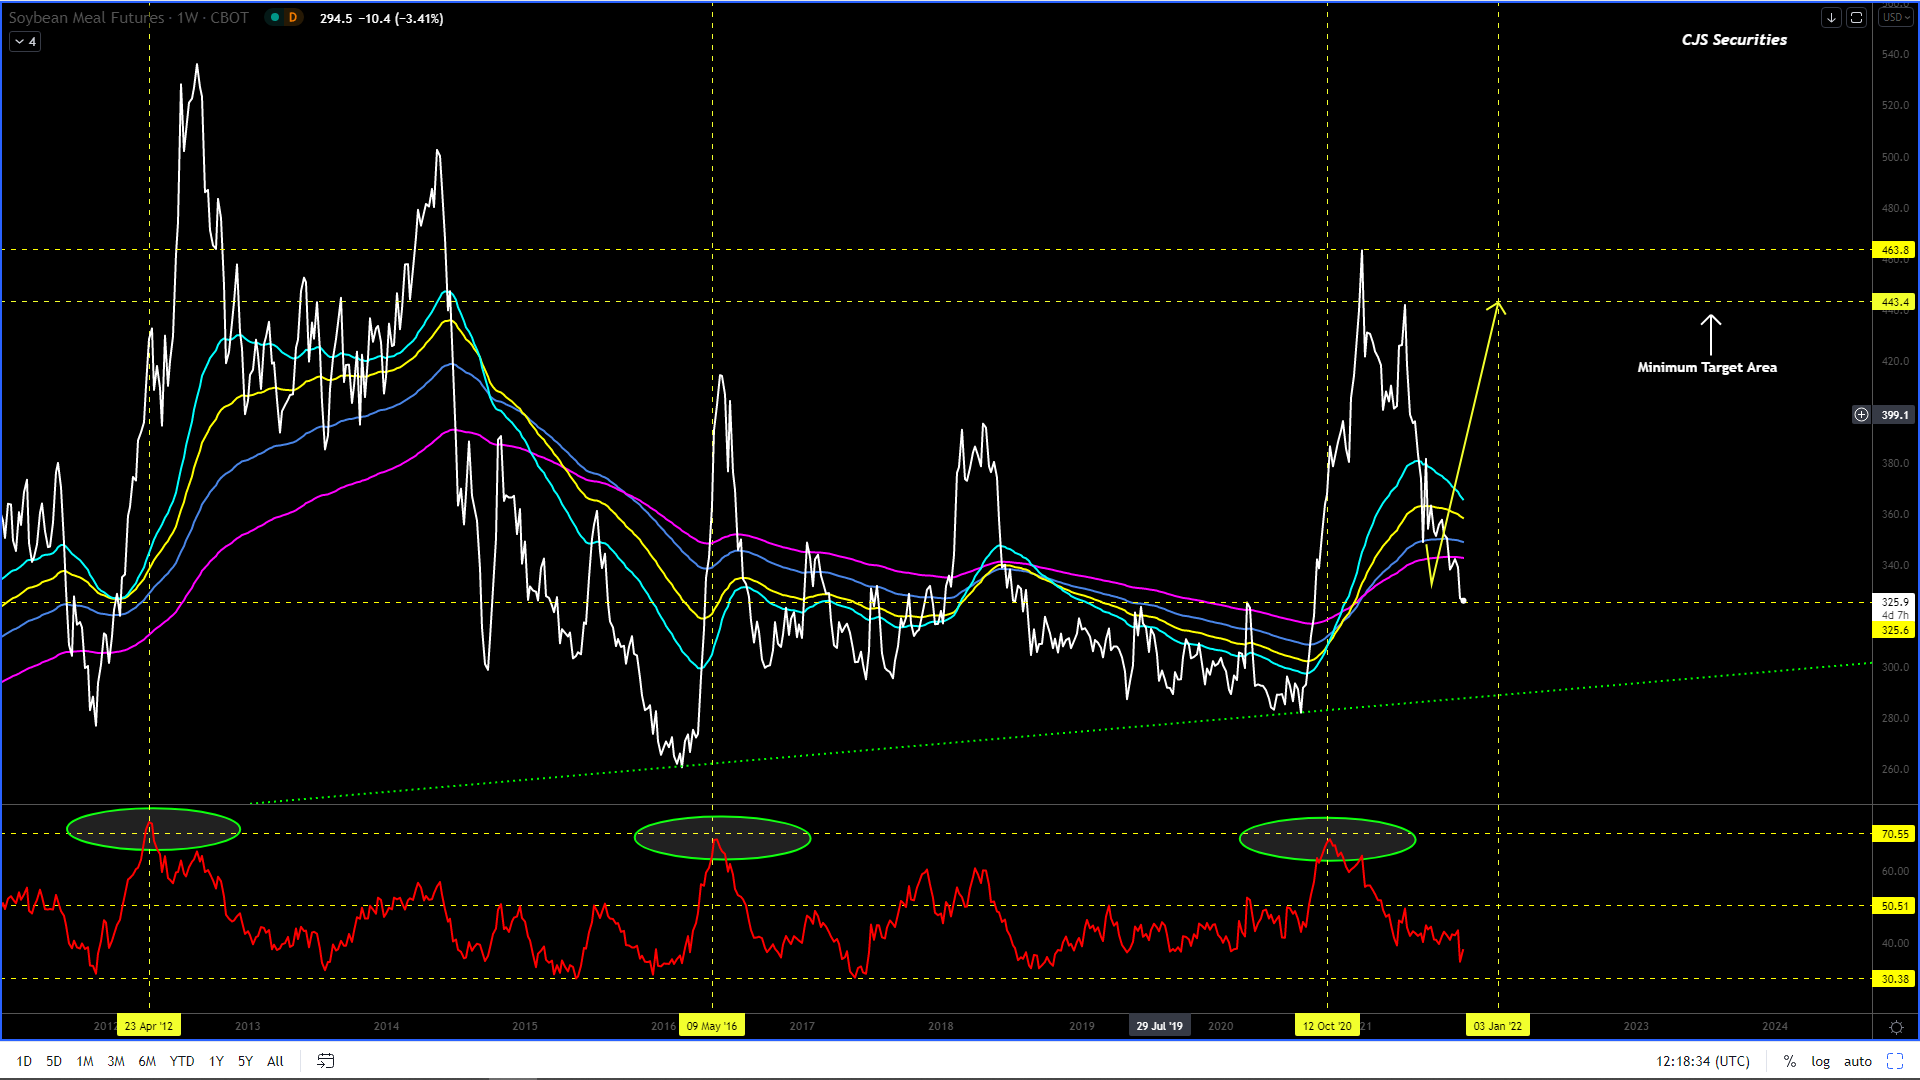
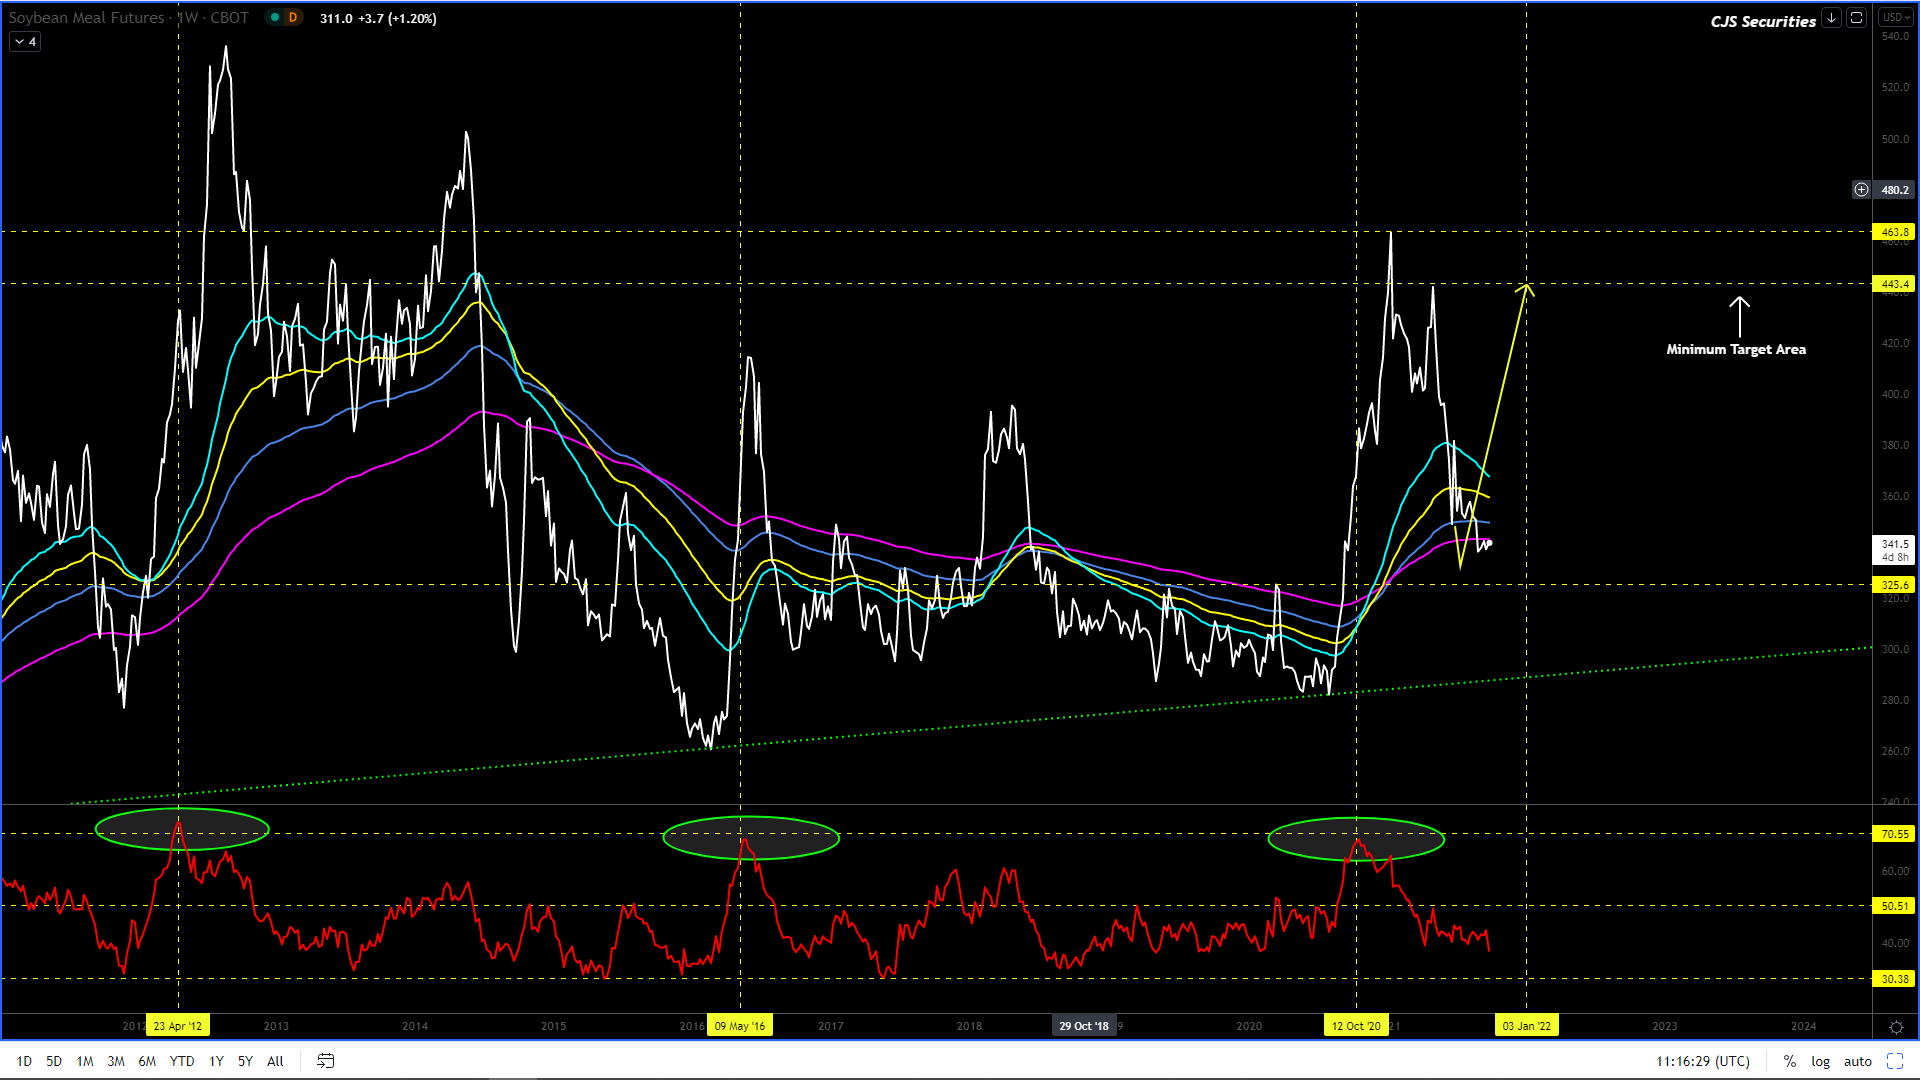
Weekly CBOT SBM Continuous Close
I
am convinced I have Stockholm syndrome.
In
all seriousness the $325level did not hold and as the saying goes “in for a
penny and now in for many pounds” so we are now waiting to see where we will
add to our long (and wrong) position.
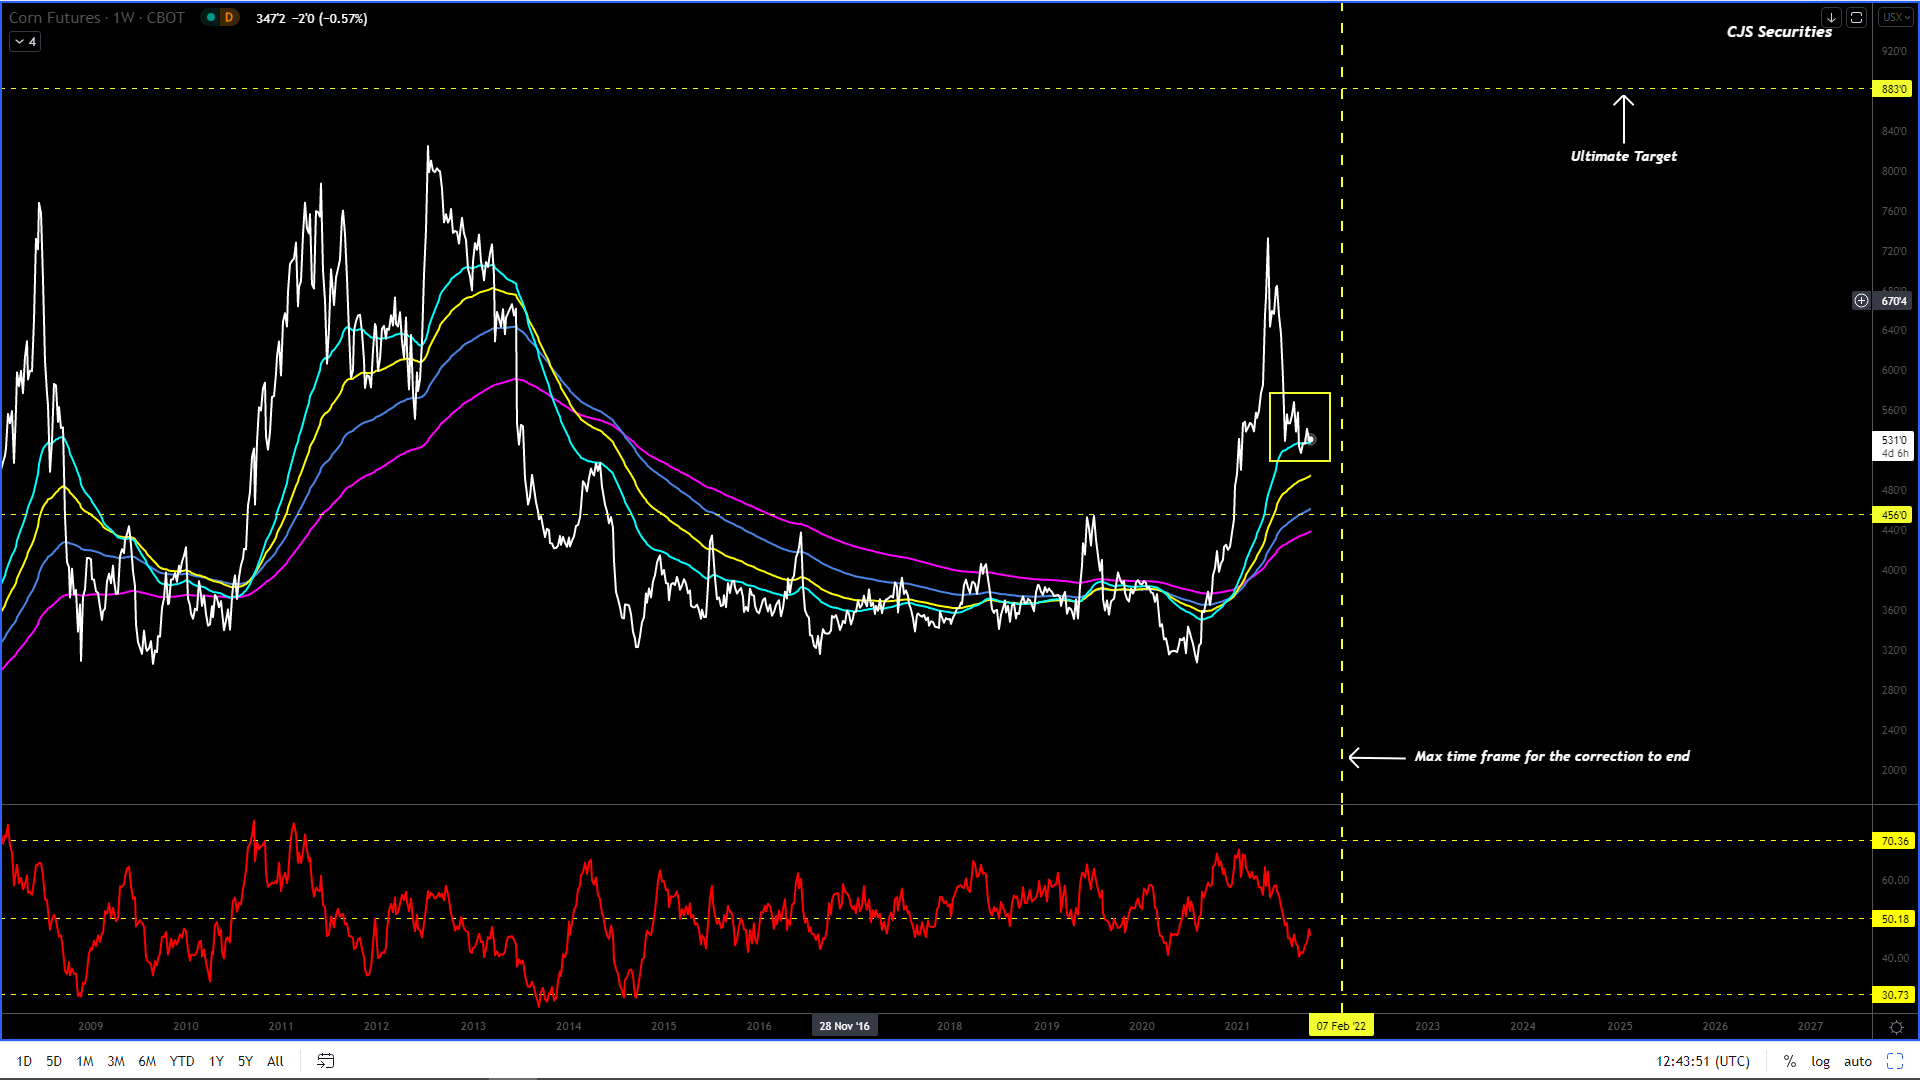
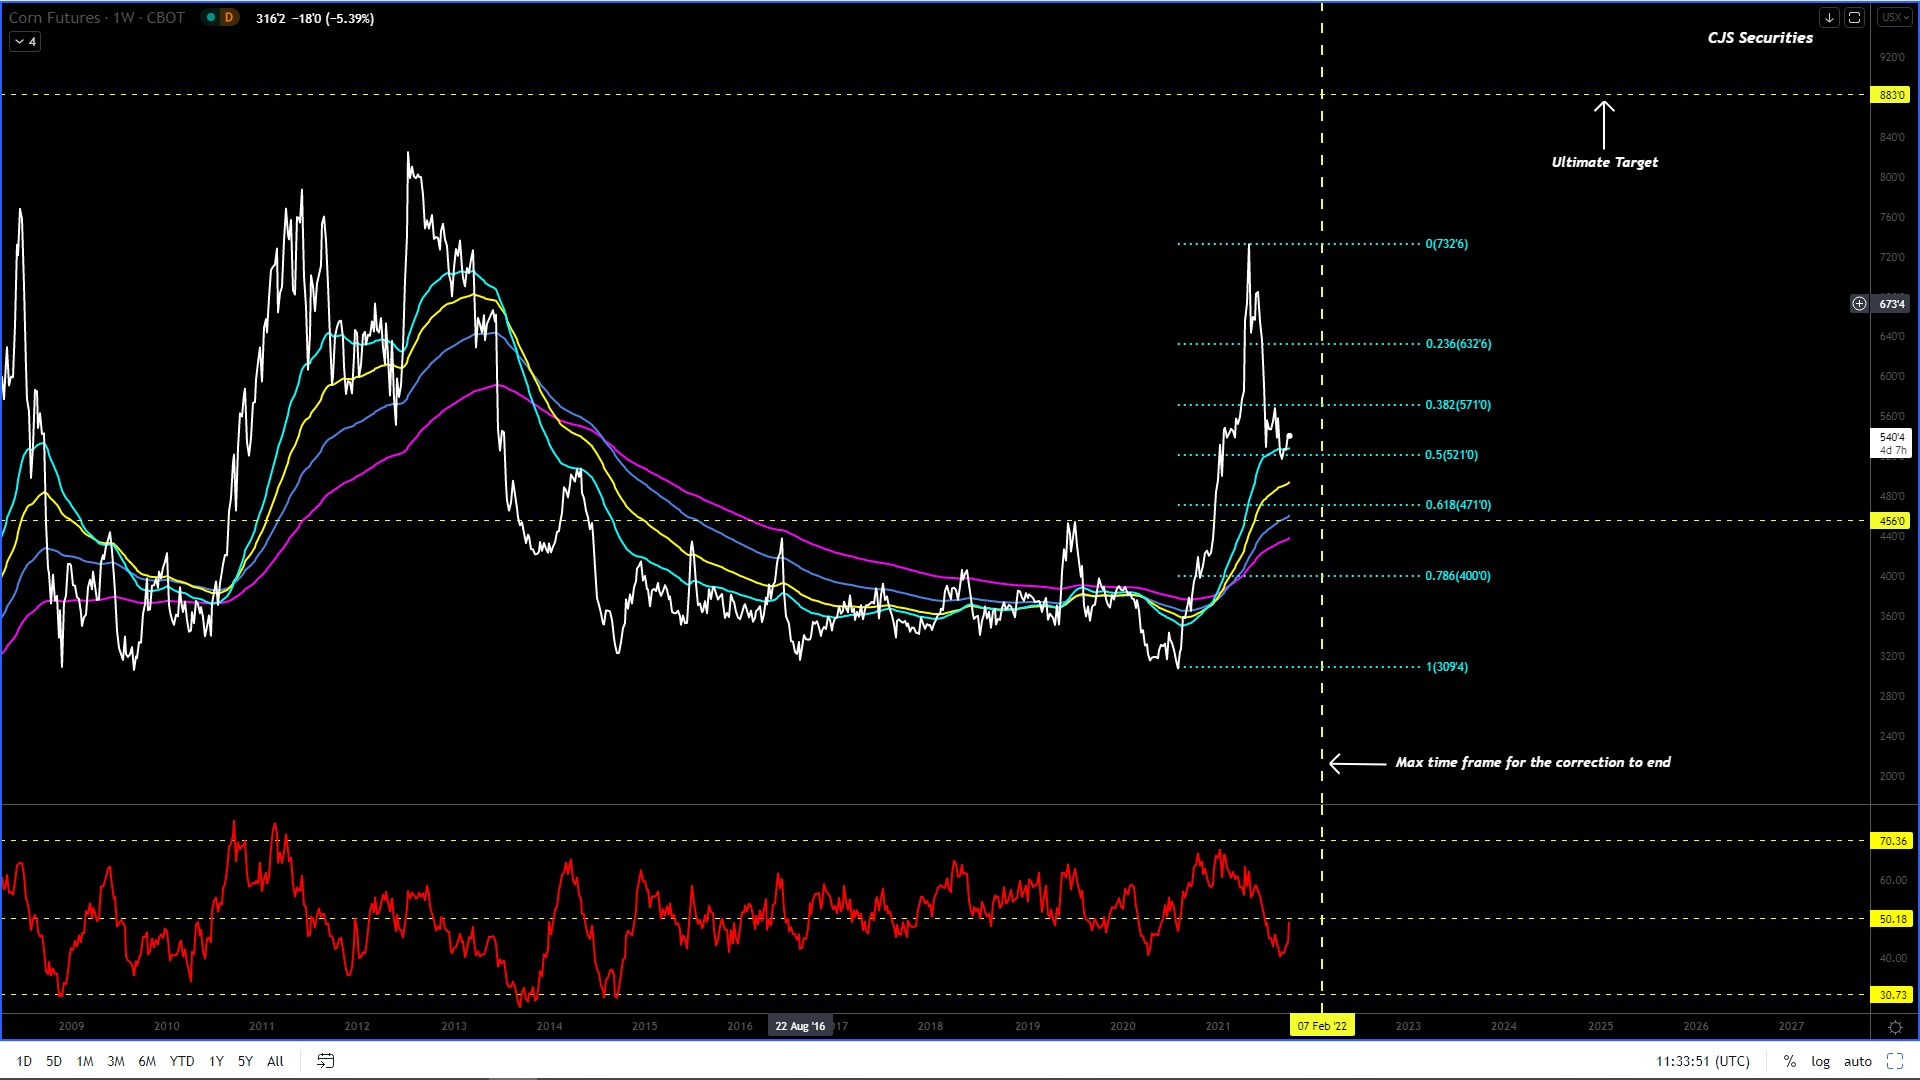
The great formation remains a correction but we are now headed higher.
The upside targets are between $5.70 – $5.80 on the Z21 contract.
Please note that I do not feel the correction is over until we have a weekly close over $6.42, while I would only consider the Bull story to be over should we have a Weekly close under $4.56.
Until then trade the ranges, use the market volatility to build your confidence and don’t get married to a view as regret is a rough sheet to sleep on!
I REMAIN really bullish in the “big picture” but, we could easily see this market come off after trying to print $5.70, so in short you may well have the chance to get long sub $5.00!
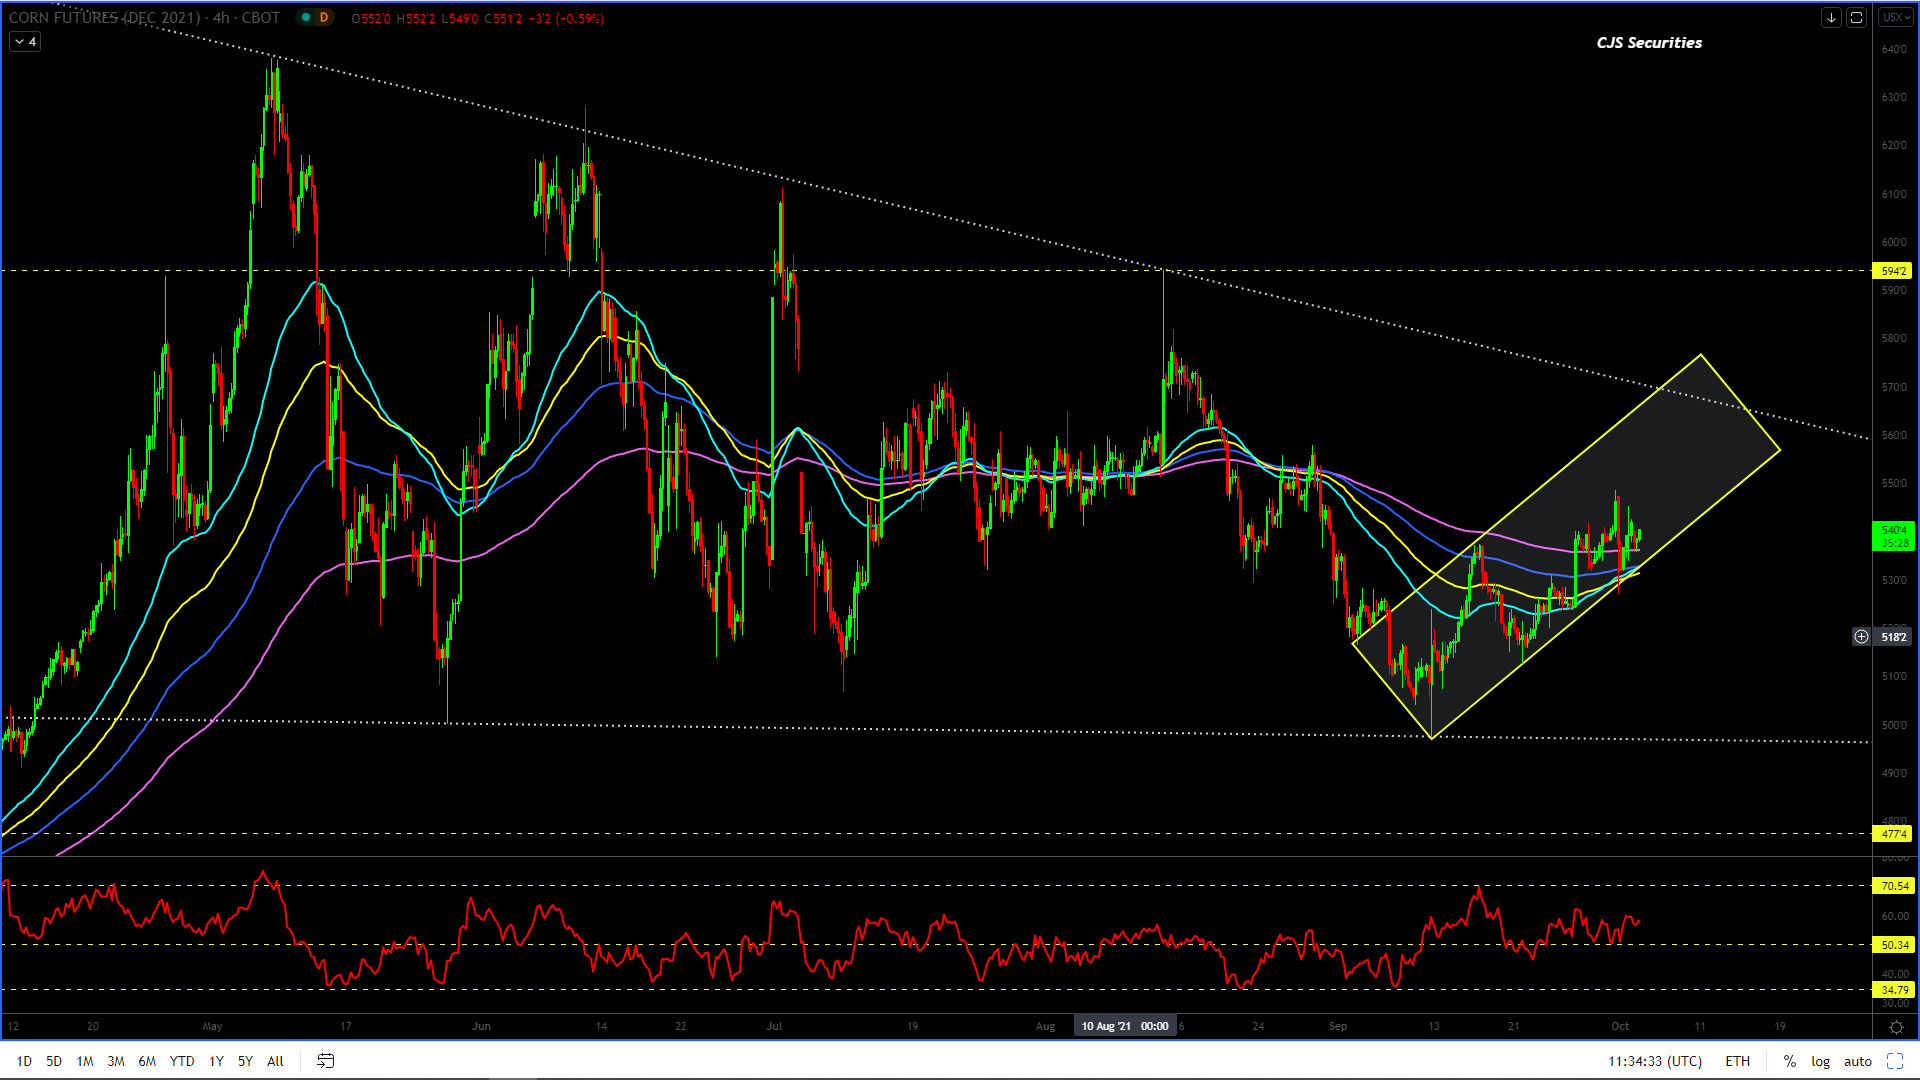
240 Min December 21 Corn Candle Chart Close
#NO Change in Commentary
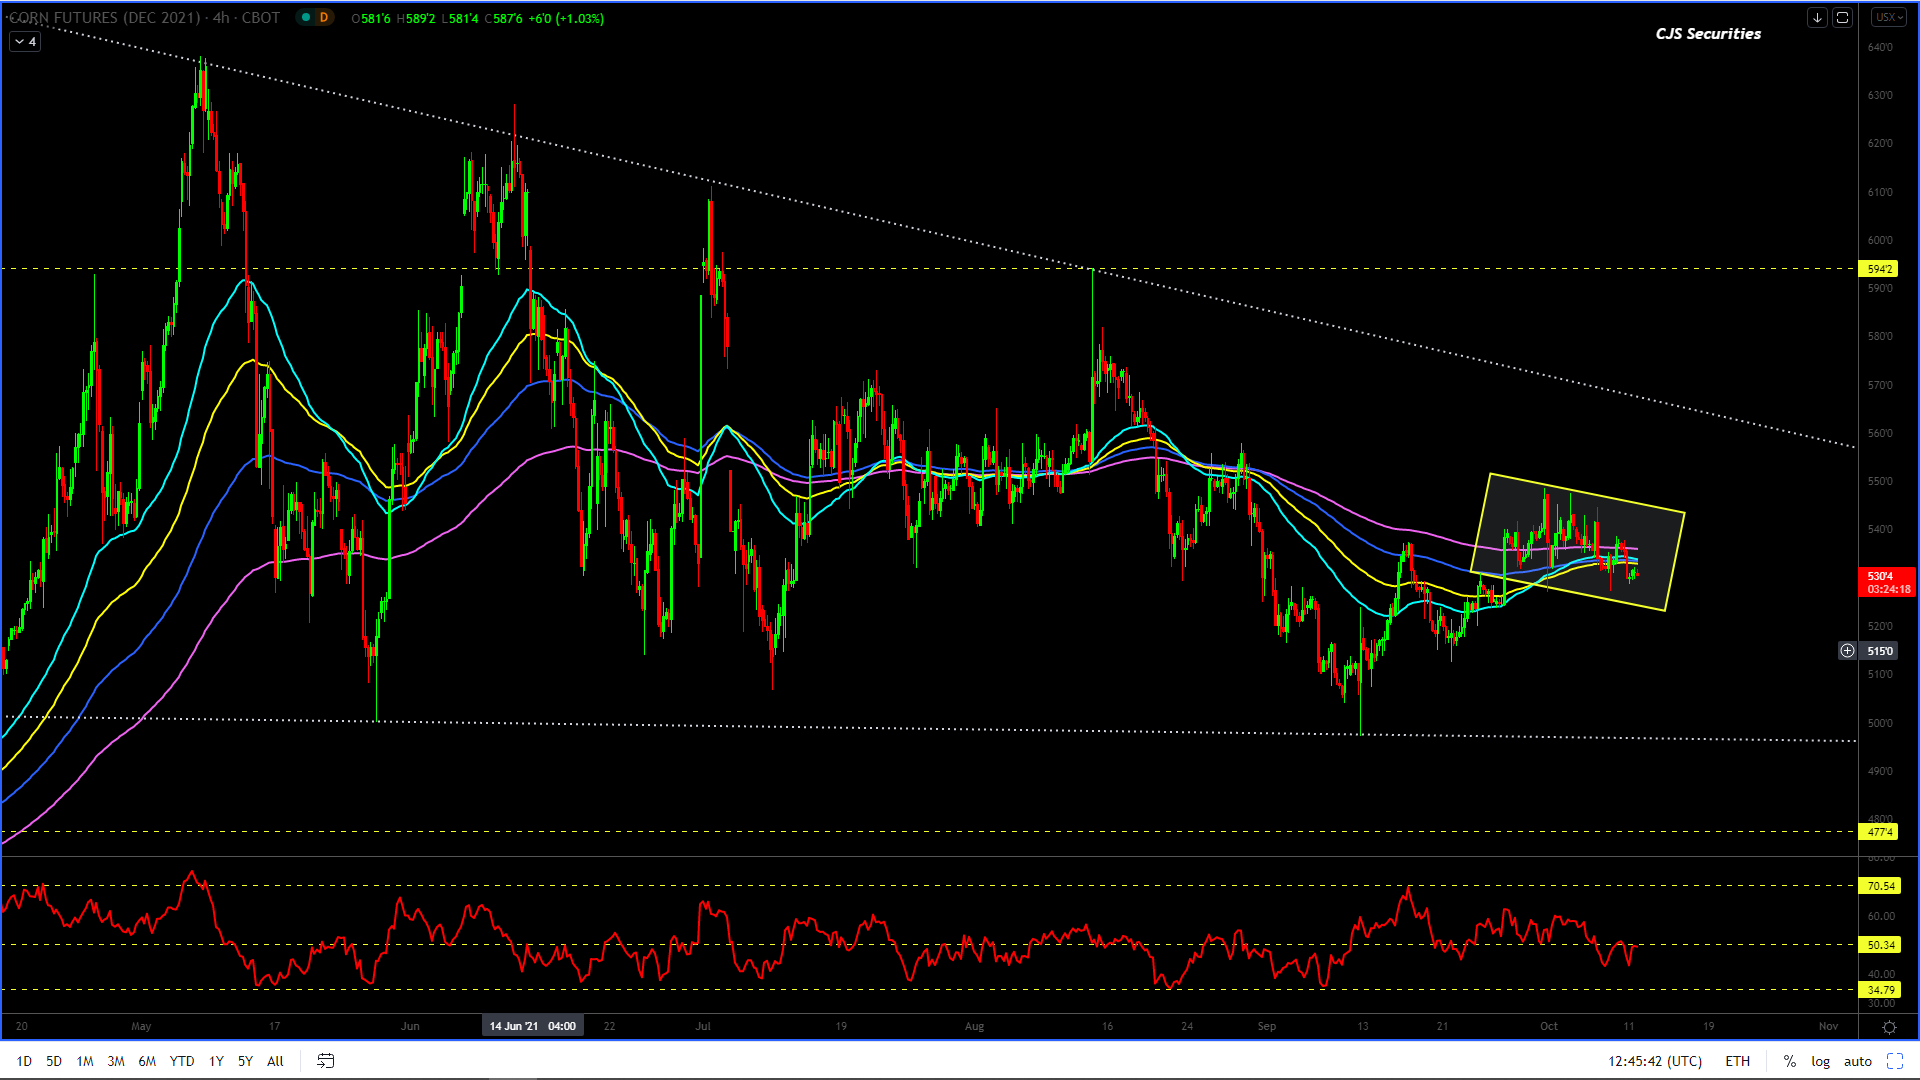
I like this chart to still trade higher and print $5.70 – $5.80, but based on the current formation I would be highly surprised to see it hold those levels, in fact should we push up toward these levels I would consider selling with a stop over $5.95 as the downside target would be sub $5.00.
In the BIGGER picture the dips remain buying opportunities potentially as low as $4.70.
I REMAIN a proponent of BTD’s and take cash on the rallies until we confirm a bull market over $6.00!.
Weekly WM Continuous Close
#Again. I cannot change any of the below commentary.
The chart looks great and the dips are still buying opportunities.
I would however take some risk off the table, as the higher we go, the pullback will be hard and fast and we do not want to be caught flat footed.
Even after the current rally off the low, the upside move has not confirmed yet but currently I feel like MT low is in!
Weekly YM Continuous Close
#No Change in Commentary.
The chart looks great and the dips remain buying opportunities.
Congratulations to all who BTD, even though the chart went a little lower than my technical comfort level.
All the pullbacks remains buying opportunities.
Once the correction is over, the correction is not over yet but its close, the chart will be looking to break out to the upside by R500 or more and make new MT highs.
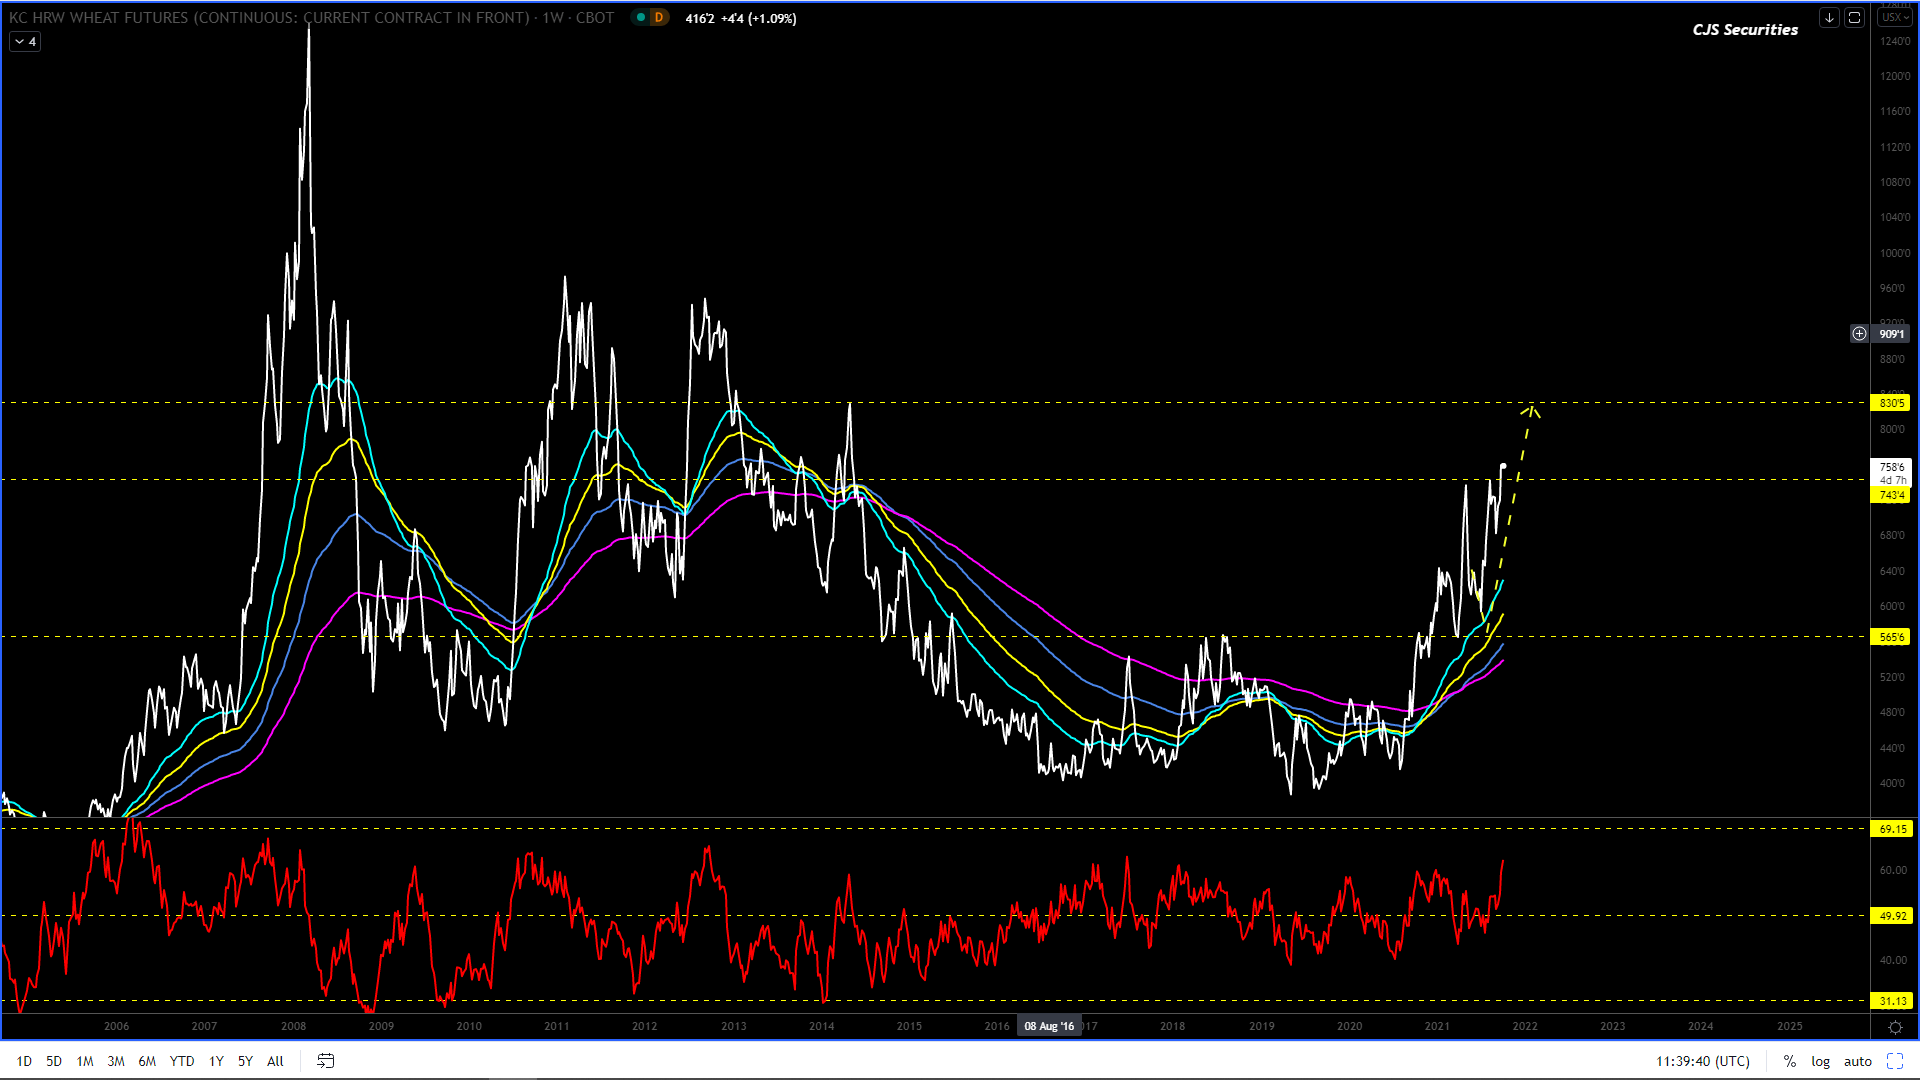
Weekly KC Wheat Continuous Close
#No Change in Commentary.
There is ZERO reason to sell this chart or take profit, as the digital asset boys say, “HOLD”!
The chart looks great and it’s a buy!
The pullback is over and we are long and waiting to make some green (hope we don’t go home broke).
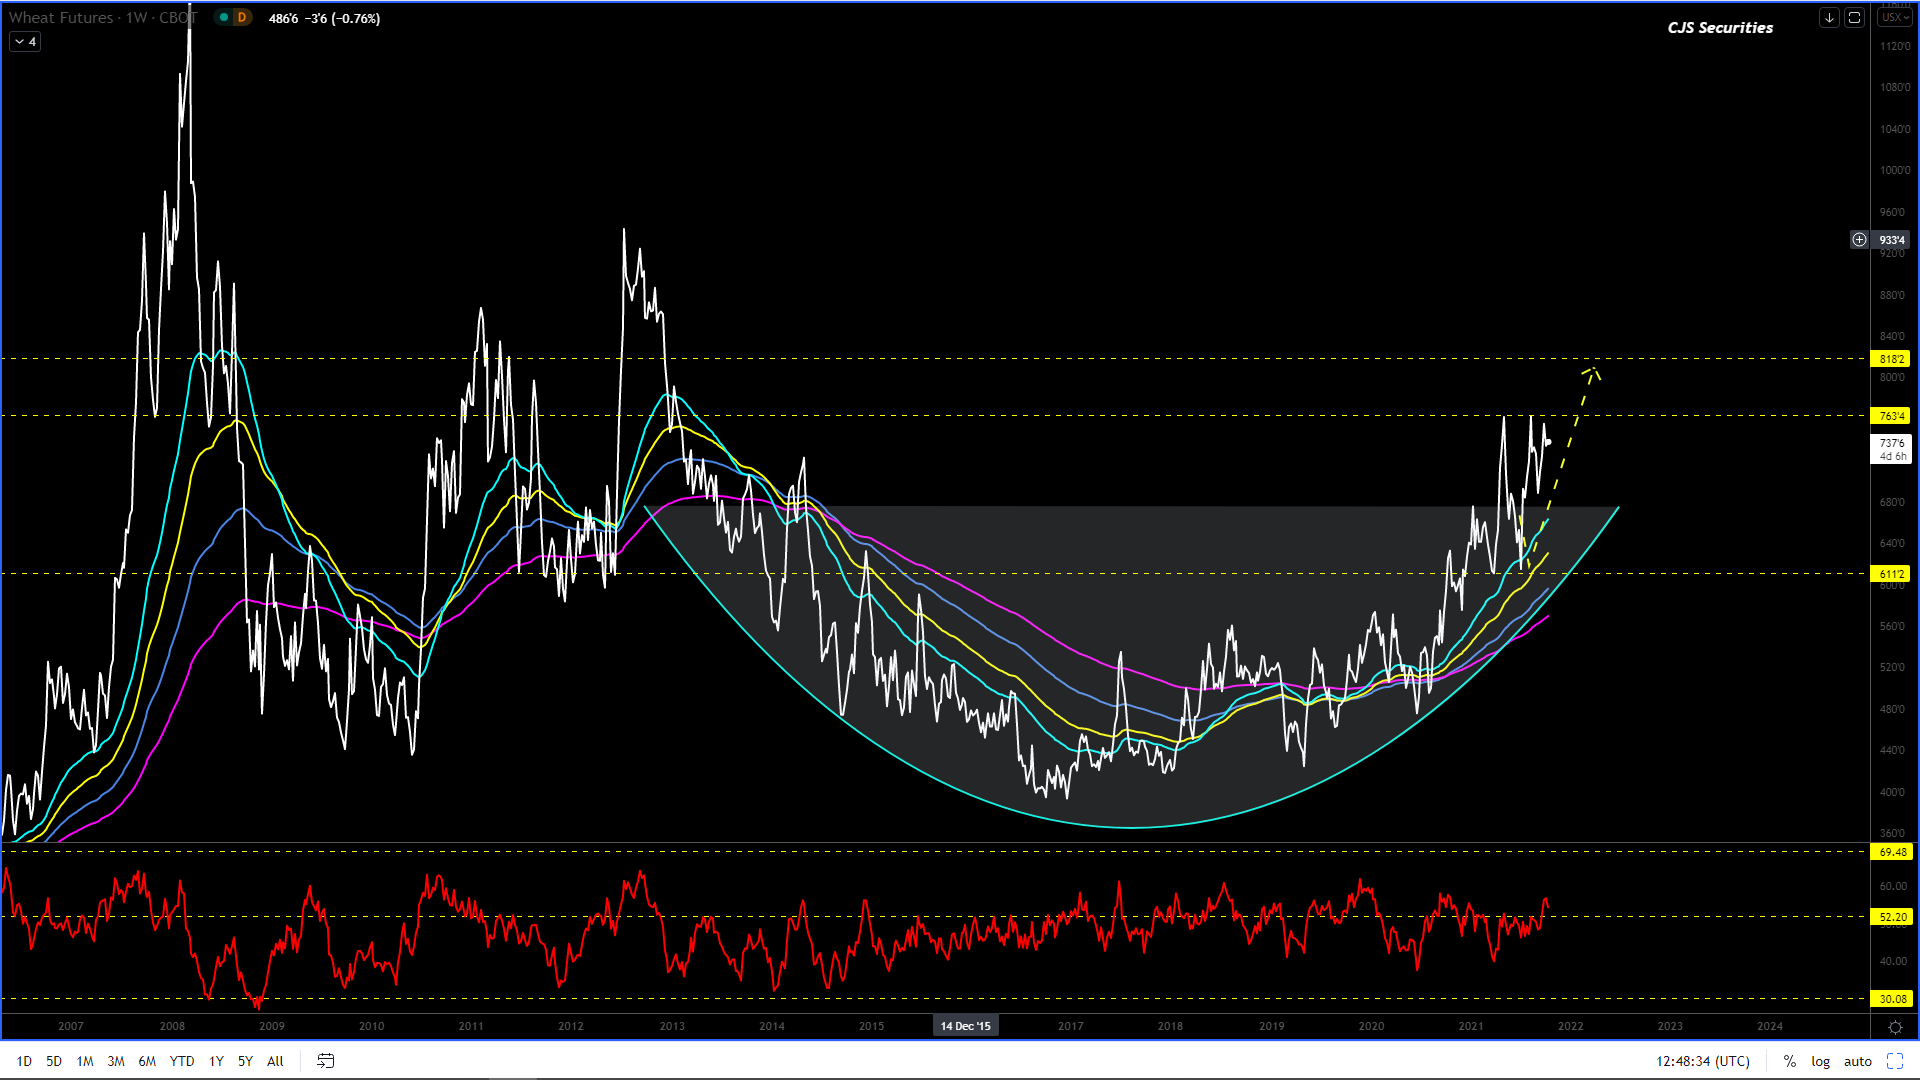
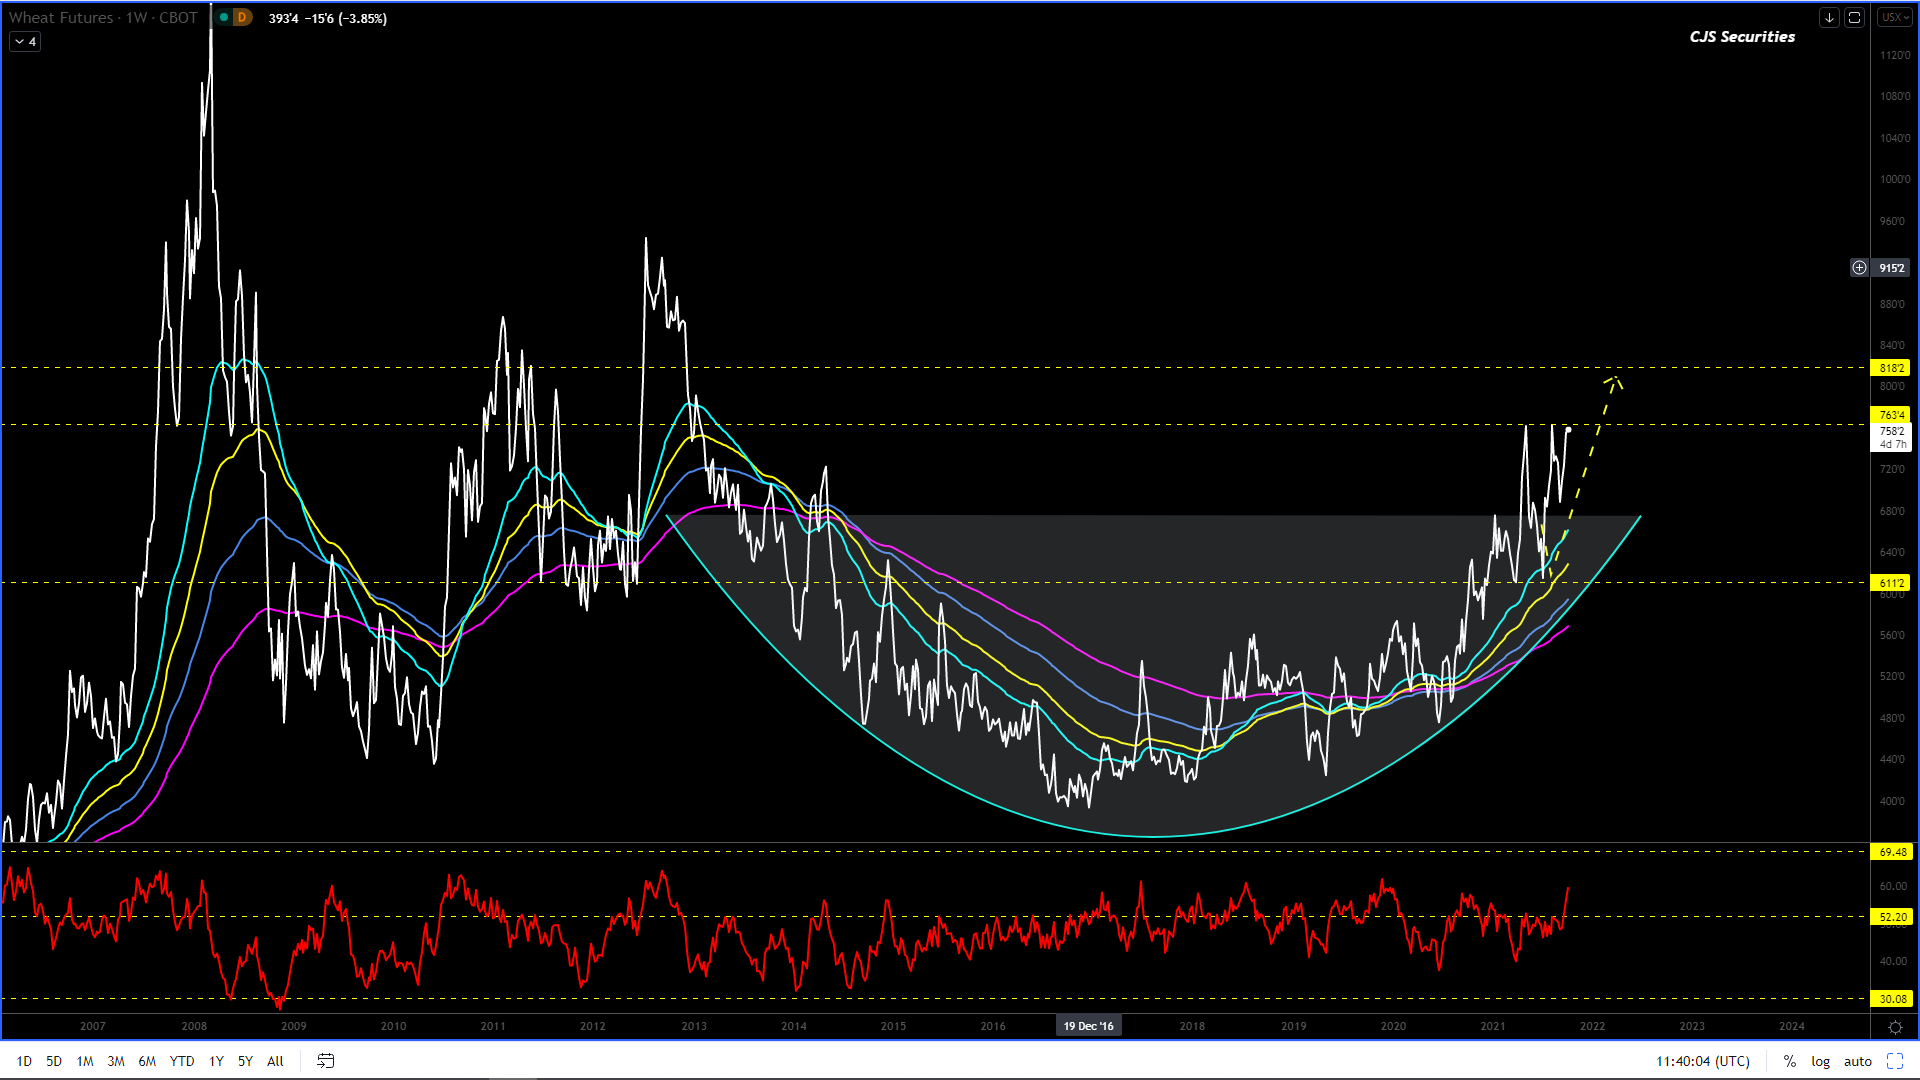
Weekly Chicago SRW Wheat Continuous
#No Change
in Commentary.
There is ZERO reason to
sell this chart or take profit, as the digital asset boys say, “HOLD”!
The pullback is over, the
chart looks great!
We are long and waiting
to make some green (hope we don’t go home broke).
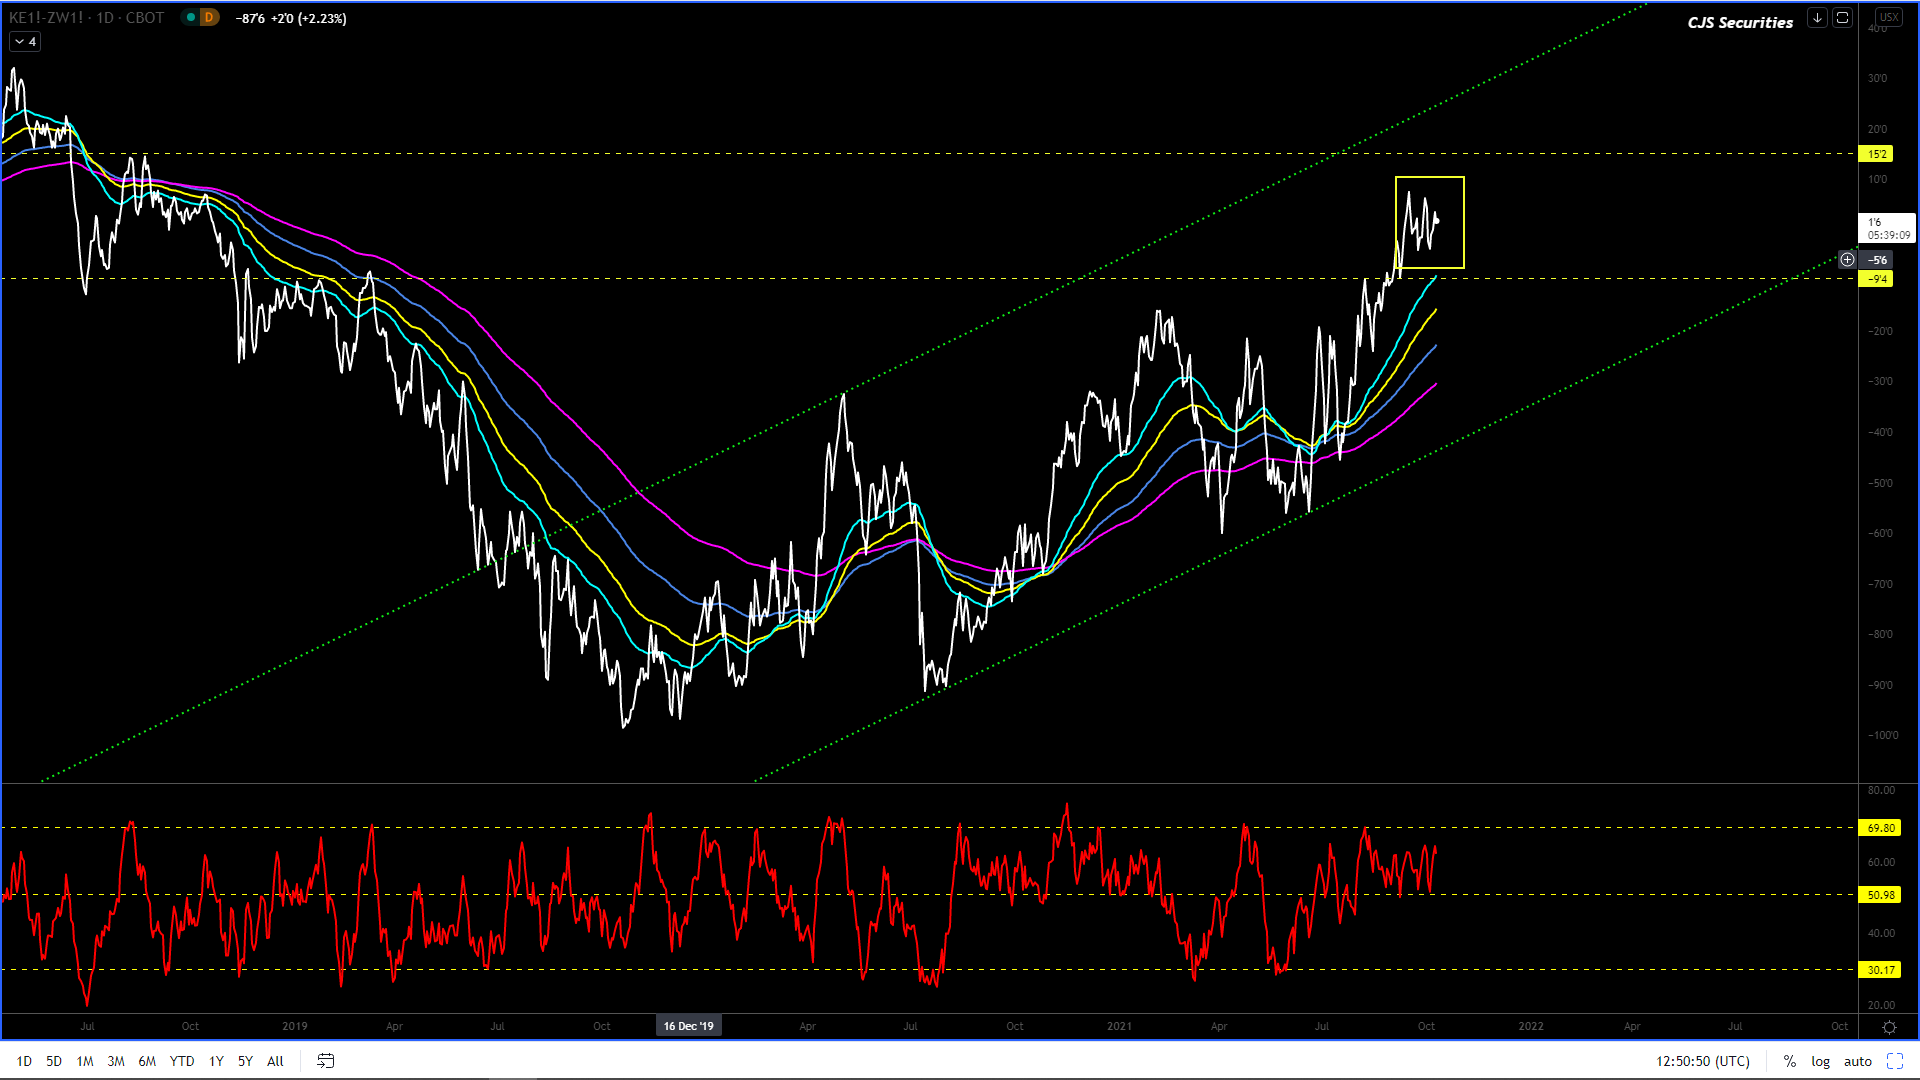
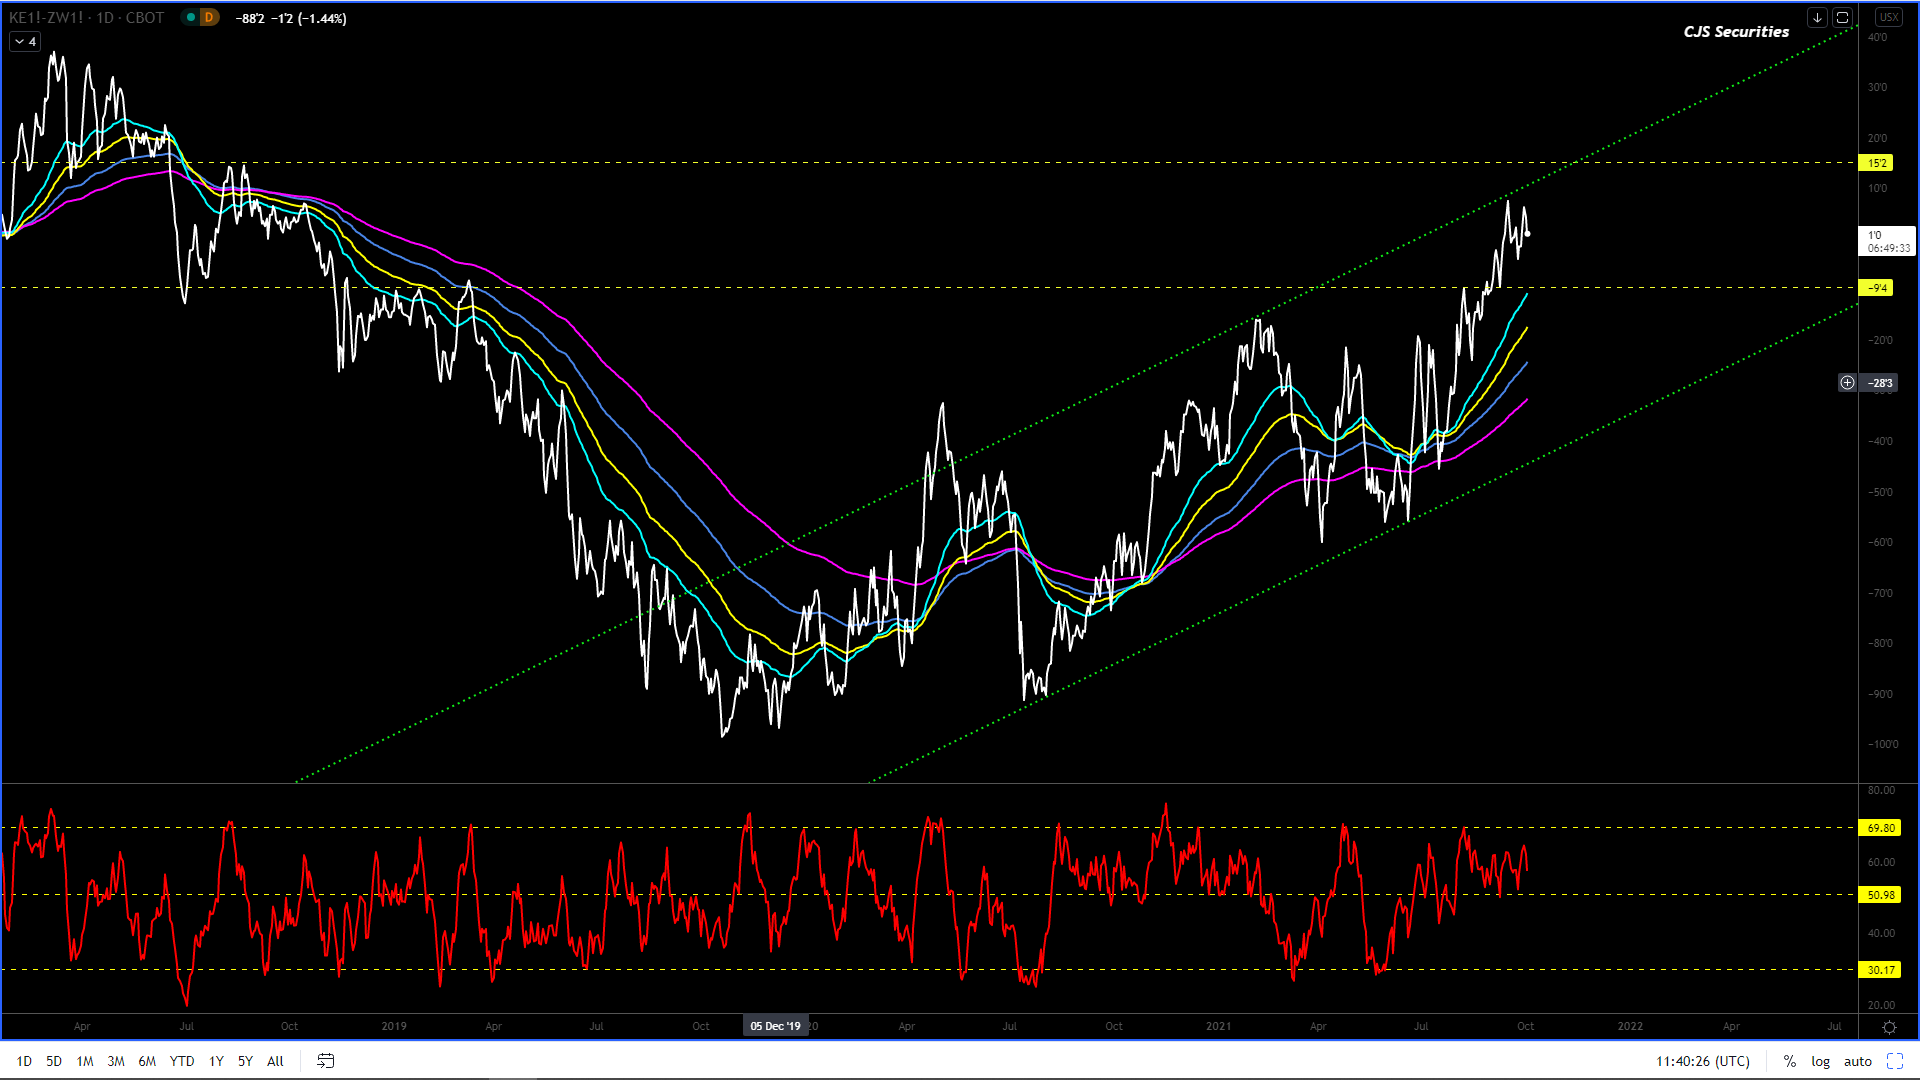
Daily Close KC Wheat v Chicago SRW Continuous Close
After hanging back, this chart is now a buy as the consolidation is ready to explode.
Targets could be as high as $0.28!
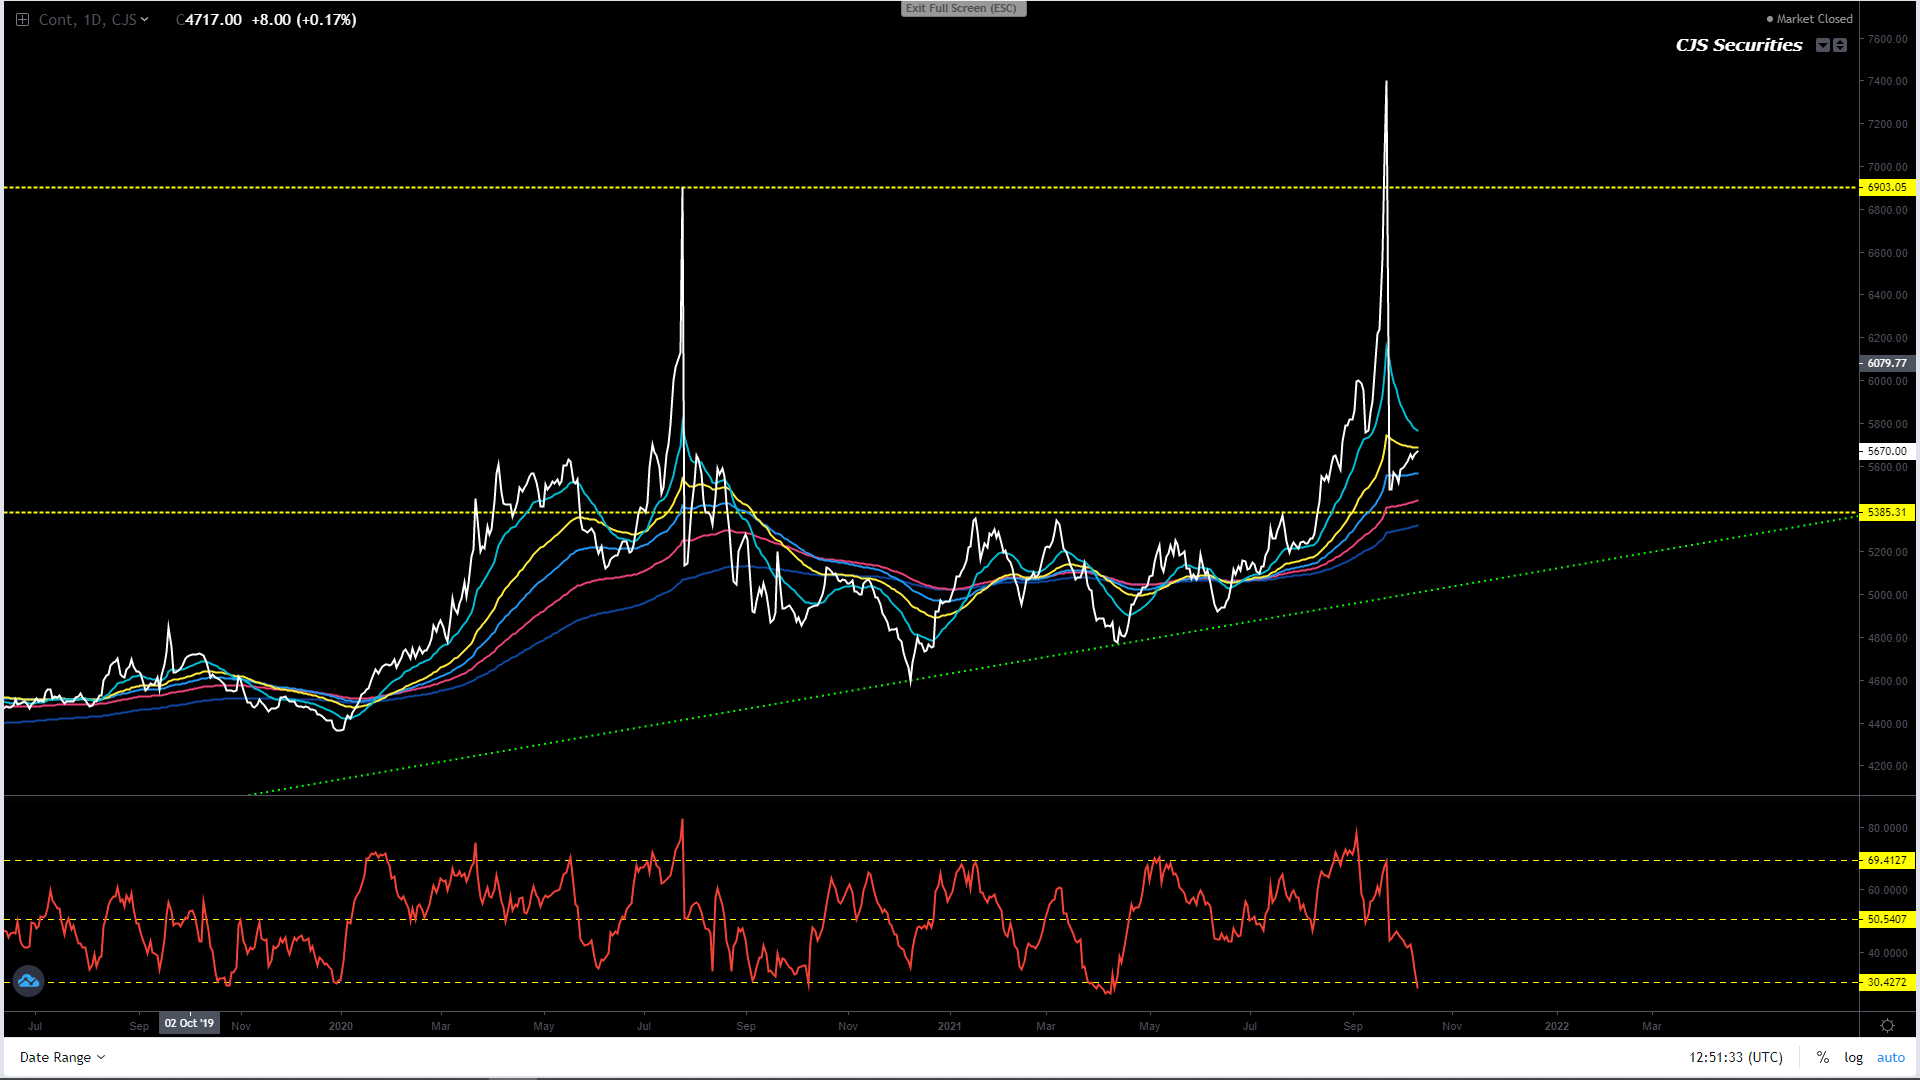
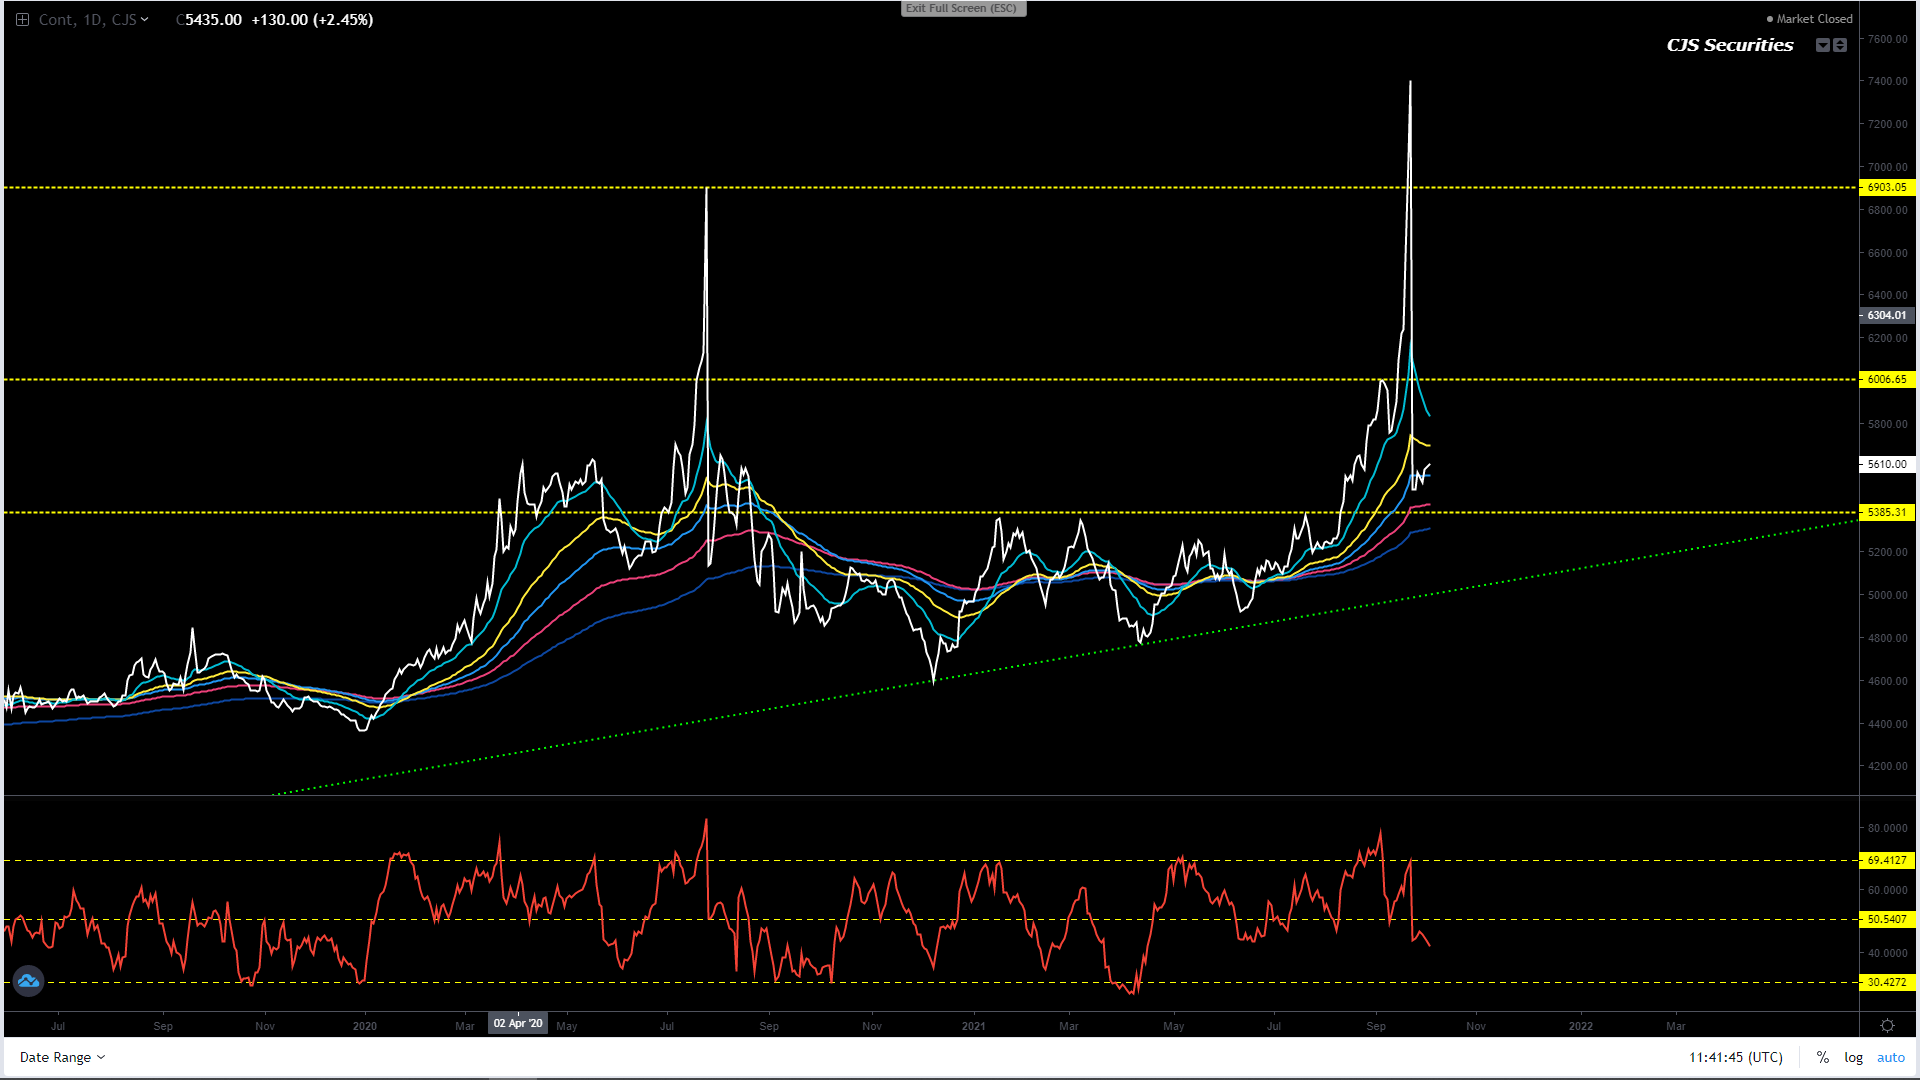
Weekly SAF Wheat Continuous Close
#No Change in Commentary.
Although this chart is distorted post the Sep 21 futures close out, I can still easily see the price rally R400 off its currently level.
I would look to buy the chart into weakness, down to R5350.
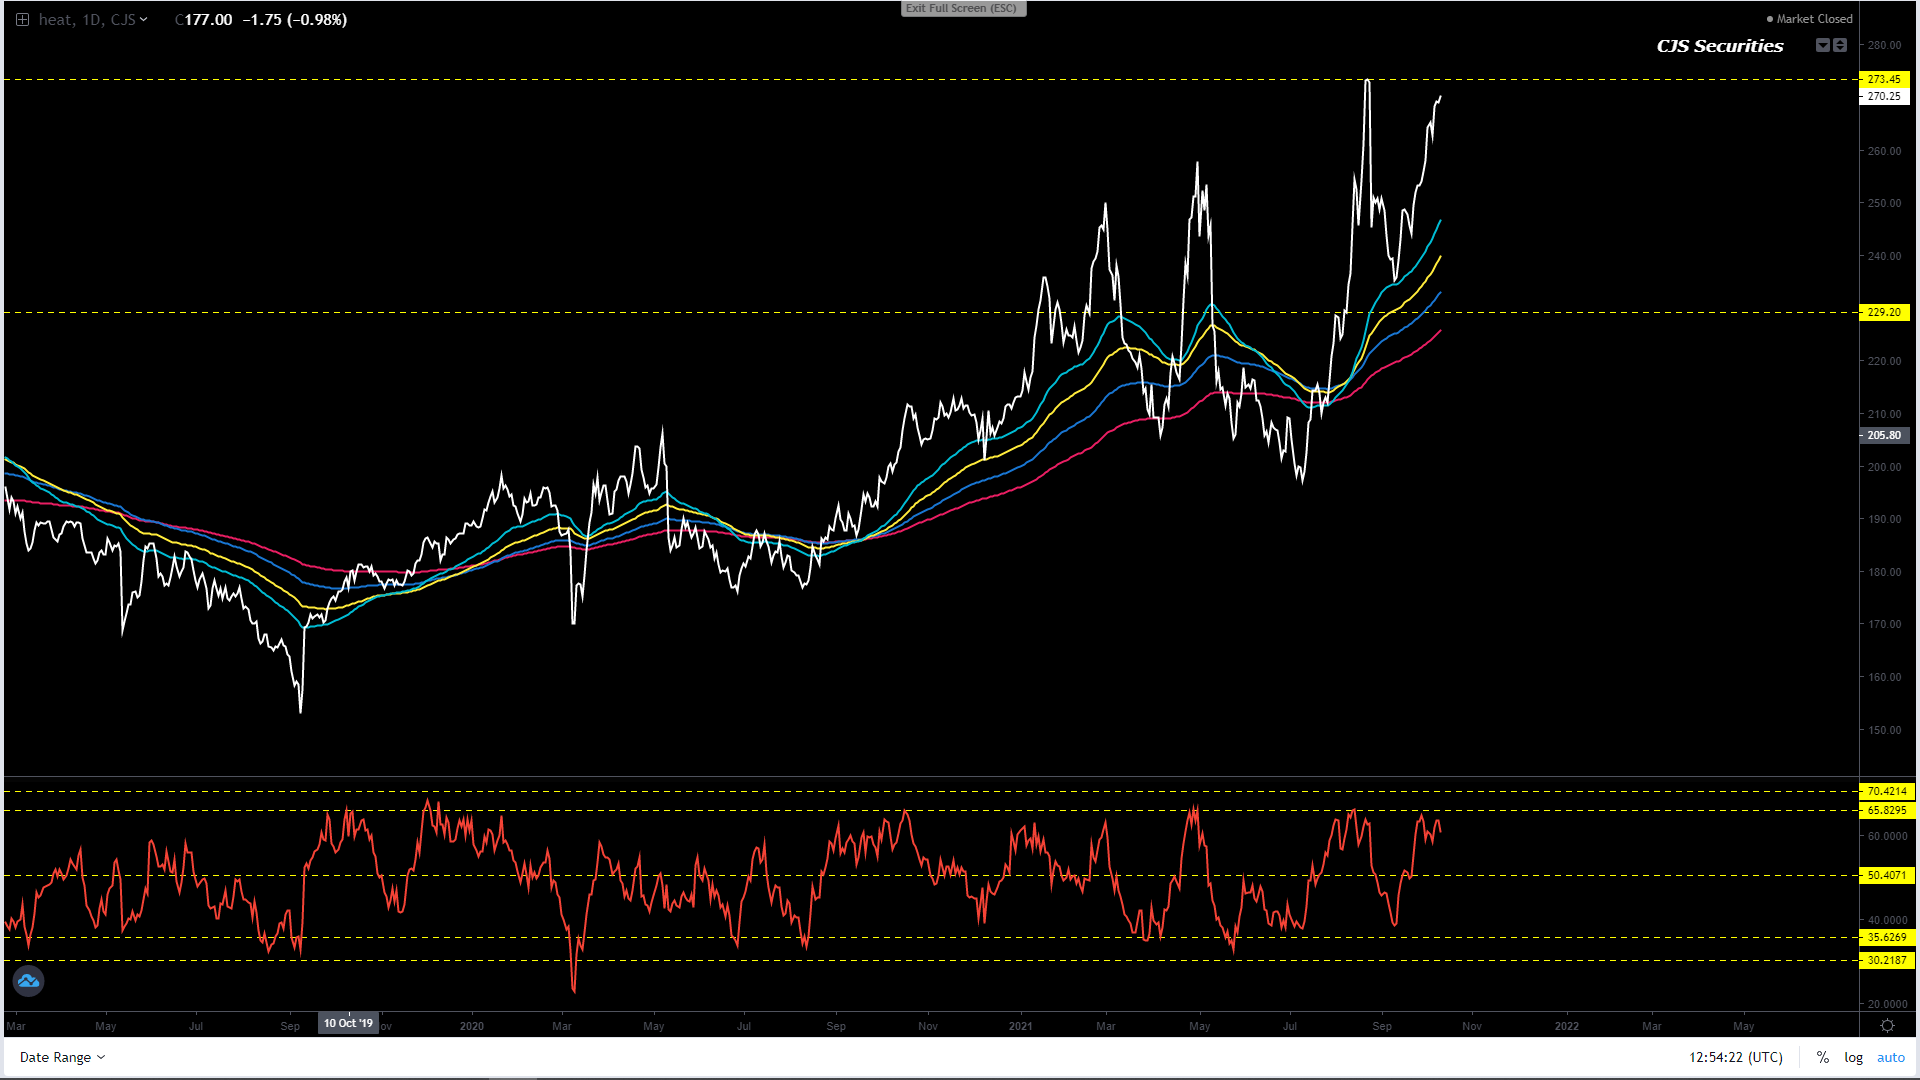
Daily Matif Wheat Continuous Close
The below view is playing
out wonderfully and we would raise our stop profit to €260.00
This chart looks decent
and we are looking to buy scale down to €235.00 as
I feel the correction is over with targets over €295.00.
If this chart has a daily
close at or just under€257.00 we will
most certainly go square as a failure at those level could see a€50.00 drop in prices.
After a range bound week the chart again struggled to settle over R15.00.
The strong resistance around the EMA’s remain very solid and even Friday’s Non – Farm Payrolls (NFP) could not give this chart any real new direction.
The trading ranges remain HUGE!
The inverted H&S formation is still in play with targets at R15.78, this is within a much bigger H&S formation which has targets at R11.77.
I have a terrible feeling that this chart will rally and suck everyone in thinking it’s the end of the world again, only to come back down to earth.
All eyes will be on US & Chinese CPI this week.
Dollar/Rand Daily Candle
I wish there was more to add to the commentary but based on the chart’s current formation I feel there is room for a downward correction toward the R14.55 level.
A move down to the R14.55 level would constitute a serious ST / MT buying opportunity IMO.
With the big inverted H&S formation playing out, Scenario #2 from now 5 weeks ago is still on the cards
Scenario #2.
The current formation is an irregular flat bear correction that trades back to the R14.20’s, then trades up hard and fast to print between R15.70 – R15.86 to complete the correction while getting everyone and their dog long USD, only to collapse and come down to test the yearly lows and possibly print as low as R11.50.
Both scenarios will have one wondering because after the ferocity of last week’s fall, there is very little confidence in this chart.
Only a daily close over R15.62 would negate scenario #2.
As with the weekly chart I am now keen to own the USD on a decent pullback that hopefully prints as low as the R14.50’s.
Opportunity beckons in Q4, I can feel it in my bones!
Dollar/Rand 240 min Candle
This chart looks like an ugly clown and with skew eyes.
Skew eyes or not the chart is consolidating / correcting and I am very keen to buy the USD scale down from R14.73.
I would now be buying scale down from R14.73 – R14.49 with a stop overR14.4650.
Targets on this view would be in excess of R15.50 and hence have a minimum RR of 32/10.
Fingers crossed we can execute.
Euro/USD Weekly Close
The $1.16 level was easily breached last week, but I am disappointed as I would have thought that the chart would strengthen significantly.
And its with this in mind that I am starting to think that the chart is creating a triangle with its next support at $1.12952.
NFP did not seem to be a market mover even though the numbers pointed to a weaker USD.
With the breach, and the market now consistently trading below $1.16, we will take a week or two before looking to enter the market again.
US Dollar Index Weekly Candle
Whiplash, while NFP did nothing to move this market.
The range REMAINS 95 -88 and a dip sub 90 is a buy of note while a rally and daily close over 95 would also get me long and until then we will sit on our hands and wait!
SA Government Bond 30 Year Yield Daily Close
With 10.30% hold beautifully, the chart has a nice rounding bottom and we could potentially look at targeting the 11.40% level.
The current formation has more than two potential outcomes and hence we are keen to stay out until we have a better view.
As predicted, the chart printing 10.90% has played out nicely and with this chart trading higher than expected, the downside at 10.30% should remain very solid.
US Government Bond 30 Year Yield Weekly Close
NFP had zero effect on this chart and the below view is playing out wonderfully!
I would look at buying a move back to 1.90% – 1.80%that will have upside targets from 2.58% – 2.71%.
Use an SL under 1.70%.
Please note that only a weekly close of over 3.50% will confirm that the trend has been broken.
This
week we have at least seen some volatility come back to the market and this
chart still has some downside before we can buy it with confidence.
This
correction remains far from over and could take a good few weeks, if not
months, to complete.
I
am now of the opinion that one should use the volatility to play the ranges and
gain confidence as holding a net long after last weeks Q4 stocks report might
just weigh heavy on the mind and the pocket!
My
new downside target is sub $12.00and potentially $11.70,
this would be a massive MT buying opportunity to say the least.
240 Min CBOT November 21 Soybean Candle Chart
This chart looks shocking and thinking it can rally hard off currently levels is like hoping the Cape will get independence.
I would sell any hard rally as a move sub $12.00 in the coming weeks, but note that sub $12.00 I would want to own it all week long and twice on a Sunday.
Board Crush Continuous Daily Close
This chart can take you to the cleaners and return your dirty!
I would stay out until further notice.
The price action now feels binary!
Oil Share Continuous Daily Close
The below view is playing out for now!
We are bullish and long but will put in a stop loss under 44%.
Weekly SAF Soy Continuous Close
#No Change in commentary.
We
are looking to buy this chart further into weakness and are “hoping” (which has
no place in trading) that this chart still prints R7000
in the coming weeks.
Weekly SAF Suns Continuous Close
The weekly double tops have been negated, all pullbacks are buying opportunities, as the bull market is far from over and over the next 8 weeks R11 000 – R12 000 could print just based on shorts that might be a little too clever!
“I would buy scale down from R9550. – this is aging pretty well for now.” – this month old view is aging like Riaan Cruywagen!
Weekly CBOT Soy Oil Continuous Close
#No Change in Commentary
I am super bullish and starting to wonder if the energy / power issues in China will transpire as the trigger for the below number to play out?
I feel the correction is done, (I feel good about this one) and all the pullbacks from here are buying opportunities with upside targets between $0.85 -$0.89!
I almost feel that we don’t have enough cash to get as long as we should, buy at best and scale down, this is budget making stuff with sprinkling of retirement!!!!
Weekly CBOT SBM Continuous Close
I
am now starting to feel like I have Stockholm syndrome.
After
this week I am packing my bags and leaving, In hope.
In
all seriousness though this chart is currently very unfriendly and the $325level will
need to hold if this chart has any chance of rallying.
The great formation remains a correction but we are now headed higher.
The upside targets are between $5.70 – $5.80 on the Z21 contract.
Please note that I do not feel the correction is over until we have a weekly close over $6.42, while I would only consider the Bull story to be over should we have a Weekly close under $4.56.
Until then trade the ranges, use the market volatility to build your confidence and don’t get married to a view as regret is a rough sheet to sleep on!
I REMAIN really bullish in the “big picture” but, we could easily see this market come off after trying to print $5.70, so in short you may well have the chance to get long sub $5.00!
240 Min December 21 Corn Candle Chart Close
I like this chart to still trade higher and print $5.70 – $5.80, but based on the current formation I would be highly surprised to see it hold those levels, in fact should we push up toward these levels I would consider selling with a stop over $5.95 as the downside target would be sub $5.00.
In the BIGGER picture the dips remain buying opportunities potentially as low as $4.70.
I REMAIN a proponent of BTD’s and take cash on the rallies until we confirm a bull market over $6.00!.
Weekly WM Continuous Close
I cannot change any of the below commentary.
The chart looks great and the dips are still buying opportunities.
I would however take some risk off the table the higher we go as a pullback will be hard and fast and we do not want to be caught flat footed.
Even after the current rally off the low, the upside move has not confirmed but currently I feel like MT low is in!
Weekly YM Continuous Close
The chart looks great and the dips remain buying opportunities.
Congratulations to all who BTD, even though the chart went a little lower than my technical comfort level.
All the pullbacks remains buying opportunities.
Once the correction is over, the correction is not over yet but its close, the chart will be looking to break out to the upside by R500 or more and make new MT highs.
Weekly KC Wheat Continuous Close
There is ZERO reason to
sell this chart or take profit, as the digital asset boys say, “HOLD”!
The chart looks great and
it’s a buy!
The pullback is over and
we are long and waiting to make some green (hope we don’t go home broke).
Weekly Chicago SRW Wheat Continuous
There is ZERO reason to sell this chart or take profit, as the digital asset boys say, “HOLD”!
The pullback is over, the chart looks great!
We are long and waiting to make some green (hope we don’t go home broke).
Daily Close KC Wheat v Chicago SRW Continuous Close
I am now keen to hang back for a week or two as this chart could be looking at consolidating before going higher.
I will happily ring the bell should we look to get in again.
Weekly SAF Wheat Continuous Close
Although this chart is distorted post the Sep 21 futures close out, I can still easily see the price rally R400 off its currently level.
I would look to buy the chart into weakness, down to R5350.
Daily Matif Wheat Continuous Close
The below view is playing
out better than a Fast and Furious sequel and I could not be happier!
This chart looks decent
and we are looking to buy scale down to €235.00 as
I feel the correction is over with targets over €295.00.
If this chart has a daily
close at or just under€257.00 we will
most certainly go square as a failure at those level could see a€50.00 drop in prices.
After what feels like a more subdued week the market struggled to settle over R15.00.
The chart has run into some very strong resistance around the EMA’s and as it stands I am now looking for a pullback in the next week or two.
The trading ranges remain HUGE!
The inverted H&S formation is still in play with targets at R15.78, this is within a much bigger H&S formation which has targets at R11.77.
Good luck and DO NOT get sucked into market volatility right now and remember you do not have to have a position.
All eyes will be on Friday’s Non- Farm Payrolls!
Dollar/Rand Daily Candle
Based on the charts current formation I feel there is room for a downward correction toward the R14.55 level.
With the big inverted H&S formation playing out Scenario #2 from now 4 weeks ago is still on the cards.
Scenario #2.
The current formation is an irregular flat bear correction that trades back to the R14.20’s, then trades up hard and fast to print between R15.70 – R15.86 to complete the correction while getting everyone and their dog long USD, only to collapse and come down to test the yearly lows and possibly print as low as R11.50.
Both scenarios will have one wondering because after the ferocity of last week’s fall, there is very little confidence in this chart.
Only a daily close over R15.62 would negate scenario #2.
As with the weekly chart, I would not hold any position now for more than R0.30.
Please don’t wipe yourself out as there will still be plenty of opportunities to come before year-end.
Dollar/Rand 240 min Candle
The chart has struggled to maintain momentum above R15.00 over the last week, and although I am not very bearish with the current formation I could easily see the chart trade back to the R14.50’s.
This view from last week fell short with R0.01, a tragedy if there ever was one. –“Right now the only trade I would put on is selling up scale from R15.14 – R15.20 with a stop overR15.2350. “
Although I am itching to put on a trade, I don’t see any decent levels which will provide a sufficient RR.
For those that must trade I would be short close to R15.00 and long sub R14.55.
Euro/USD Weekly Close
The $1.16 level is holding on by a thread and with Non-Farm Payrolls out this week.
I would suggest keeping a tight stop sub $1.16 until we have clarity.
I still like a move higher but knowing where I am wrong is far more important than being right!
The general view remains long the EURO until we have a daily close under $1.16!
US Dollar Index Weekly Candle
Whiplash, and plenty of it as false breaks abound.
With Non -Farm Payrolls due out o Friday I would leave this chart well alone until then unless we see a move sub 90.
The range REMAINS 95 -88 and a dip sub 90 is a buy of note while a rally and daily close over 95 would also get me long also and until then we will sit on our hands and wait!
SA Government Bond 30 Year Yield Daily Close
#No Change in Commentary
This 10.30% level is sticky as hell, but if it does not hold, then there will still be a decent amount of downside in this chart over the next 12 months.
The ending diagonal formation will be off the table under 10.20%, and right now, I must confess that 9.22% looks very much on the charts.
Having said all of the above, don’t panic!
The chart is now oversold but can continue lower before kicking, but overall, I would expect a kickback to 10.90% before printing the 9.22%, so you should have time, at least I hope so! – ‘I truly hope this ages well.’
US Government Bond 30 Year Yield Weekly Close
With Non – Farm Payrolls out on Friday who knows where we head in the ST, but the below view is playing out nicely, albeit for now.
I would look at buying a move back to 1.90% – 1.80%that will have upside targets from 2.58% – 2.71%.
Use an SL under 1.70%.
Please note that only a weekly close of over 3.50% will confirm that the trend has been broken.
Another week of zero volatility with no change in the below commentary.
This correction remains far from over and could take a good few weeks, if not months, to complete.
Use all the rallies to take profit but keep a core long as the major trend/cycle is up.
Please don’t chase this market as technically there are BULL traps being set everywhere!
If you are lucky enough to see a move sub $12.40 (November 21), own it for the LT.
240 Min CBOT November 21 Soybean Candle Chart
#No Change in Commentary
After printing $12.63 this chart looks set to rally to the $13.40 level.
However, I highly doubt this is the start of the “new” bull market and feel we should trade lower after the ST rally.
BTD until sub $11.80 should we get there.
Board Crush Continuous Daily Close
This chart is as ugly as anything I have seen and I would stay out until further notice.
TBH, I would not be surprised to see this chart come off from current levels.
Oil Share Continuous Daily Close
#No Change in Commentary
We are bullish and long but will put in a stop loss under 44%.
Overall I do not trust the current formation.
Weekly SAF Soy Continuous Close
#No Change in commentary.
We
are looking to buy this chart further into weakness and are “hoping” (which has
no place in trading) that this chart still prints R7000
in the coming weeks.
Weekly SAF Suns Continuous Close
I love this chart with new ATH’s coming soon and TBH who knows how high this could go!
The chart has nice weekly double tops, but the overall formation is there to make a new high, while all pullbacks are buying opportunities, as the bull market is far from over.
I would to buy scale down from R9550. – this is aging pretty well for now.
Weekly CBOT Soy Oil Continuous Close
I am super bullish and starting to wonder if the energy / power issues in China will transpire as the trigger for the below number to play out?
I feel the correction is done, (I feel good about this one) and all the pullbacks from here are buying opportunities with upside targets between $0.85 -$0.89!
I almost feel that we don’t have enough cash to get as long as we should, buy at best and scale down, this is budget making stuff with sprinkling of retirement!!!!
Weekly CBOT SBM Continuous Close
My SBO view and SBM views have converged and buying right here and into weakness is all I will do!
I am starting to wonder if the energy / power issues in China will transpire as the trigger for my bullish view to play out?
Nothing happened on this chart the whole last week, so the below is as relevant now as it was 2 weeks ago.
The chart remains in a corrective phase with very little movement over the last 3 weeks.
The correction will only break with a weekly close over $6.42.
I would only consider the Bull story to be over should we have a Weekly close under $4.56.
Until then, all the deep dips REMAIN buying opportunities.
The rallies remain selling opportunities (profit taking only) and the dips remain buying opportunities (getting long)!
I REMAIN really bullish in the “big picture” but, we could easily see this market come off after trying to print $5.70, so in short you may well have the chance to get long sub $5.00!
240 Min December 21 Corn Candle Chart Close
Unlike the “World Chumps”
who don’t seem to believe in themselves, I believe that this chart is headed
toward the $5.55level.
The market psychology
behind this is mainly to make every one nervous who has been sitting back
waiting to buy under $5.00, this is
psychological warfare on a grand scale.
The downside dips remain
buying opportunities potentially as low as $4.70.
I REMAIN a proponent of BTD’s and take cash on the
rallies until we confirm a bull market over $6.00!.
Weekly WM Continuous Close
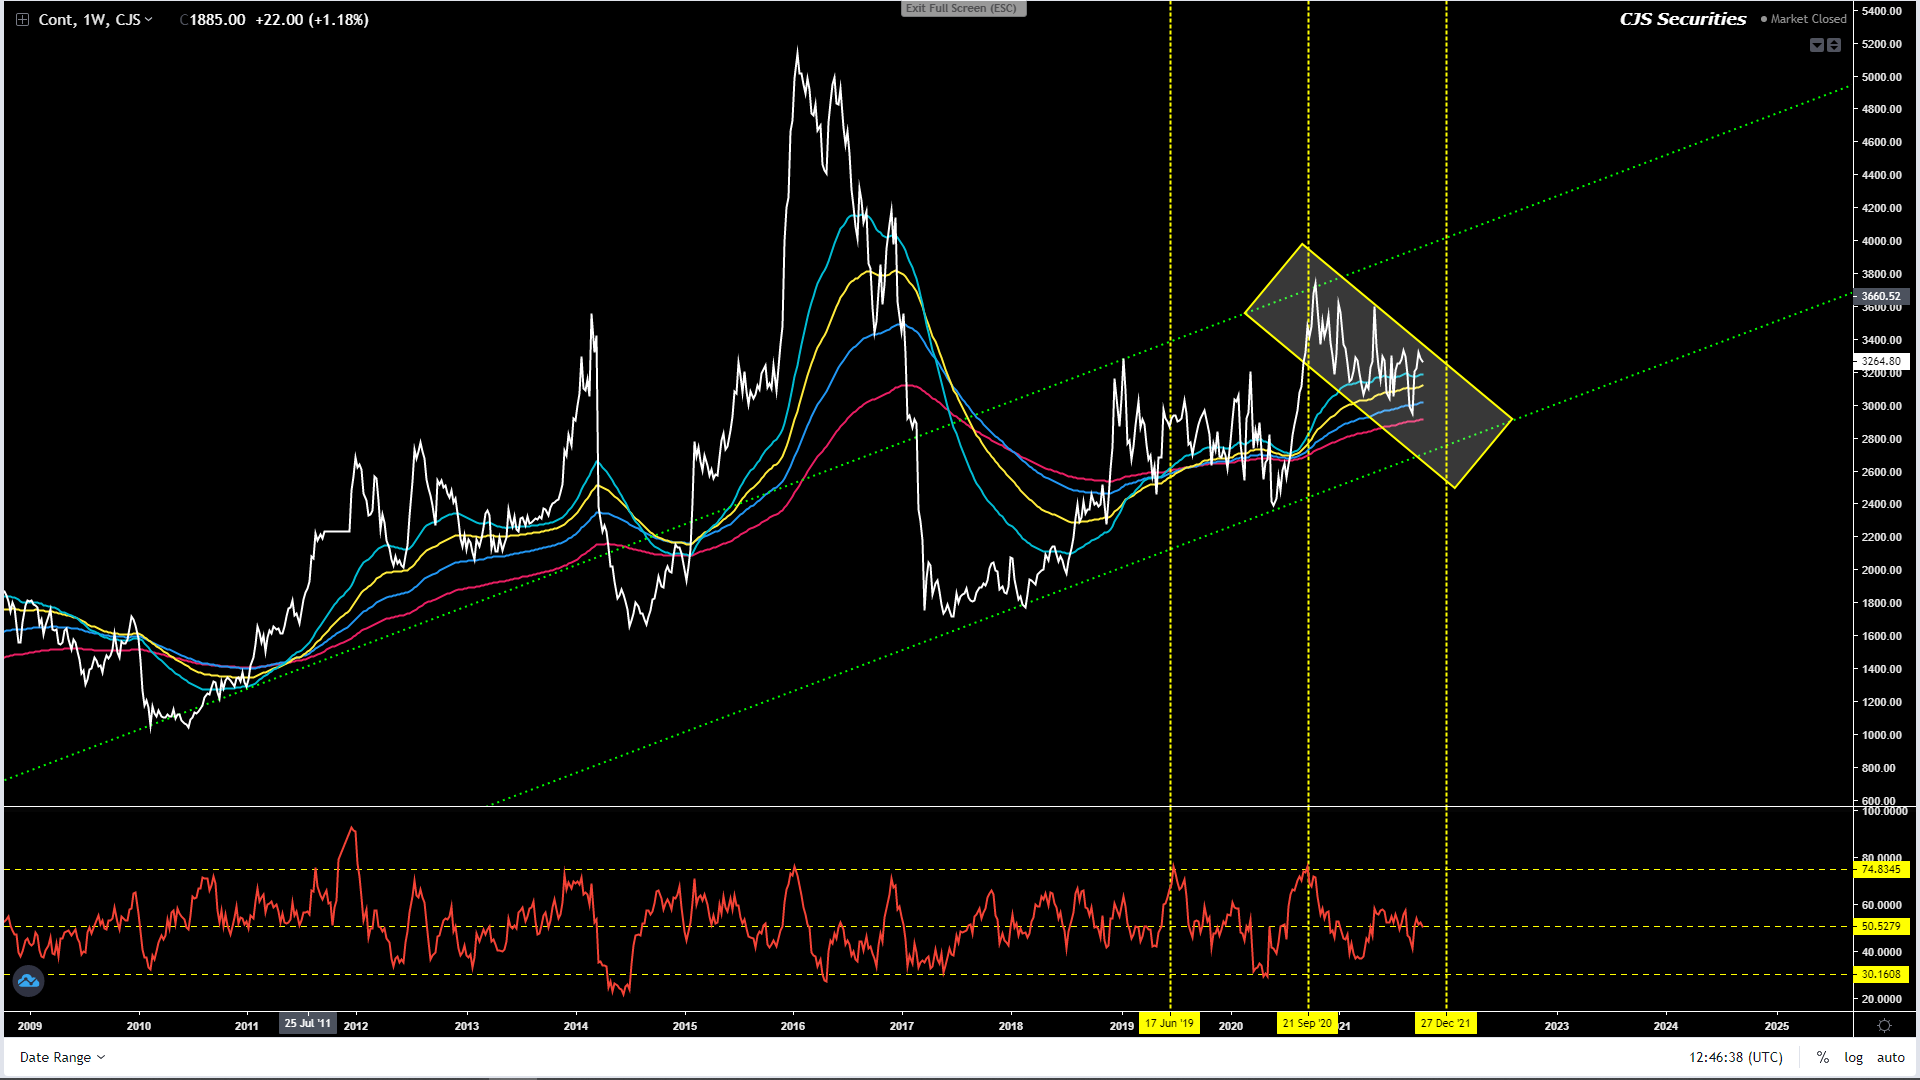
The chart looks great and the dips are still buying opportunities.
After sounding like a broken record on BTD’s and congratulations to those who did, I would look at taking some cash off the table and making room to buy another dip as the market could look to pullback some within the next week.
However, all the dips remain buying opportunities and R2800 (DEC21) will be on the very low side should we get there with R2700 looking like the bottom of the range on the spot month.
The upside move has not confirmed yet, but currently I feel like MT low is in!
Weekly YM Continuous Close
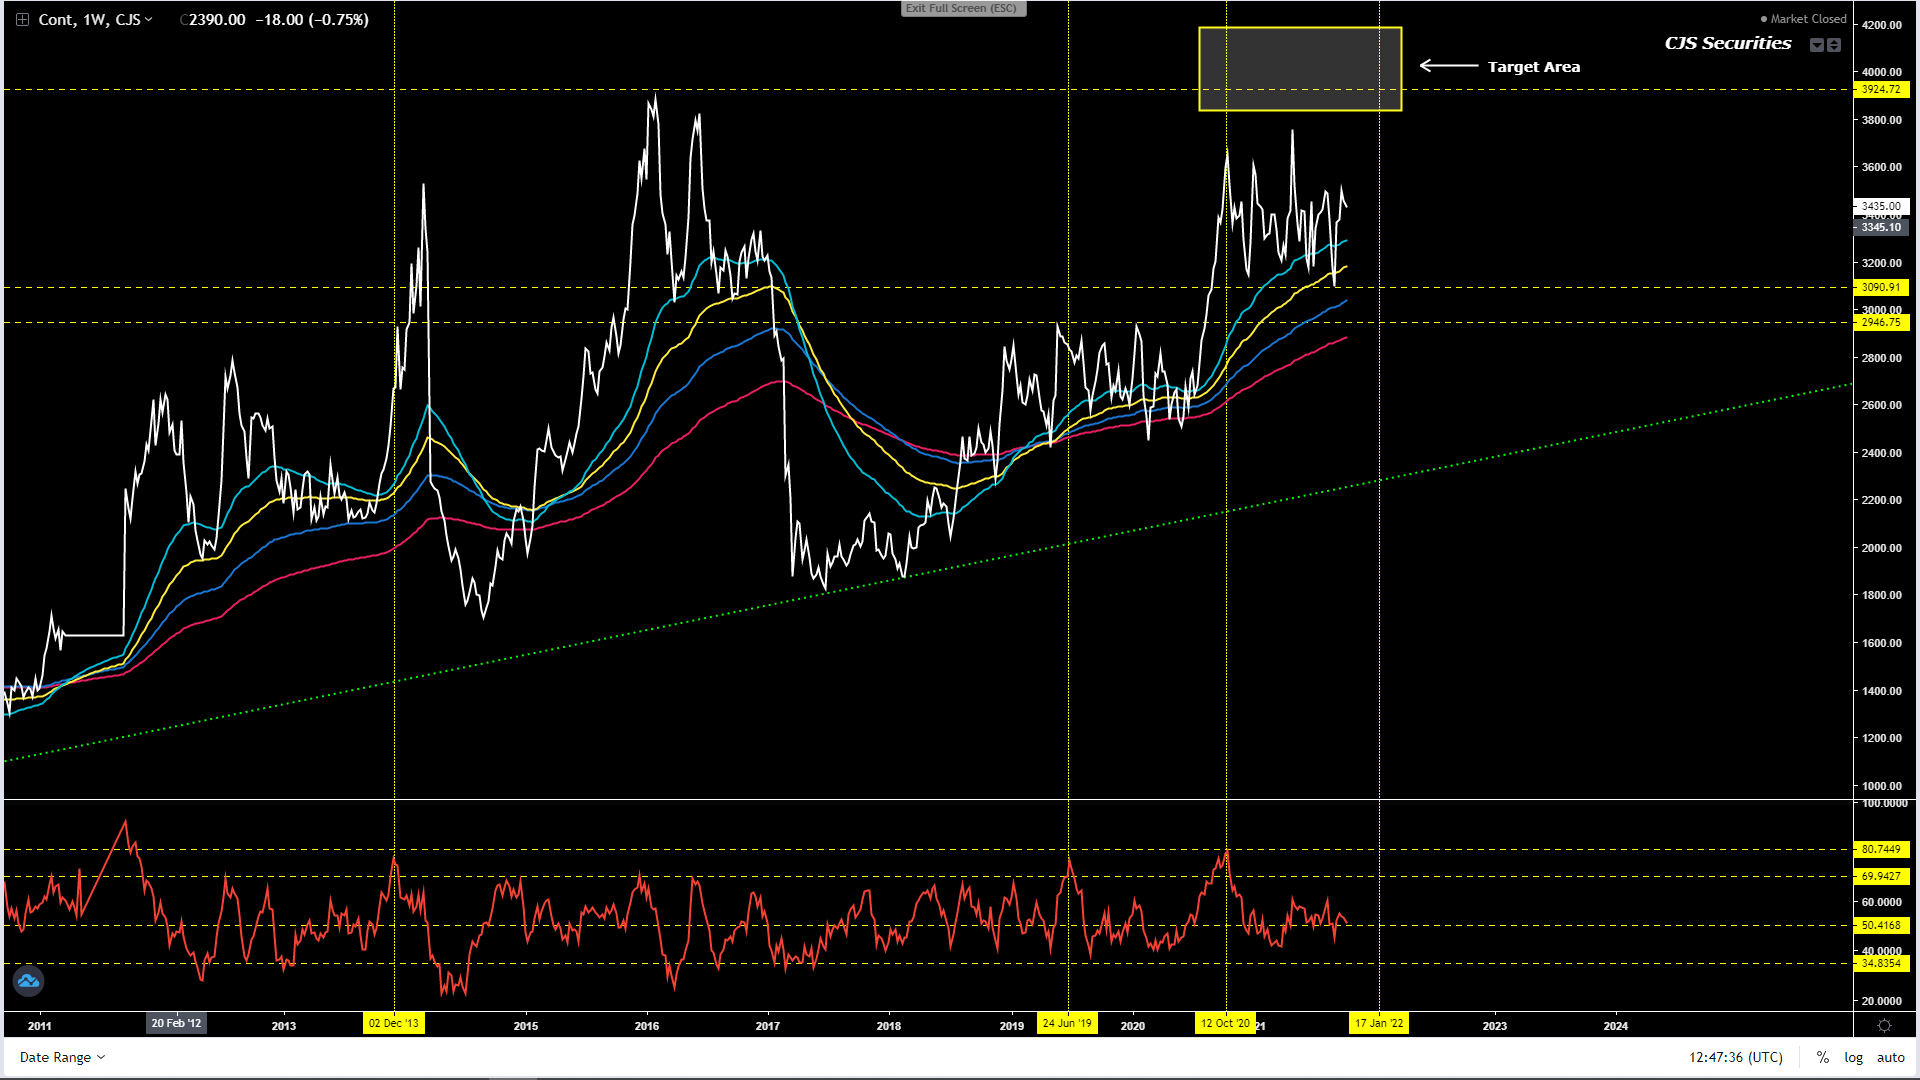
The chart looks great and the dips remain buying opportunities.
Congratulations to all who BTD, even though the chart went a little lower than my technical comfort level.
All the pullbacks remains buying opportunities.
Once the correction is over (the correction is not yet over) the chart will be looking to break out to the upside by R500 or more and make new MT highs
Weekly KC Wheat Continuous Close
The chart looks great and it’s a buy!
The pullback is over and we are long and waiting to make some green (hope we don’t go home broke).
Weekly Chicago SRW Wheat Continuous
The pullback is over, the chart looks great!
We are long and waiting to make some green (hope we don’t go home broke).
Daily Close KC Wheat v Chicago SRW Continuous Close
I would put in a trailing stop at -$0.09 as this chart might be over, if its not the $0.15 is still on the cards.
Overall, though once this trade is done, we will be sitting out for a few weeks.
Weekly SAF Wheat Continuous Close
This chart is distorted and we will now have to wait a few weeks for this chart to play out until taking a view.
Daily Matif Wheat Continuous Close
This chart looks decent
and we are looking to buy scale down to €235.00 as
I feel the correction is over with targets over €295.00.
If this chart has a daily
close at, or just under€257.00 we will
most certainly go square as a failure at those level could see a€50.00 drop in prices.