Whether the low is in or not, as previously mentioned, only a rally and Weekly Close over $13.02 will get me excited.
One should use the volatility to play the ranges with a bias to building a decent long sub $12.00!– I hope many of you played ball sub $12.00as we printed $11.84.
Most should be long at really good levels sub $12.00 and for those that know the crypto markets the best advice I can give right here, right now is to hold and buy more on the way down as the price action is starting to look very much like it wants to print $11.50.
240 Min CBOT November 21 Soybean Candle Chart
In
the big picture, this chart and its formation are set to rally.
The
only question is, does it make a new low?
I
hope you all repurchased your long positions on the last dip even though:
“I
don’t like this formation and although it can trade higher this chart needs and
should see another leg lower.
Keep
BTD’s and play the ranges until we have a move and close over $13.08when the
bull market confirms.
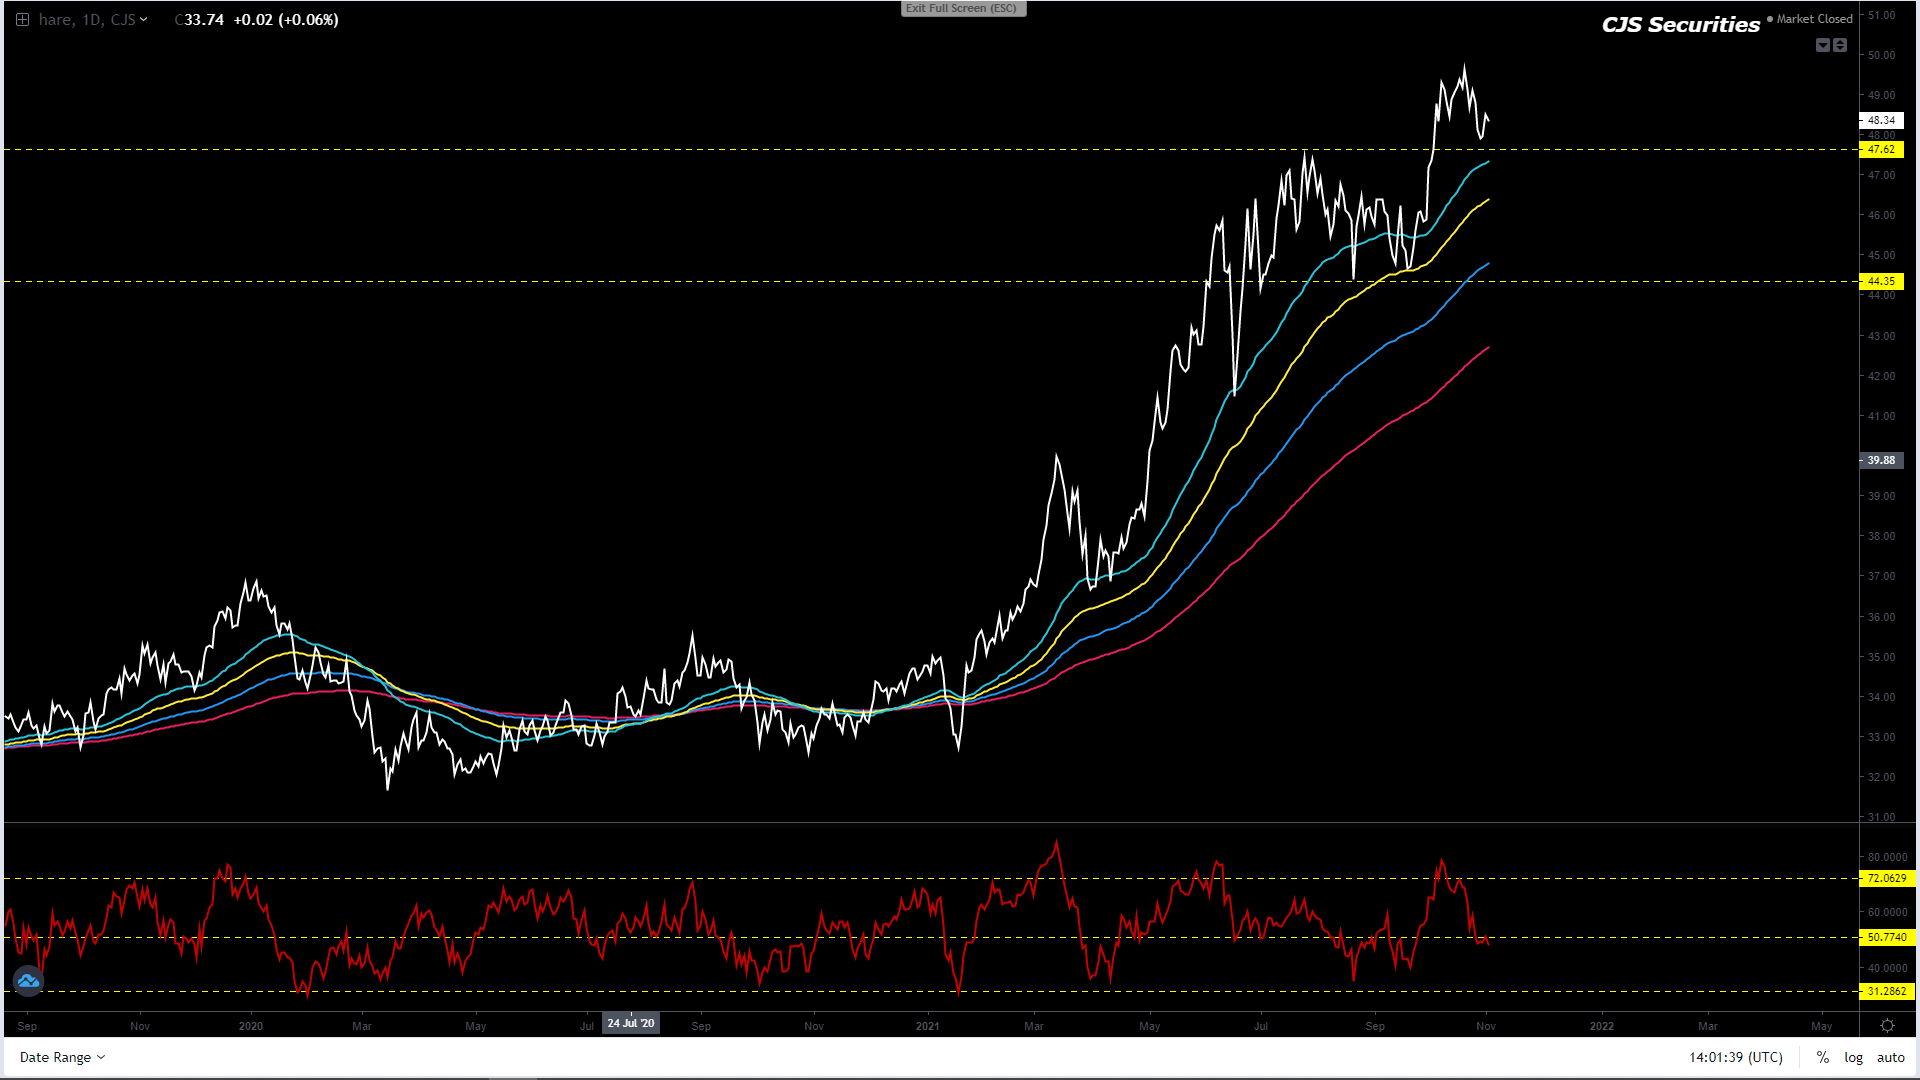
Board Crush Continuous Daily Close
This chart is mental, and all I can say is that it’s now overbought, but who knows just how high it can go, not me!
We are happy to sit out for now.
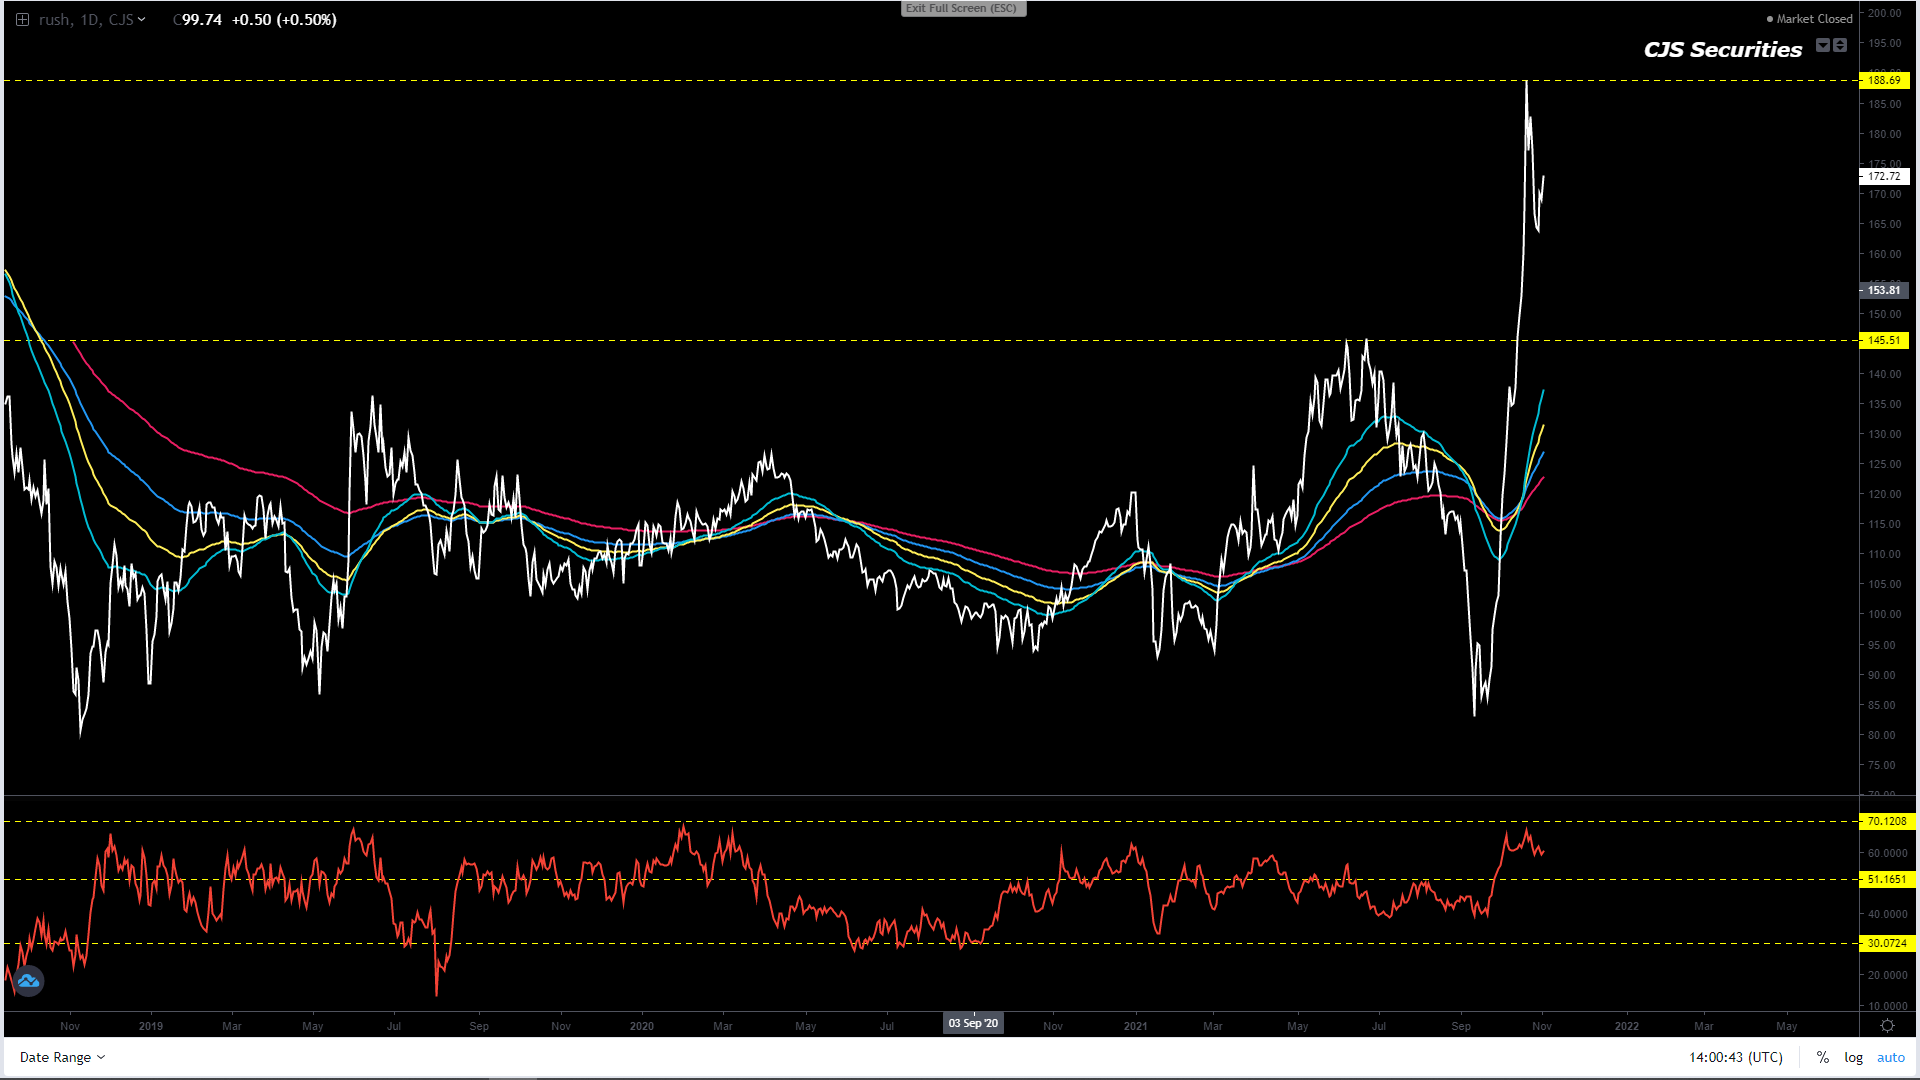
Oil Share Continuous Daily Close
It looked like when 47% went, the market collapsed.
However, the market is seriously oversold in the ST, and I expect a kick and consolidation before seeing further downside.
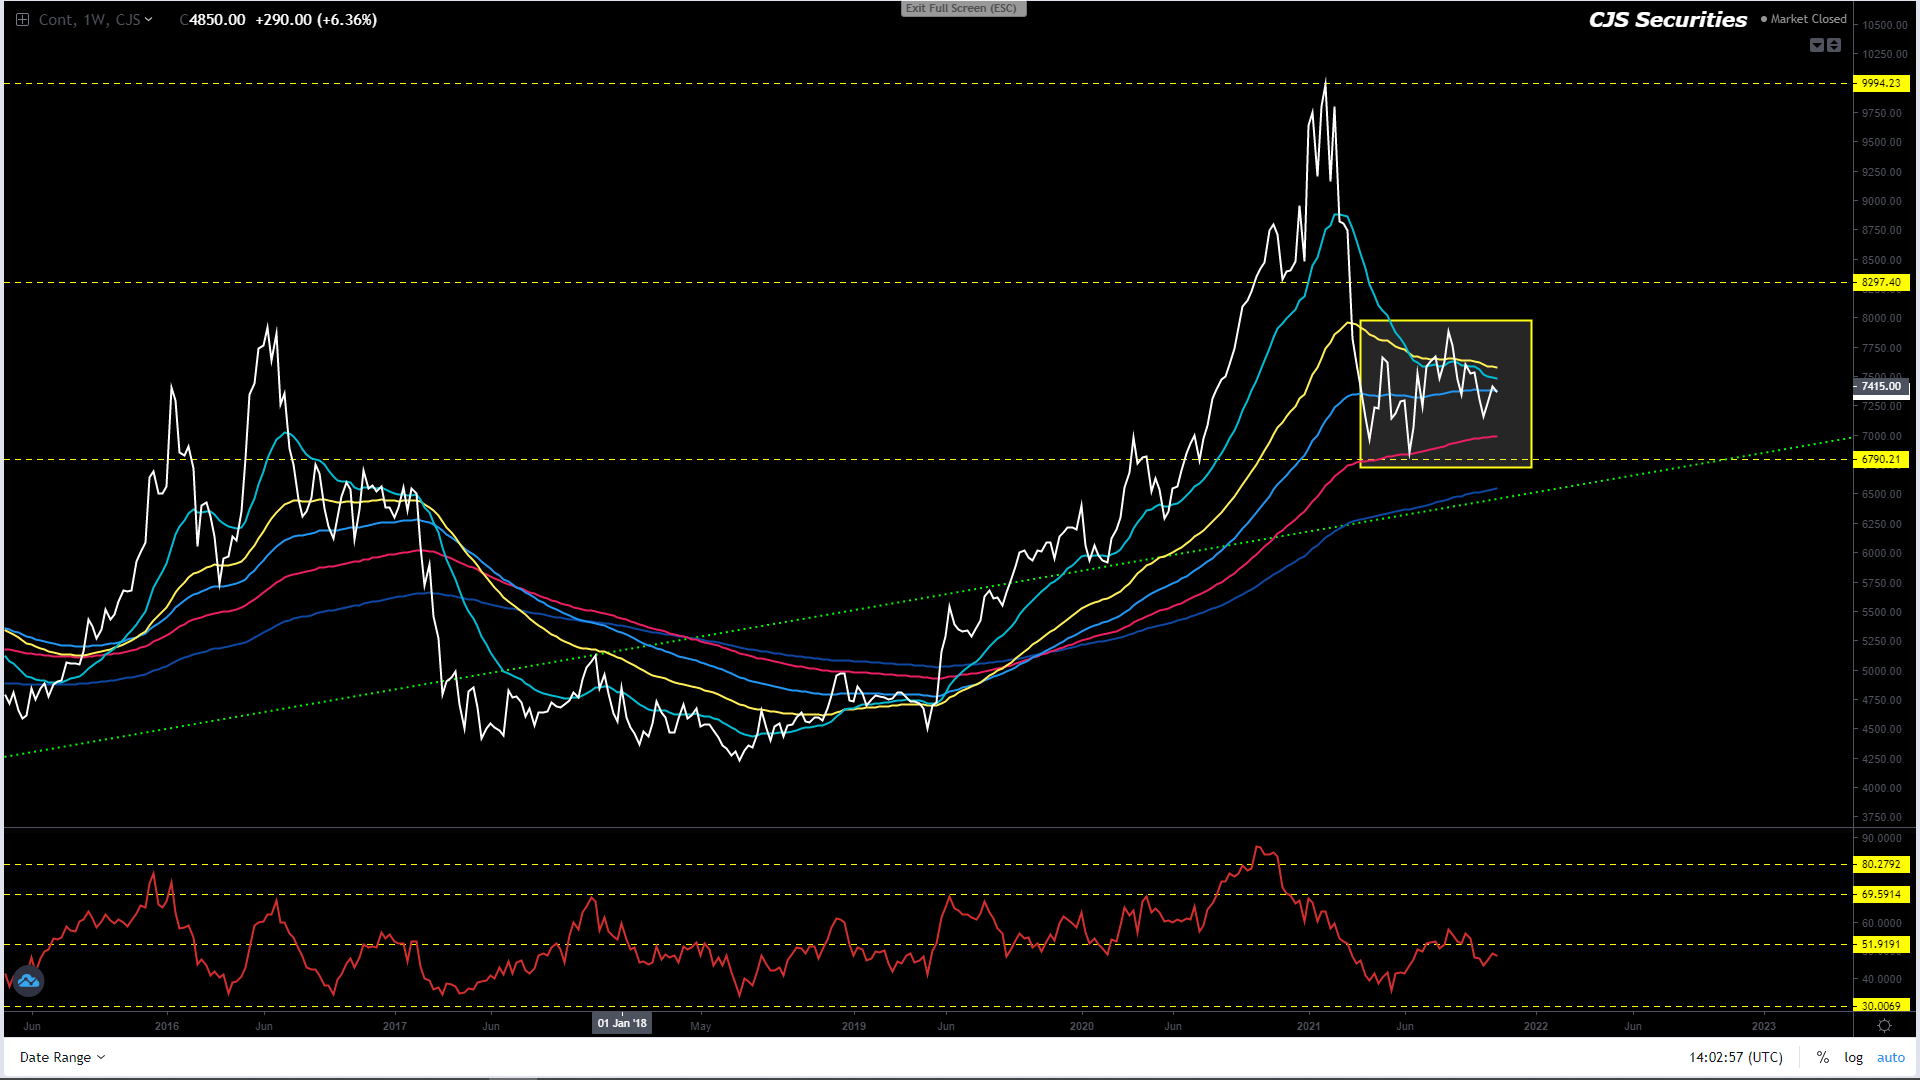
Weekly SAF Soy Continuous Close
The below commentary has not changed for weeks now, and all I can say is that you all used weakness to price.
The chart is coming off beautifully and, with a bit of luck, could still trade as low as R6700.00.
Irrespective of the market moving, one should use weakness to price, daily!
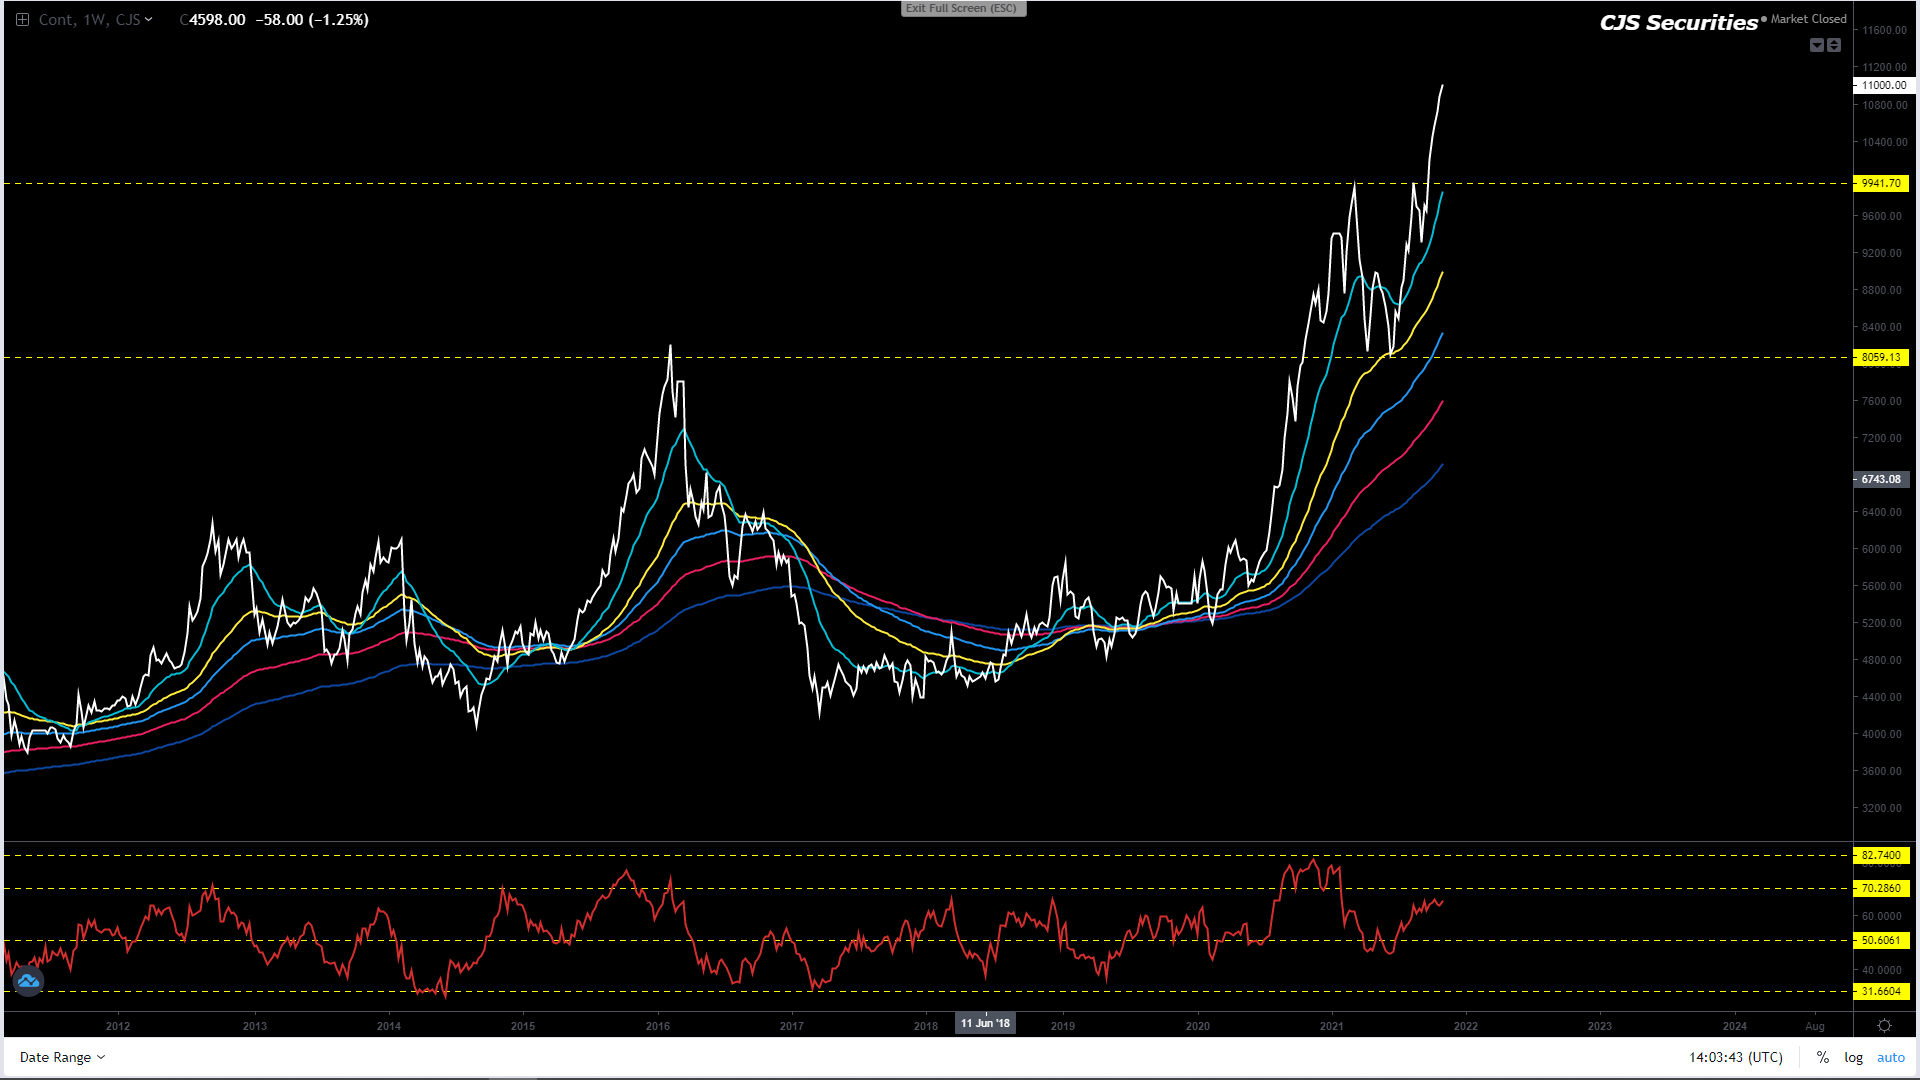
Weekly SAF Suns Continuous Close
Based on its formation, the chart seems to be consolidating before going higher, but I would advise having no part in this as both longs and shorts could see their wallets emptied.
Weekly CBOT Soy Oil Continuous Close
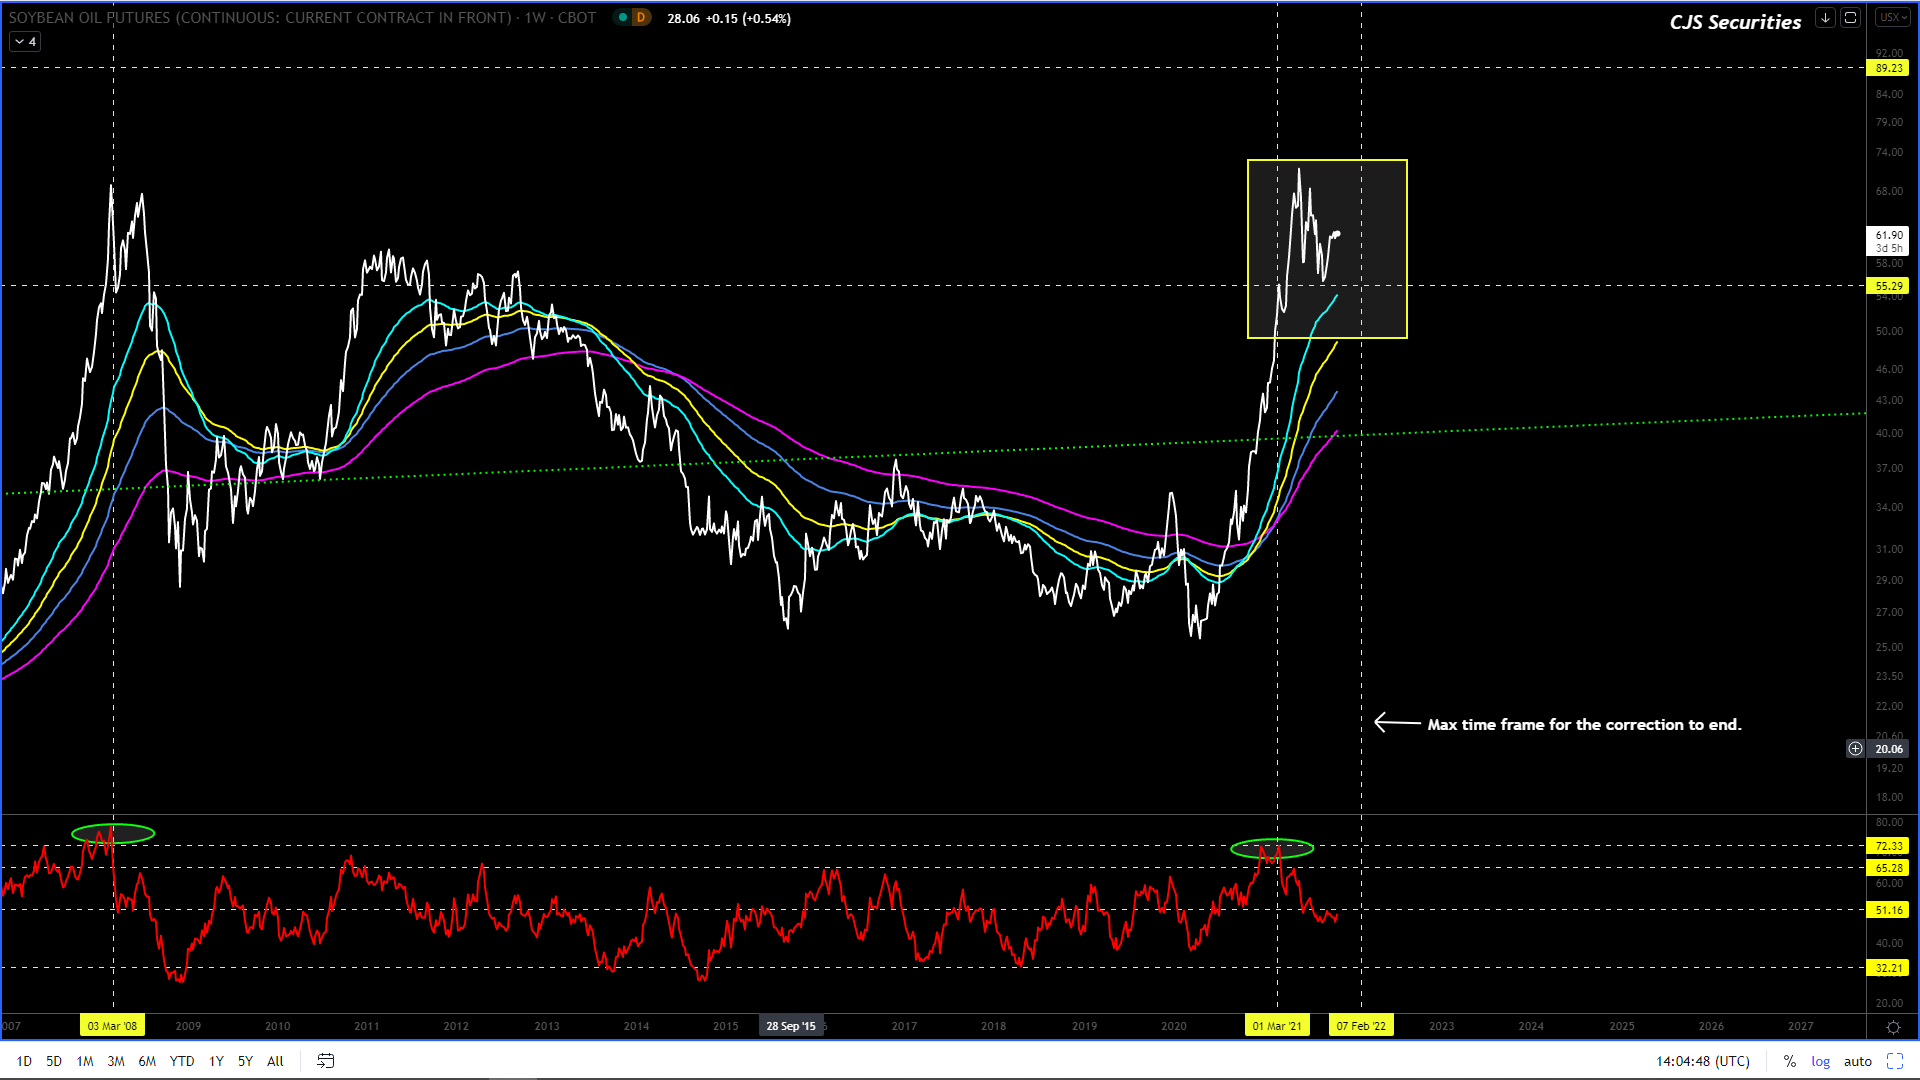
#No Change in Commentary. (steady as she goes)
I am super bullish and starting to wonder if the energy / power issues in China will transpire as the trigger for the below number to play out?
I feel the correction is done, (I feel good about this one) and all the pullbacks from here are buying opportunities with upside targets between $0.85 -$0.89!
I almost feel that we don’t have enough cash to get as long as we should, buy at best and scale down, this is budget making stuff with sprinkling of retirement!!!!
Weekly CBOT SBM Continuous Close
Finally!!!!!!!
I
love the chart, and after confirming a low, all the pullbacks are a chance to
BTFD’s!
I believe that this chart is not ready for its “major break” higher yet!
In the ST, there are too many potential outcomes for me to mention, hence why I am happy to sit out for the time being and allow the chart to develop as it pleases.
Dollar/Rand Daily Candle
I am well aware that many people are calling for the inverted H&S to play out, but I have seen these formations fail more than I have seen them work, and it’s with this mind that currently, I am struggling to see this chart consistently trade over R16.00 in the ST / MT.
Overall though, I would not be surprised for this chart to make one last assault on the R15.50 level and potentially even breakthrough, but as previously mentioned, I would be a seller of the USD should we see those levels.
In closing, if you are keen to buy the USD, keep your stop under R14.88! – missed this with R0.0150
Dollar/Rand 240 min Candle
We seem to have had the below trade pretty spot on.
“Buy R15.00 – R14.90 with a stop under R14.8650.Targets will be at R15.47 – R15.66, and this trade will have a 35 / 10 risk-reward! “– super chuffed for those who executed.
This week we are going to see if lightning can strike twice!
Buy R15.17 – R15.11 with a stop under R15.0800 and look to sell out at R15.45.
This trade will give us risk-reward of 5 / 1.
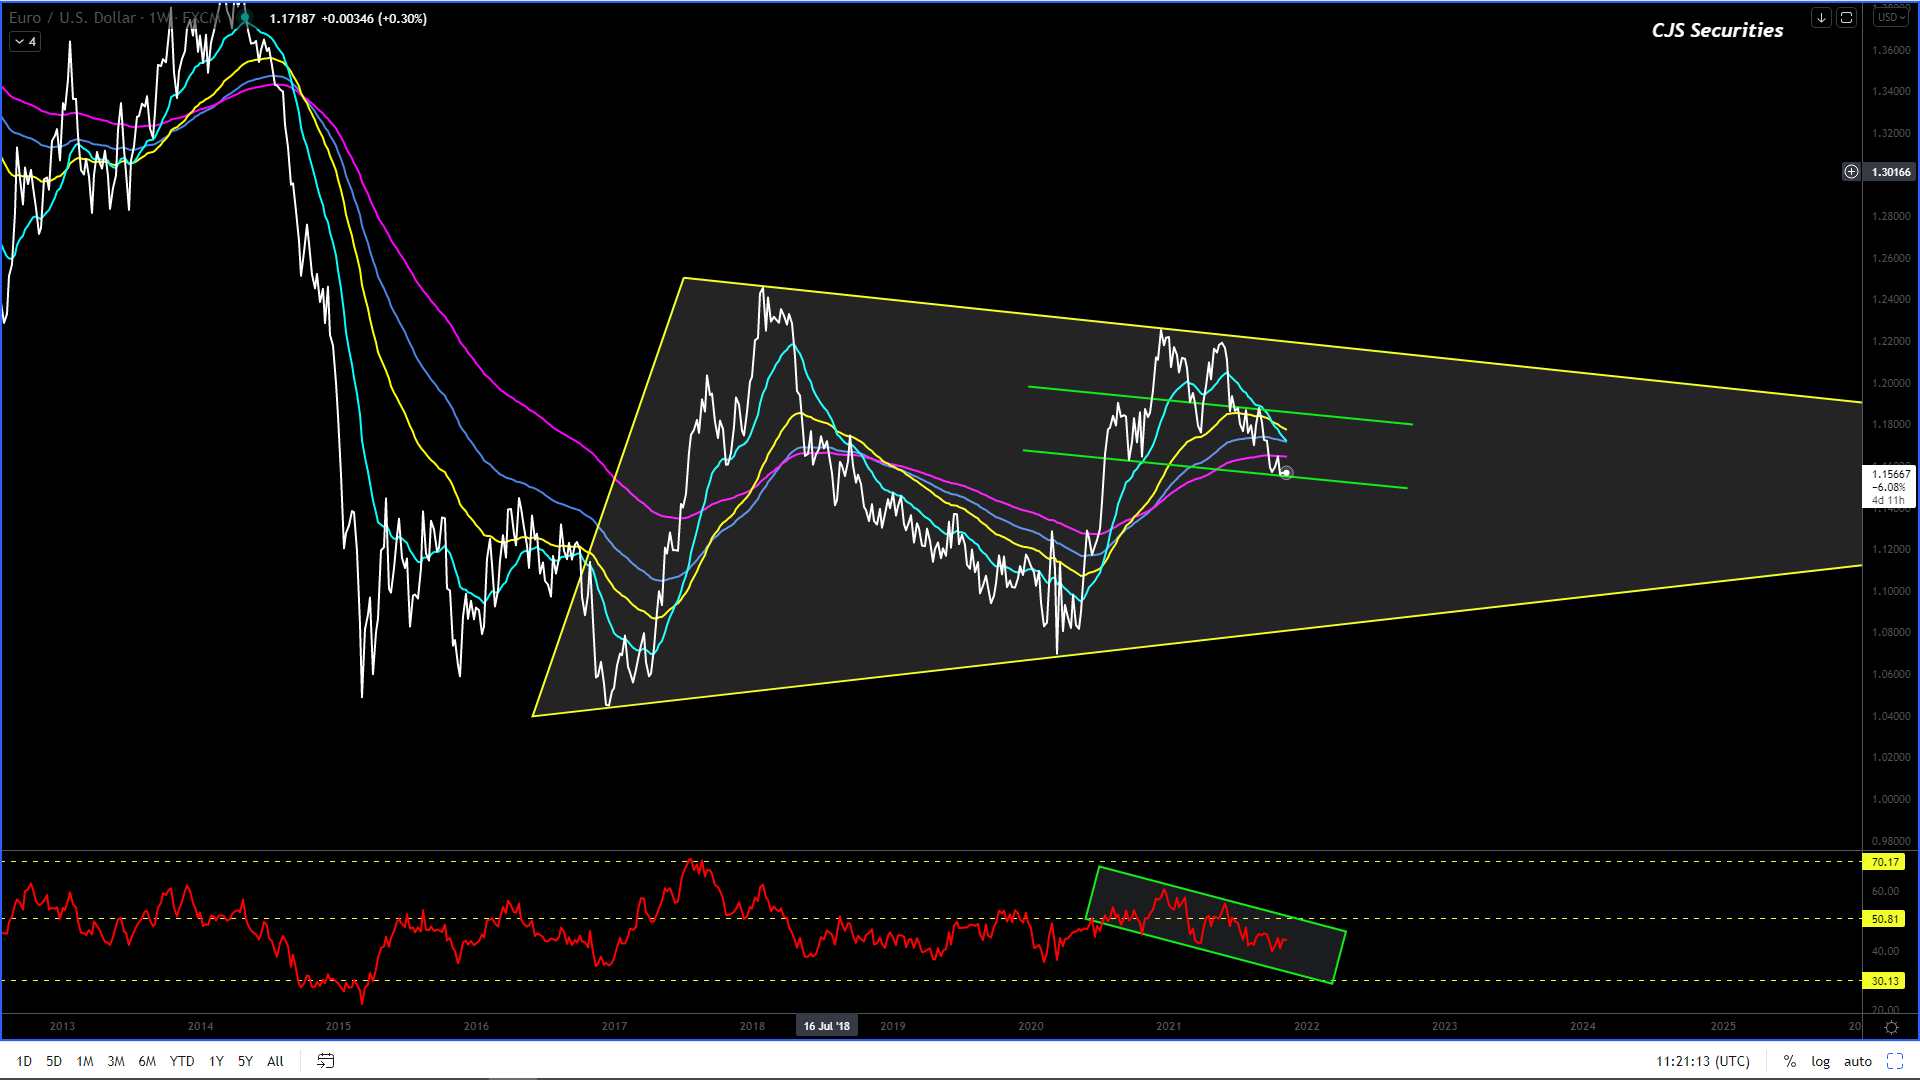
Euro/USD Weekly Close
All I know is that the USD is broken, and I have no idea what I am looking at regarding whether this is a correction or whether it’s the start of a new leg that could trade as low parity.
We will need this chart to play out over a few weeks before “hopefully” gaining greater insight.
US Dollar Index Weekly Candle
Although we are over 95, we have not had a weekly close over 95 because I can’t stress just how important the 95 level is on a weekly close!
But with the chart being over 95 I am now compelled to get long and keep my stop as a weekly close under 95!
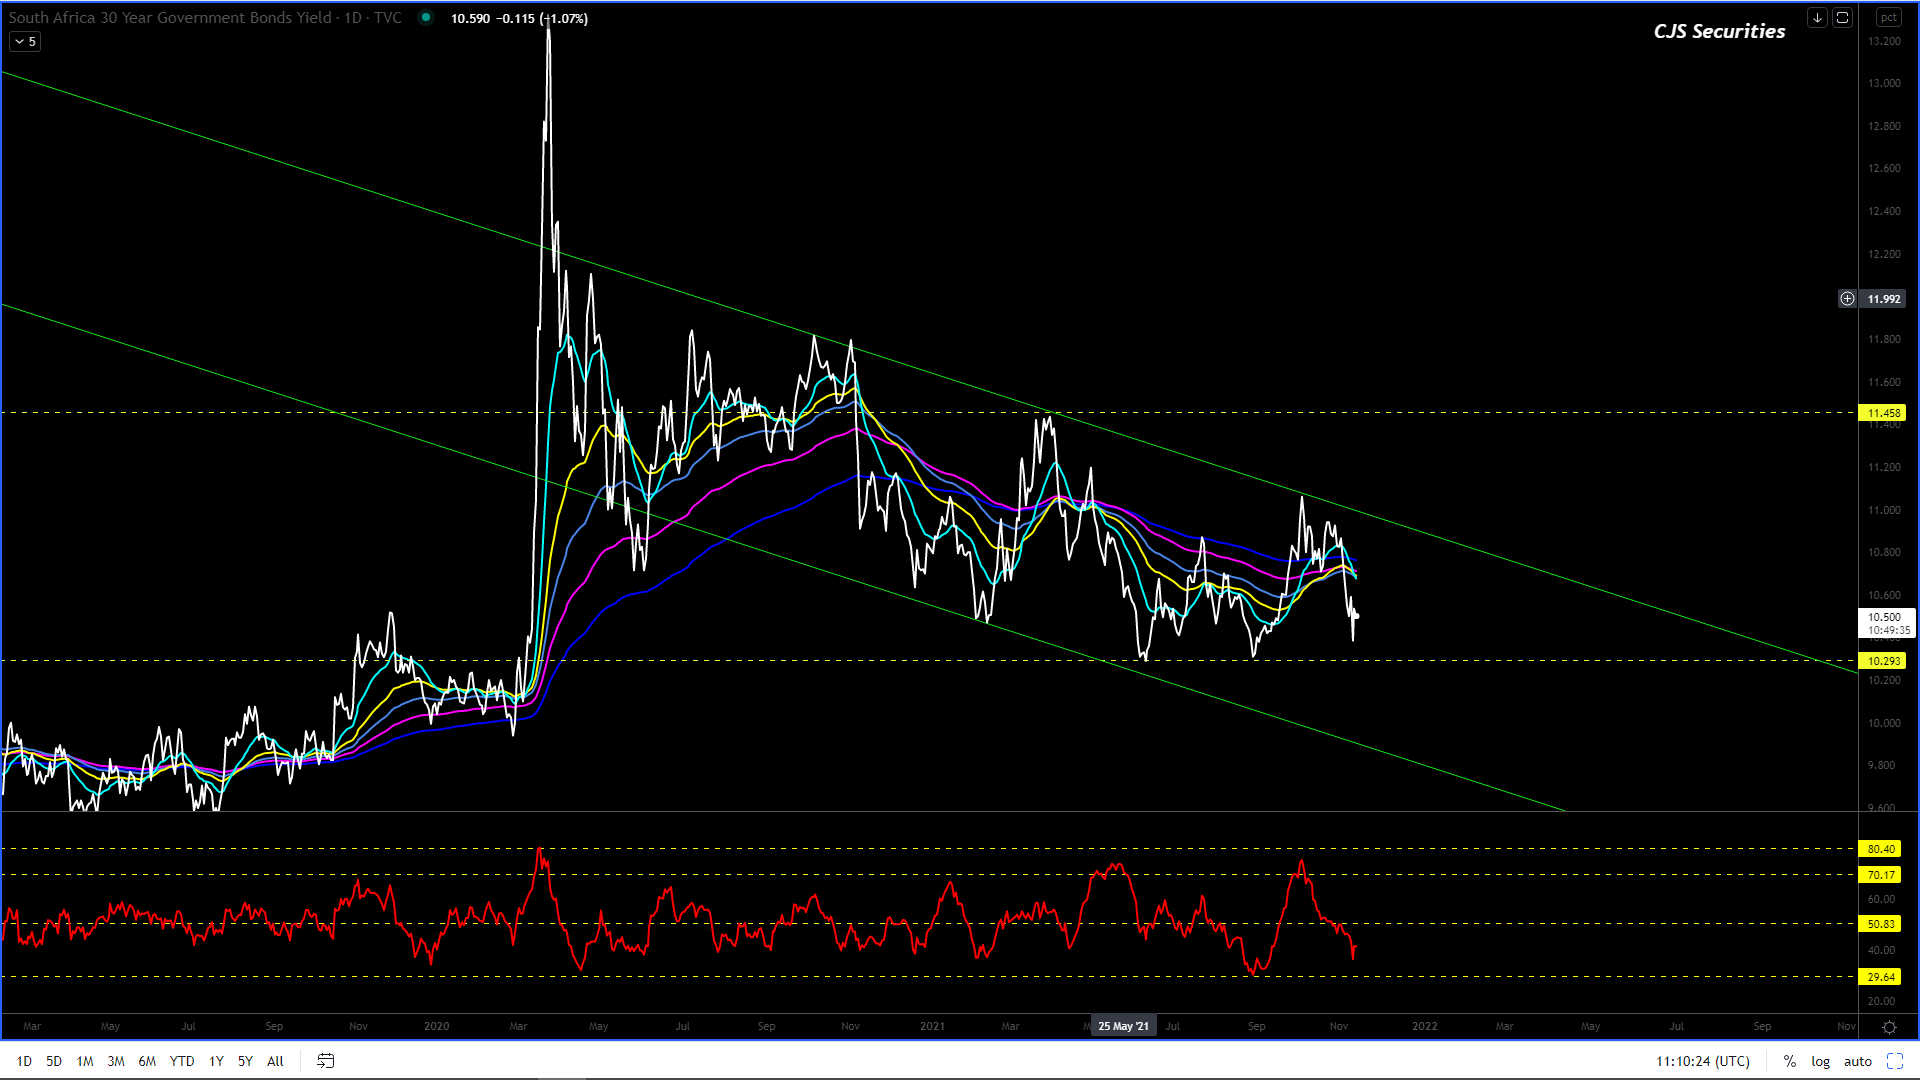
SA Government Bond 30 Year Yield Daily Close
Even though I remain unhappy with what I am looking I feel the ST low is in and that the chart should look to trade up from current levels.
The current formation (even though I am slightly more bullish) has more than two potential outcomes, and hence we are keen to stay out until we have a better view while the downside at 10.30% should remain very solid, I hope!
US Government Bond 30 Year Yield Weekly Close
#I still
favour the below view, but this chart is not very pretty at all.
I would look at buying
a move back to 1.90% – 1.80%that will have upside targets from 2.58% – 2.71%.
Use an SL under 1.70%.
Please note that only
a weekly close of over 3.50%will confirm that the trend has been broken.
After thinking we made a low albeit a MT and not a LT low this chart now appears to want to come down way further than initially anticipated.
As previously mentioned only a rally and Weekly Close over $13.02 will get me really excited.
One should use the volatility to play the ranges with a bias to building a decent long sub $12.00!– I hope many of you played ball sub $12.00as we printed $11.84.
Most should be long at really good levels sub $12.00 and for those that know the crypto markets the best advice I can give right here, right now is to hold and buy more on the way down as the price action is starting to look very much like it wants to print $11.50.
240 Min CBOT November 21 Soybean Candle Chart
Firstly, not much has changed from the below view from last week, as we are seeing the leg lower and most should have taken some cash off the table.
However, now is the time to buy those positions back and buy more all the way down to $11.50 as the kick, aka the real rally, is not far away!
“I don’t like this formation and although it can trade higher this chart needs and should see another leg lower.
My view is to take cash off the table over $12.40 and keep BTFD’s.
This view is valid as until we have a move and close over $13.08 the bull market is not yet confirmed. “
Board Crush Continuous Daily Close
New highs have been made but this chart is just too wild for our likening and as the saying goes “a fool and money are soon parted”.
We are happy to sit out for now.
Oil Share Continuous Daily Close
This chart can make a new high and in all likelihood will make a new high as long as the price stays above 47% ,so for those that are long please keep your stops tight.
On the flip side this chart is nearing seriously overbought levels.
Weekly SAF Soy Continuous Close
#No Change in Commentary.
The chart is coming off beautifully and, with a bit of luck, could still trade as low as R6700.00.
Irrespective of the market moving, one should use weakness to price, daily!
Weekly SAF Suns Continuous Close
People the price action on this chart is binary, although based on pure techs its taking a little breather before looking to go higher.
I would advise having no part in this as both longs and shorts could see their wallets emptied.
Weekly CBOT Soy Oil Continuous Close
#No Change in Commentary. (steady as she goes)
I am super bullish and starting to wonder if the energy / power issues in China will transpire as the trigger for the below number to play out?
I feel the correction is done, (I feel good about this one) and all the pullbacks from here are buying opportunities with upside targets between $0.85 -$0.89!
I almost feel that we don’t have enough cash to get as long as we should, buy at best and scale down, this is budget making stuff with sprinkling of retirement!!!!
Weekly CBOT SBM Continuous Close
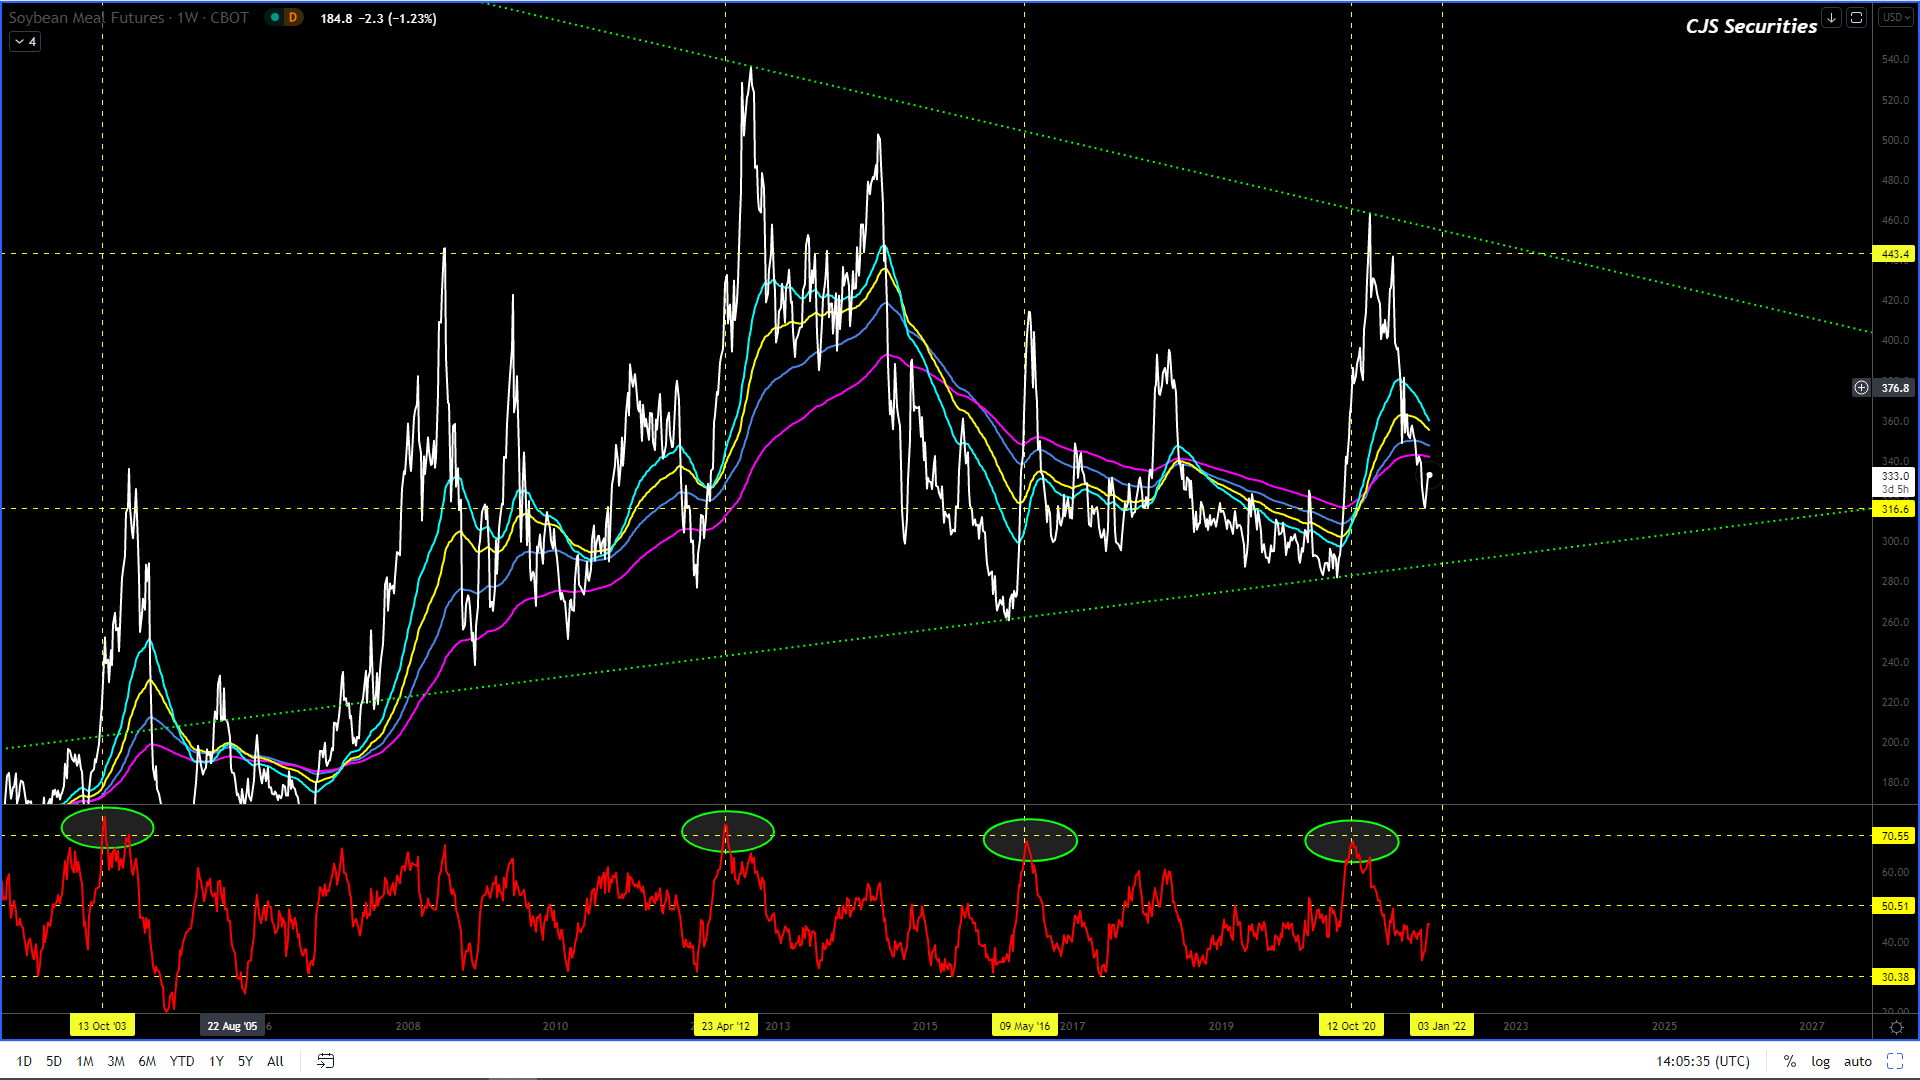
The below commentary makes me feel like I am in the Twilight Zone, but maybe I like it there!
We are long and we are hoping, which is a terrible feeling.
This chart will kick sooner or later, but its Fugly and could still print as low as $288, but we are long and burning worse than a California wild fire, but feel a move sub $290 will be an opportunity to buy more!
There is no change in the below commentary and all I can say is that I am happy we are out as there are potentially a few different outcomes.
“This corn chart has traded beautifully and has now printed its targets.
I would look to take profit on my longs and give the chart a few days to play out as I will only consider the correction over on a weekly close over $5.95.
We are very happy to be square until we have more confidence in our view and until then I am happy to live by the saying that one is only as good as your last trade.
I REMAIN really bullish in the “big picture” but, we could easily see this market come off and look to trade back sub $5.30and even$4.80.”
240 Min December 21 Corn Candle Chart Close
We are short at $5.82, fingers crossed, as the below commentary has not changed.
“Sell at best and all the way up to $5.94 with a stop over $5.96.
The downside targets will be sub $5.30 and hence this trade will have a 7/1 risk reward.
I REMAIN a proponent of BTD’s and take cash on the rallies until we confirm a bull market over $6.00!.”
Weekly WM Continuous Close
I trust you took some risk off the table after last Monday’s report.
We would look to start buying back sub R3250.
The big pullbacks are still decent buying opportunities.
Weekly YM Continuous Close
I trust you took some risk off the table after last Monday’s report.
“I would look to take some profits into strength as a pullback will be hard and fast and we would like the ability to buy back.” – I hope you all took some cash off the table.
Now is the time to look to buy back those shorts.
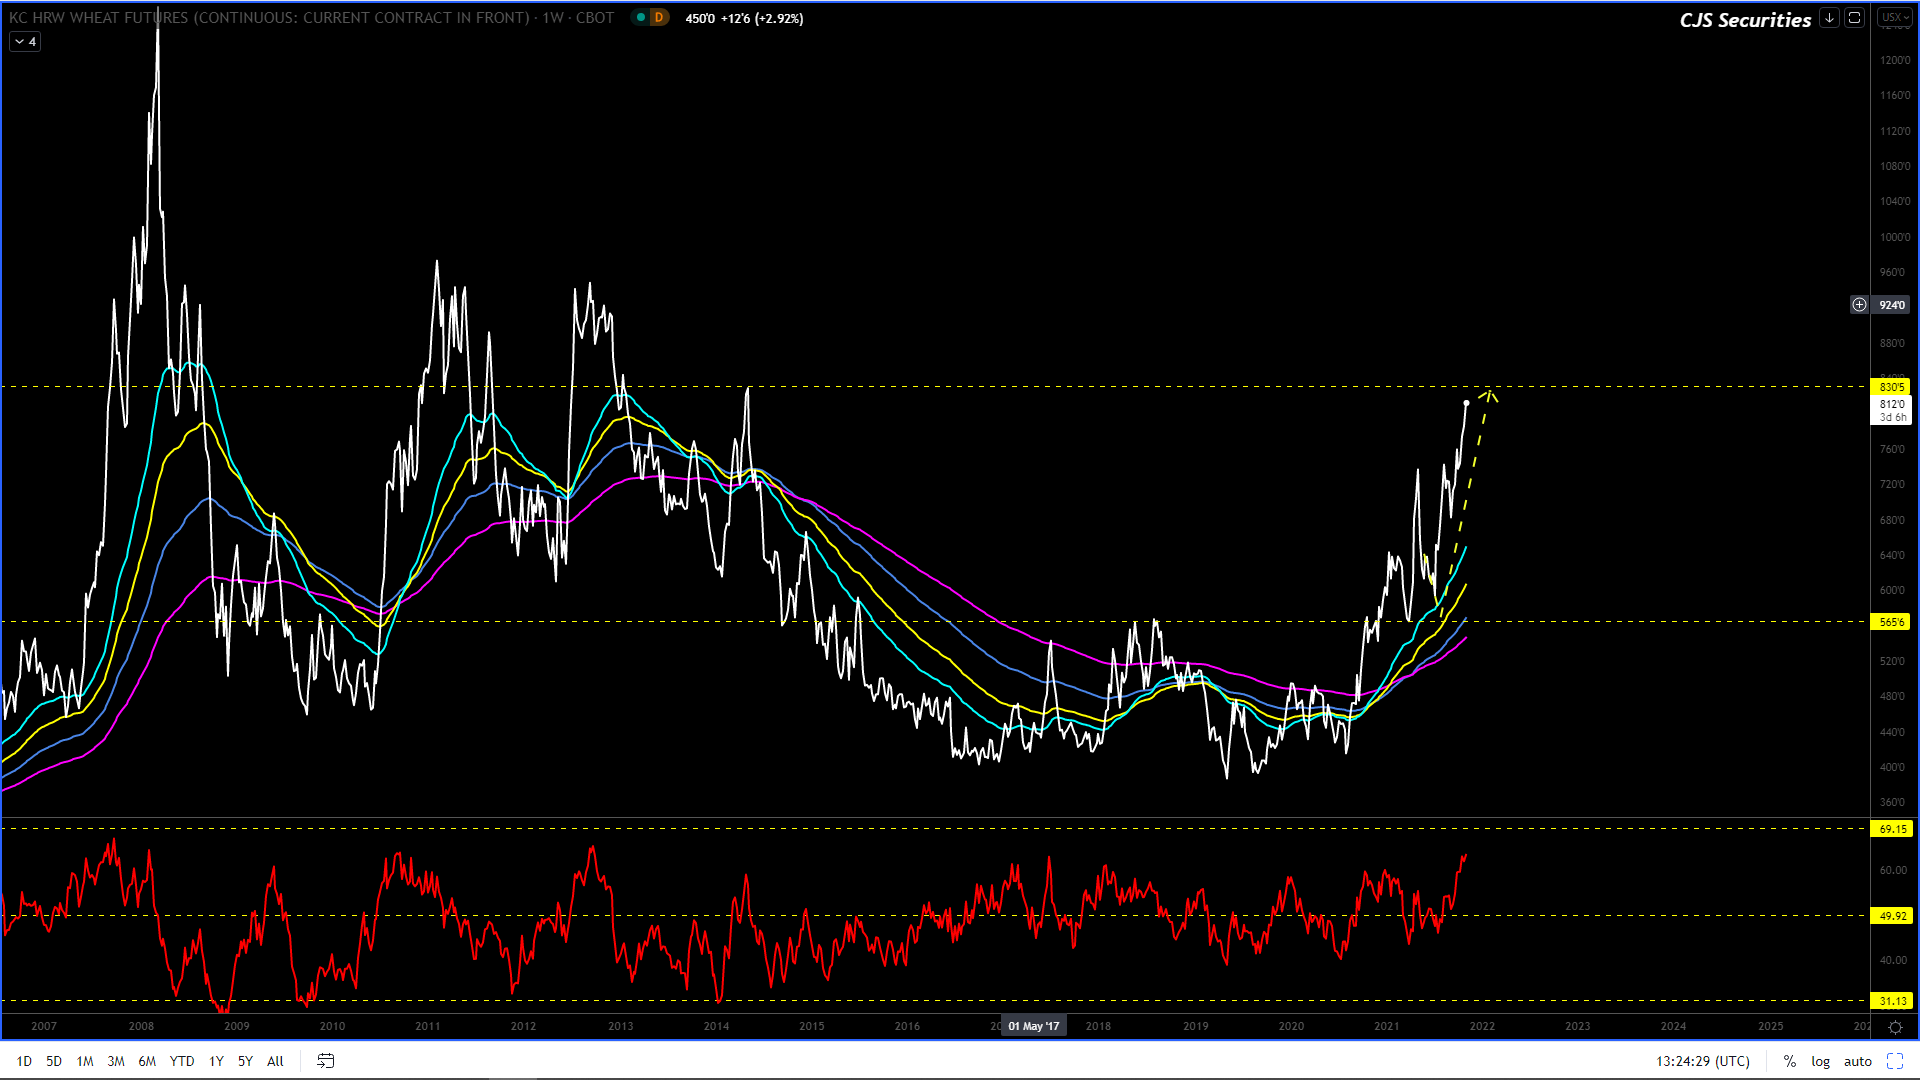
Weekly KC Wheat Continuous Close
I hope you have all taken
the money, as this chart can still rally but right now it’s late at night.
We are now very happy to
sit back and wait until the next opportunity comes our way!
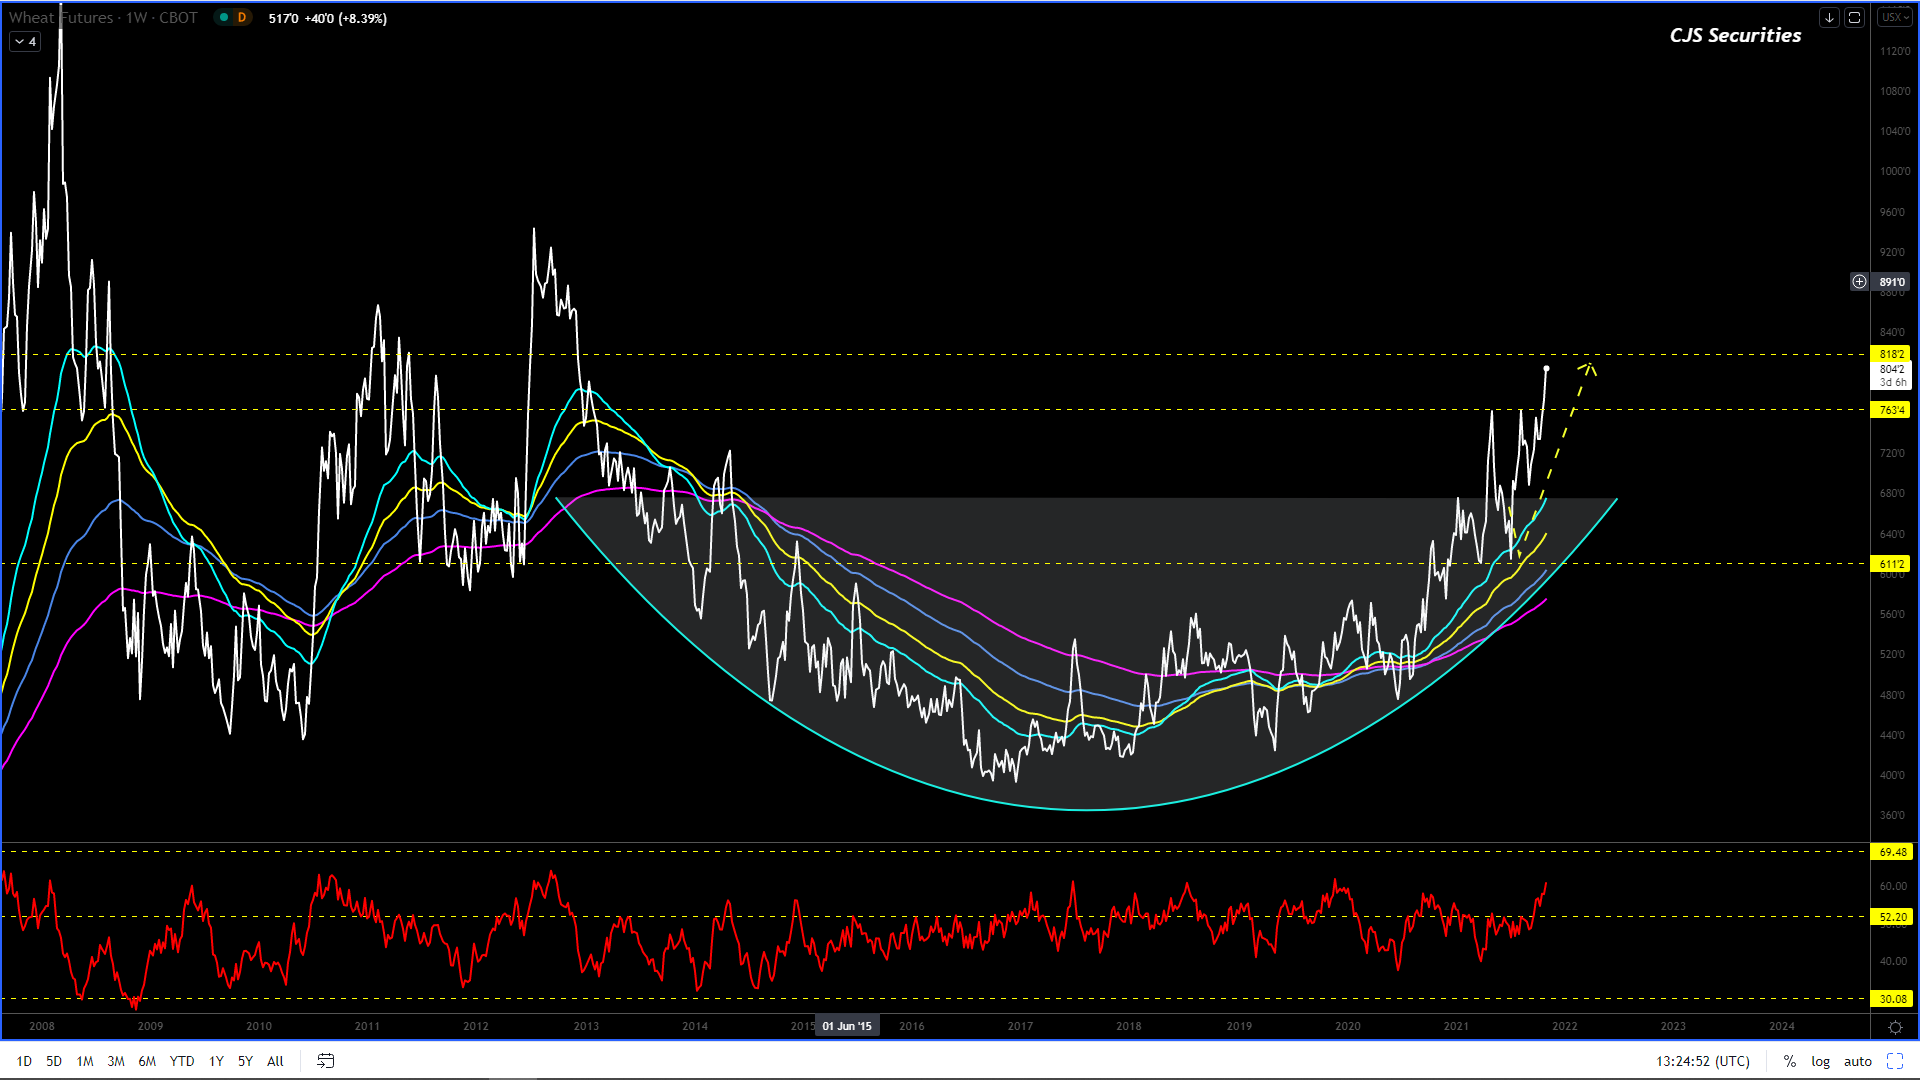
Weekly Chicago SRW Wheat Continuous
I hope you have all taken
the money, as this chart can still rally but right now it’s late at night.
We are now very happy to sit back and wait until
the next opportunity comes our way!
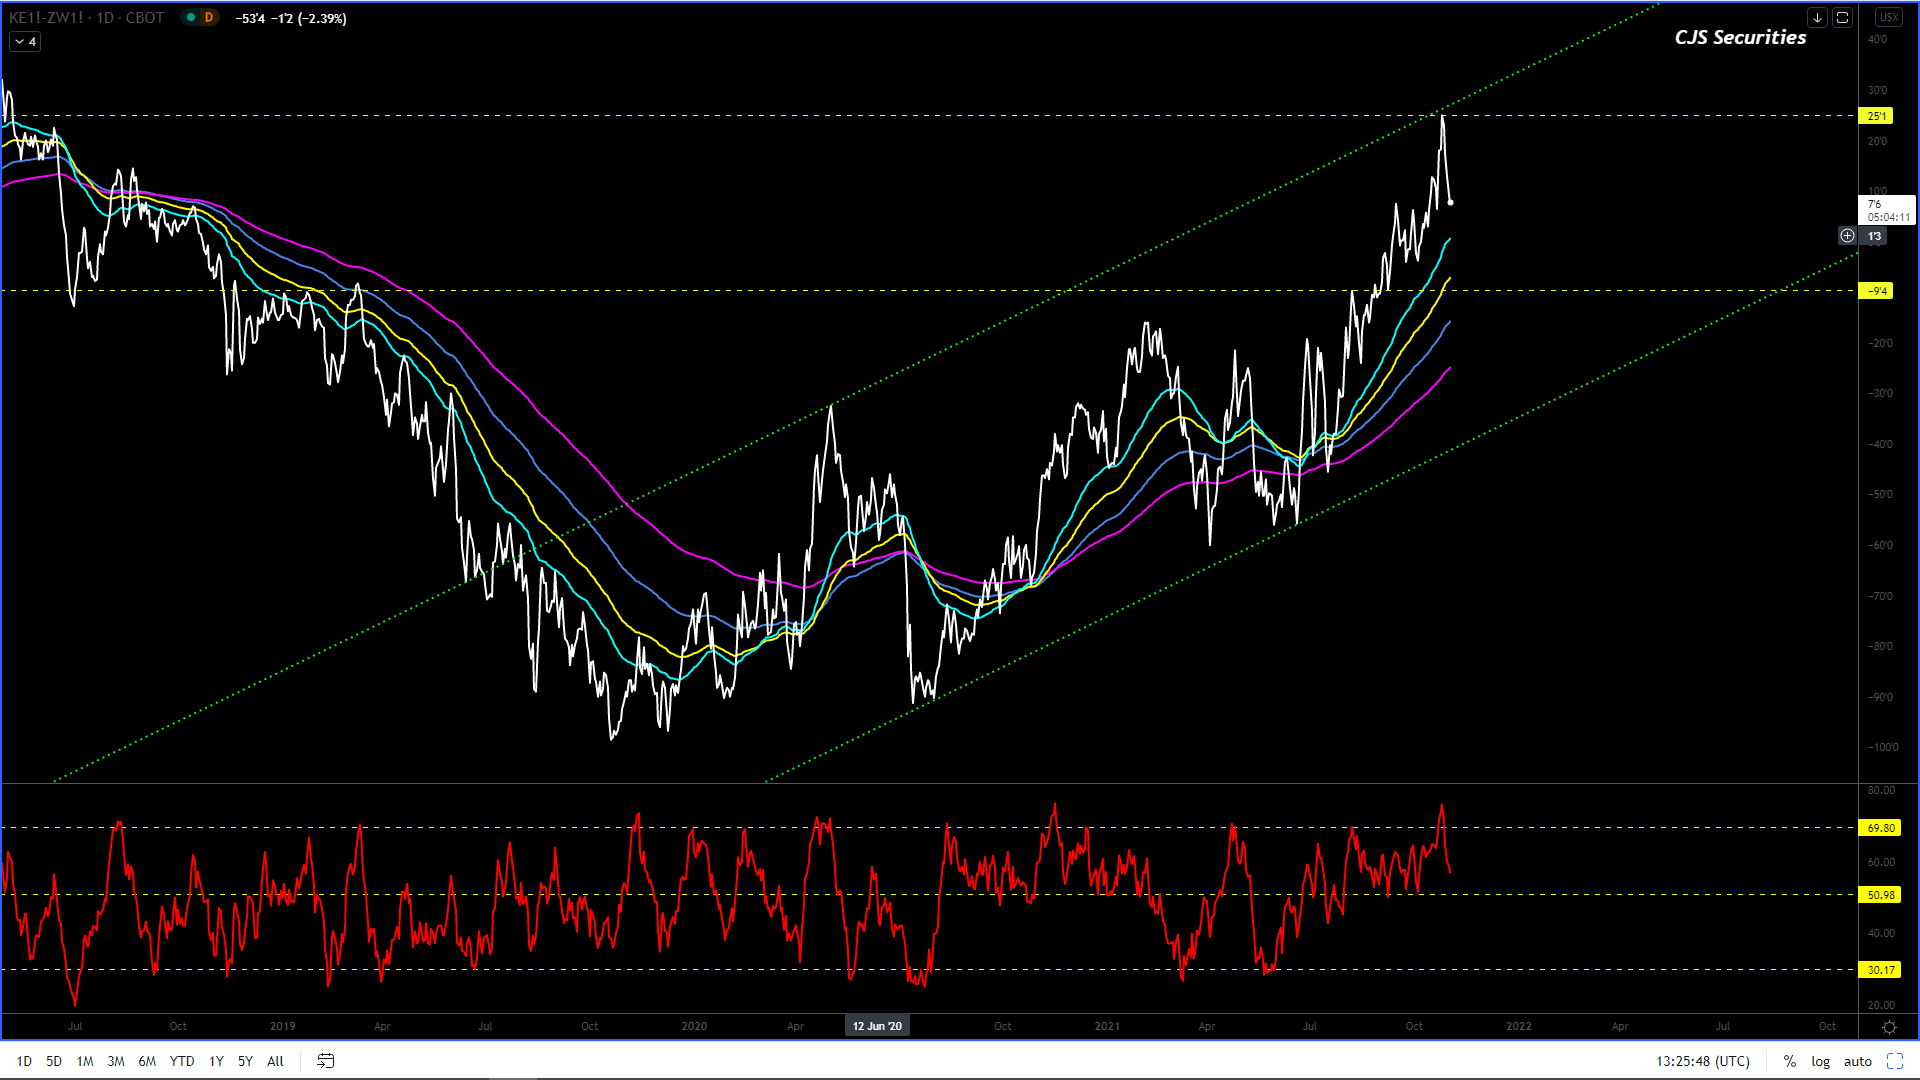
Daily Close KC Wheat v Chicago SRW Continuous Close
This chart has topped out for the MT and traded just short of its targets at $0.28.
We are happy to sit back for a few weeks.
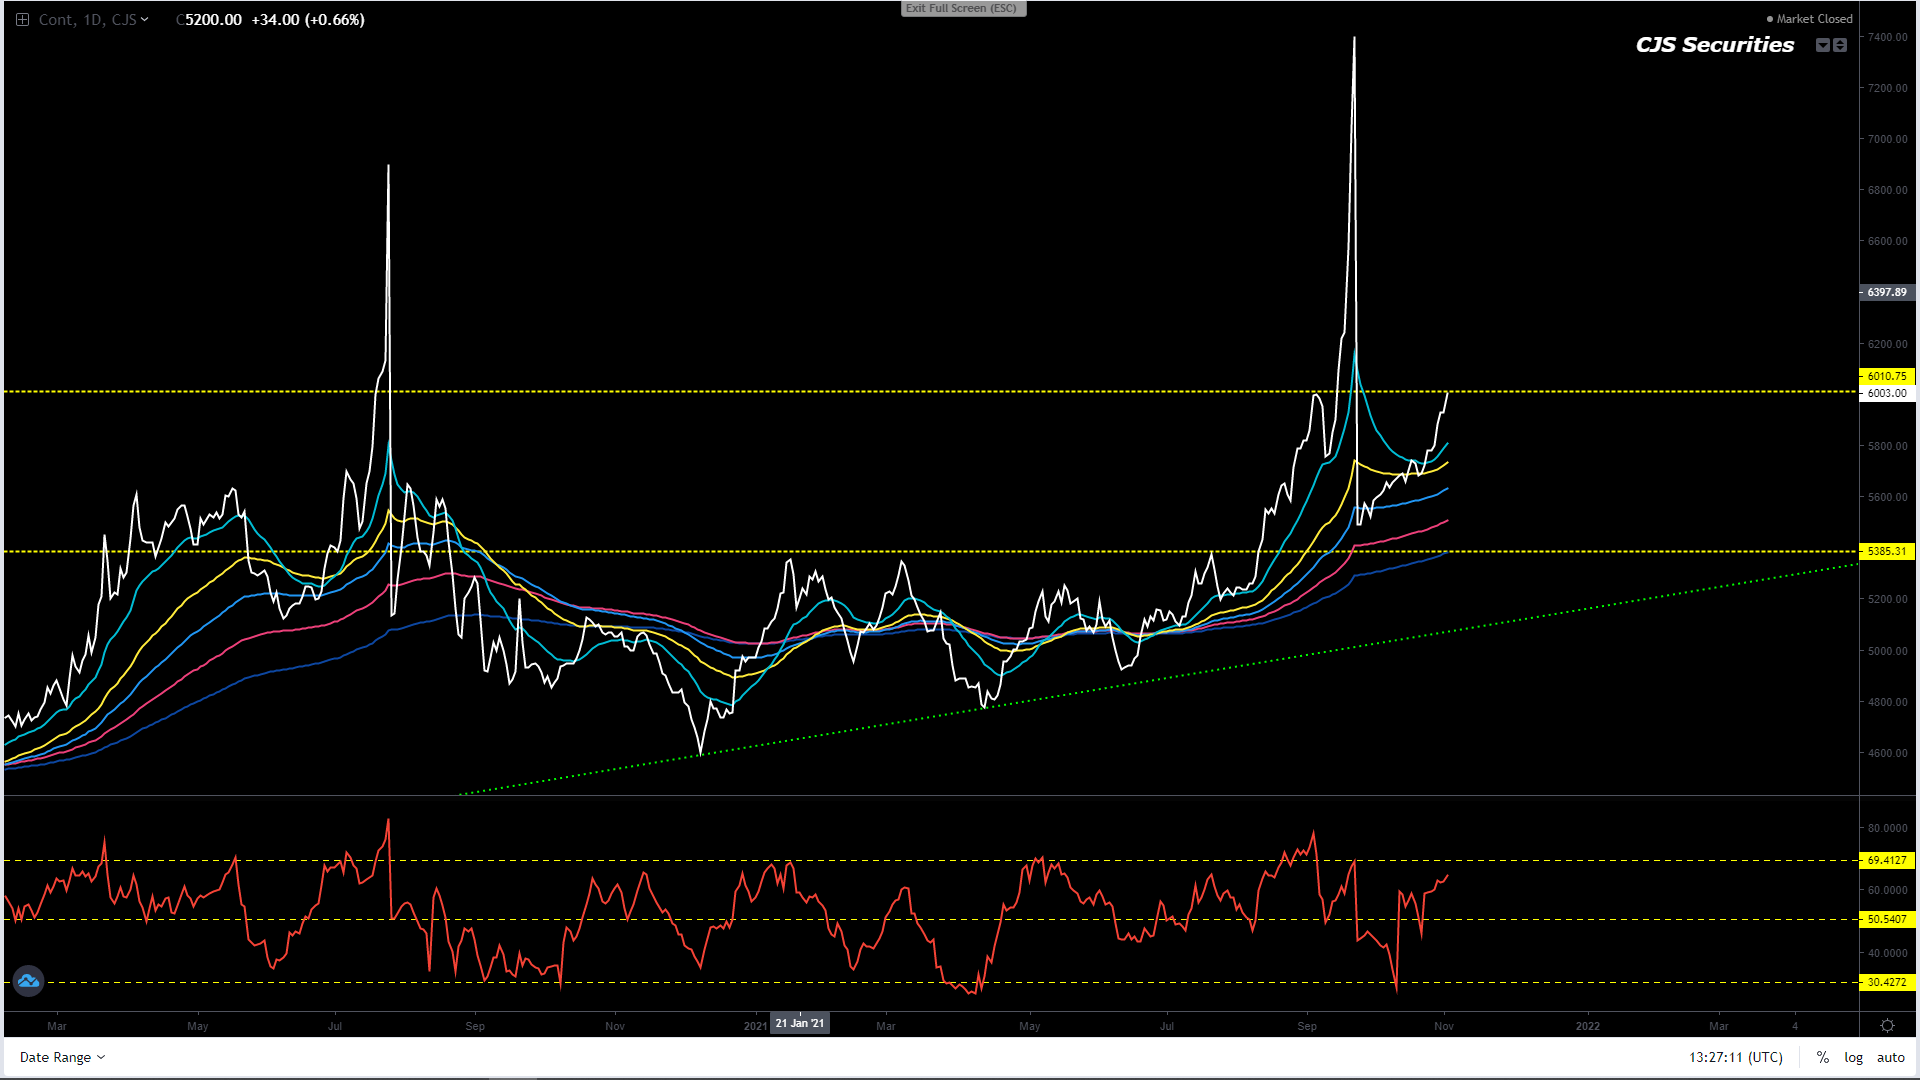
Weekly SAF Wheat Continuous Close
I hope you have all taken the money, as this chart has the potential to continue to come off and potentially trade sub R5200.
We are now very happy to sit back and wait until the next opportunity comes our way!
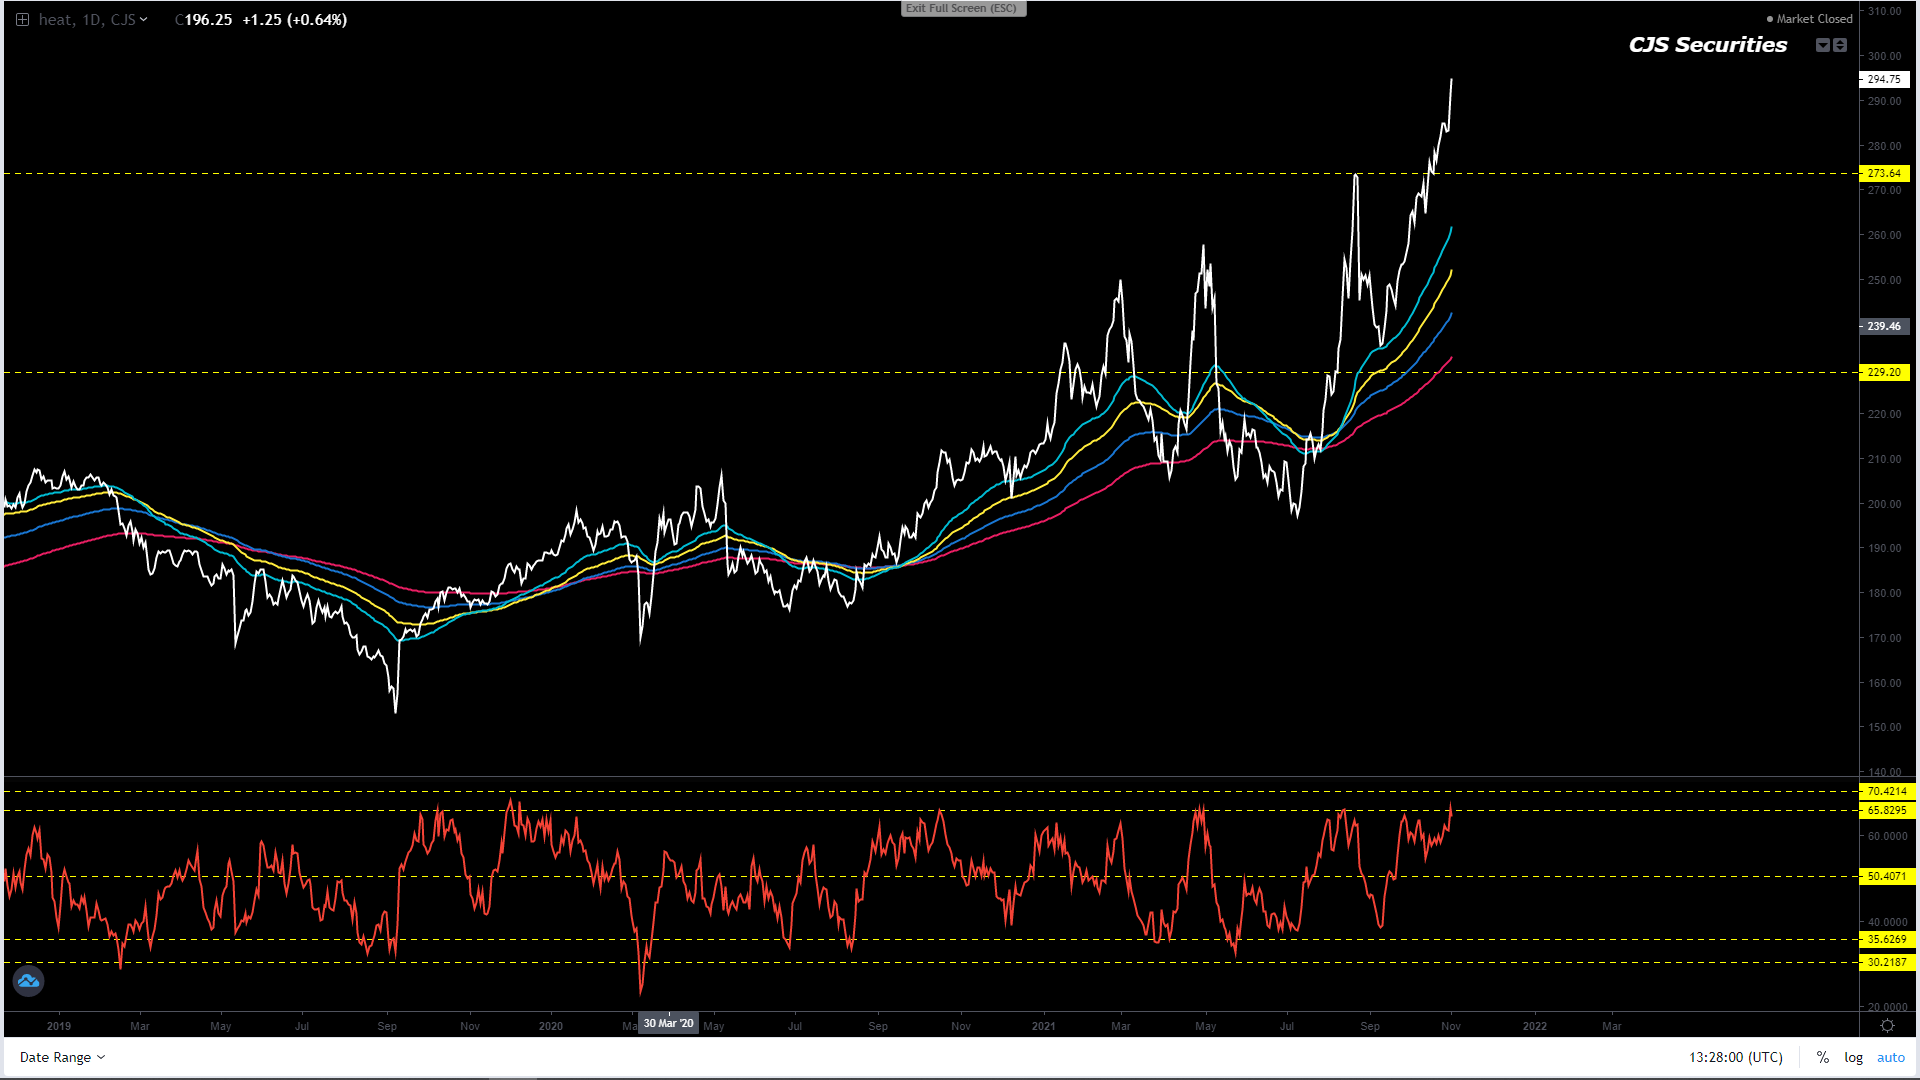
Daily Matif Wheat Continuous Close
We are happy to sit back and allow this chart to develop over the coming weeks.
I am very happy that I called for profits to be taken last week as this chart has now given me greater impetus on my LT view.
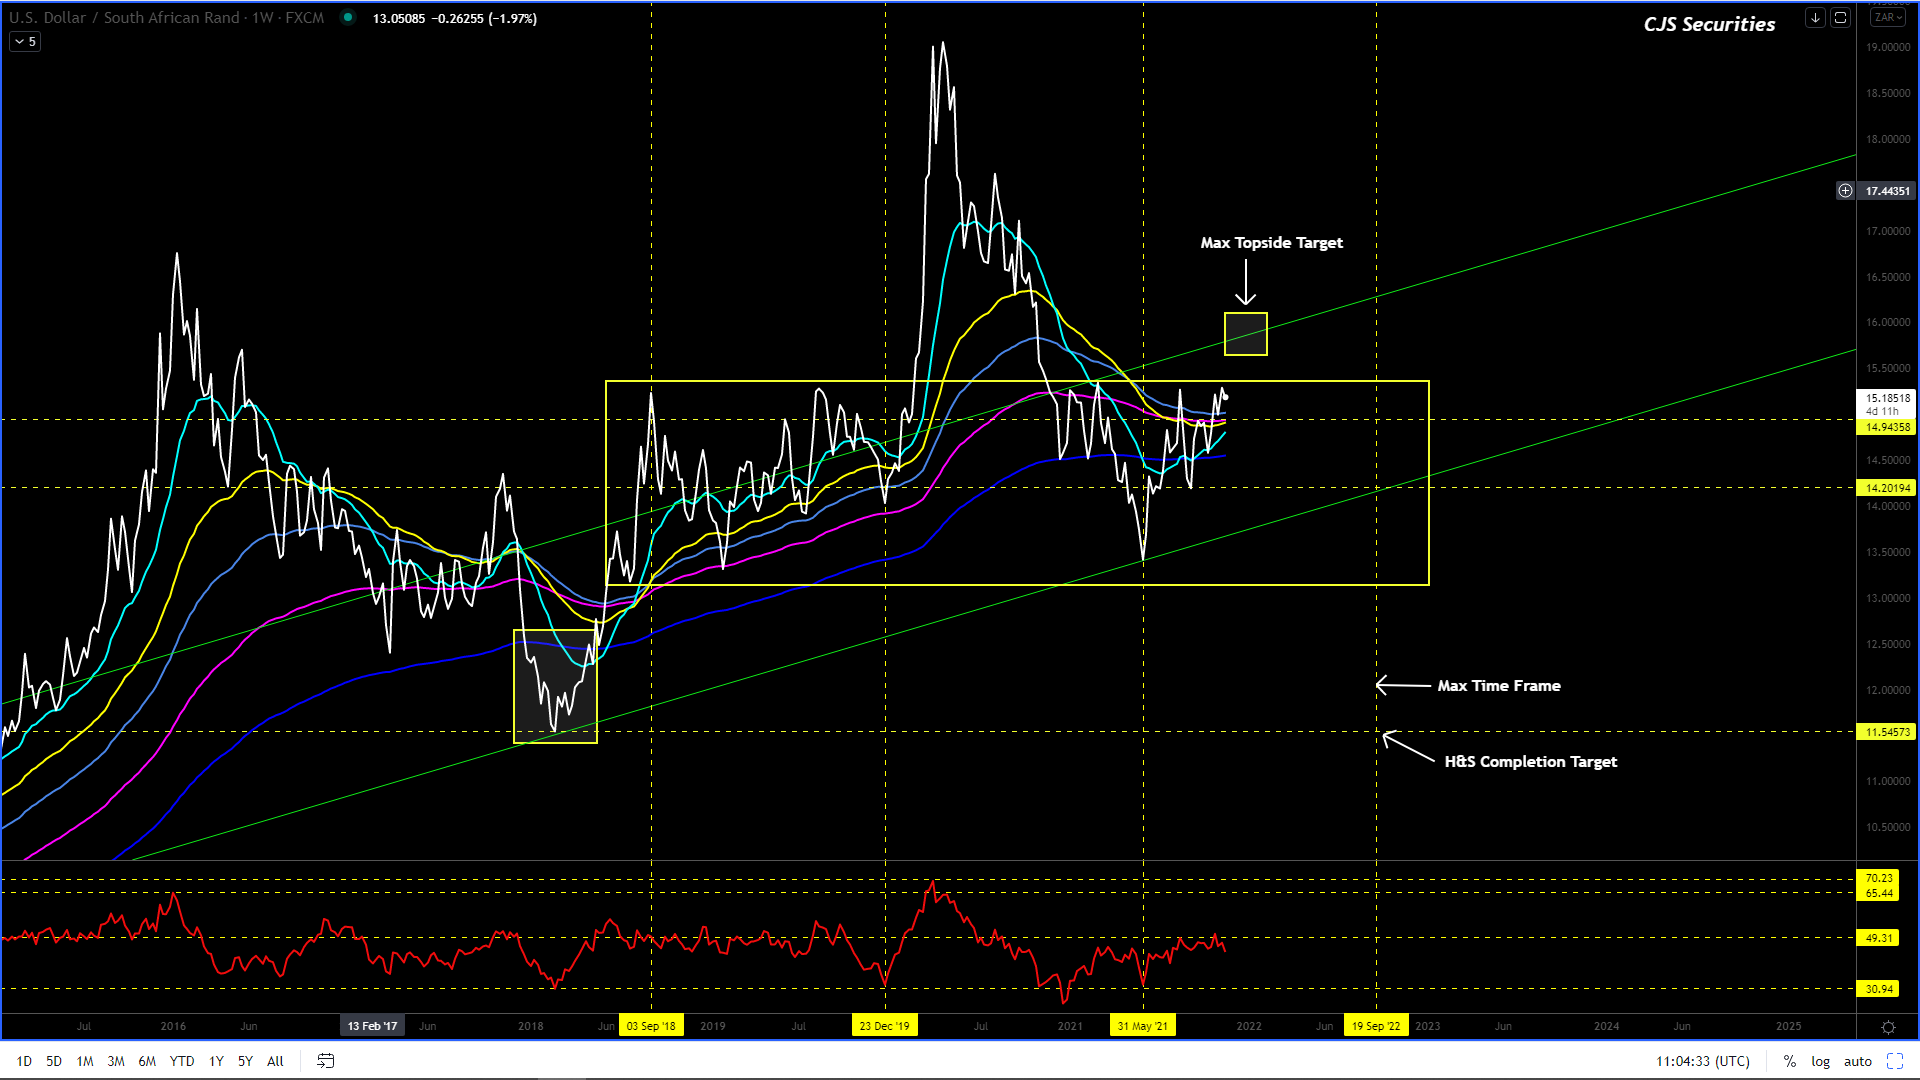
The ST targets have been reached and while there is every chance the chart will again look to test R15.50 and potentially even R15.80, in my bigger picture view I would look to sell a rally of this nature as I currently feel strongly that this chart is not yet ready for its “major break” higher.
Dollar/Rand Daily Candle
As with the Weekly chart I am super chuffed that I advised taking the cash after what was a great rally and going square.
Last week I mentioned that I was not sure what we are looking at and that there is a possibility that we could be experiencing an irregular flat formation, right now I am pretty damn sure we are in the irregular flat and that this chart has an opportunity to rally again and test R15.50 and potentially even R15.80, but a that a rally of this nature would be a great sell IMO.
In closing if you are keen to buy the USD keep you stop under R14.88!
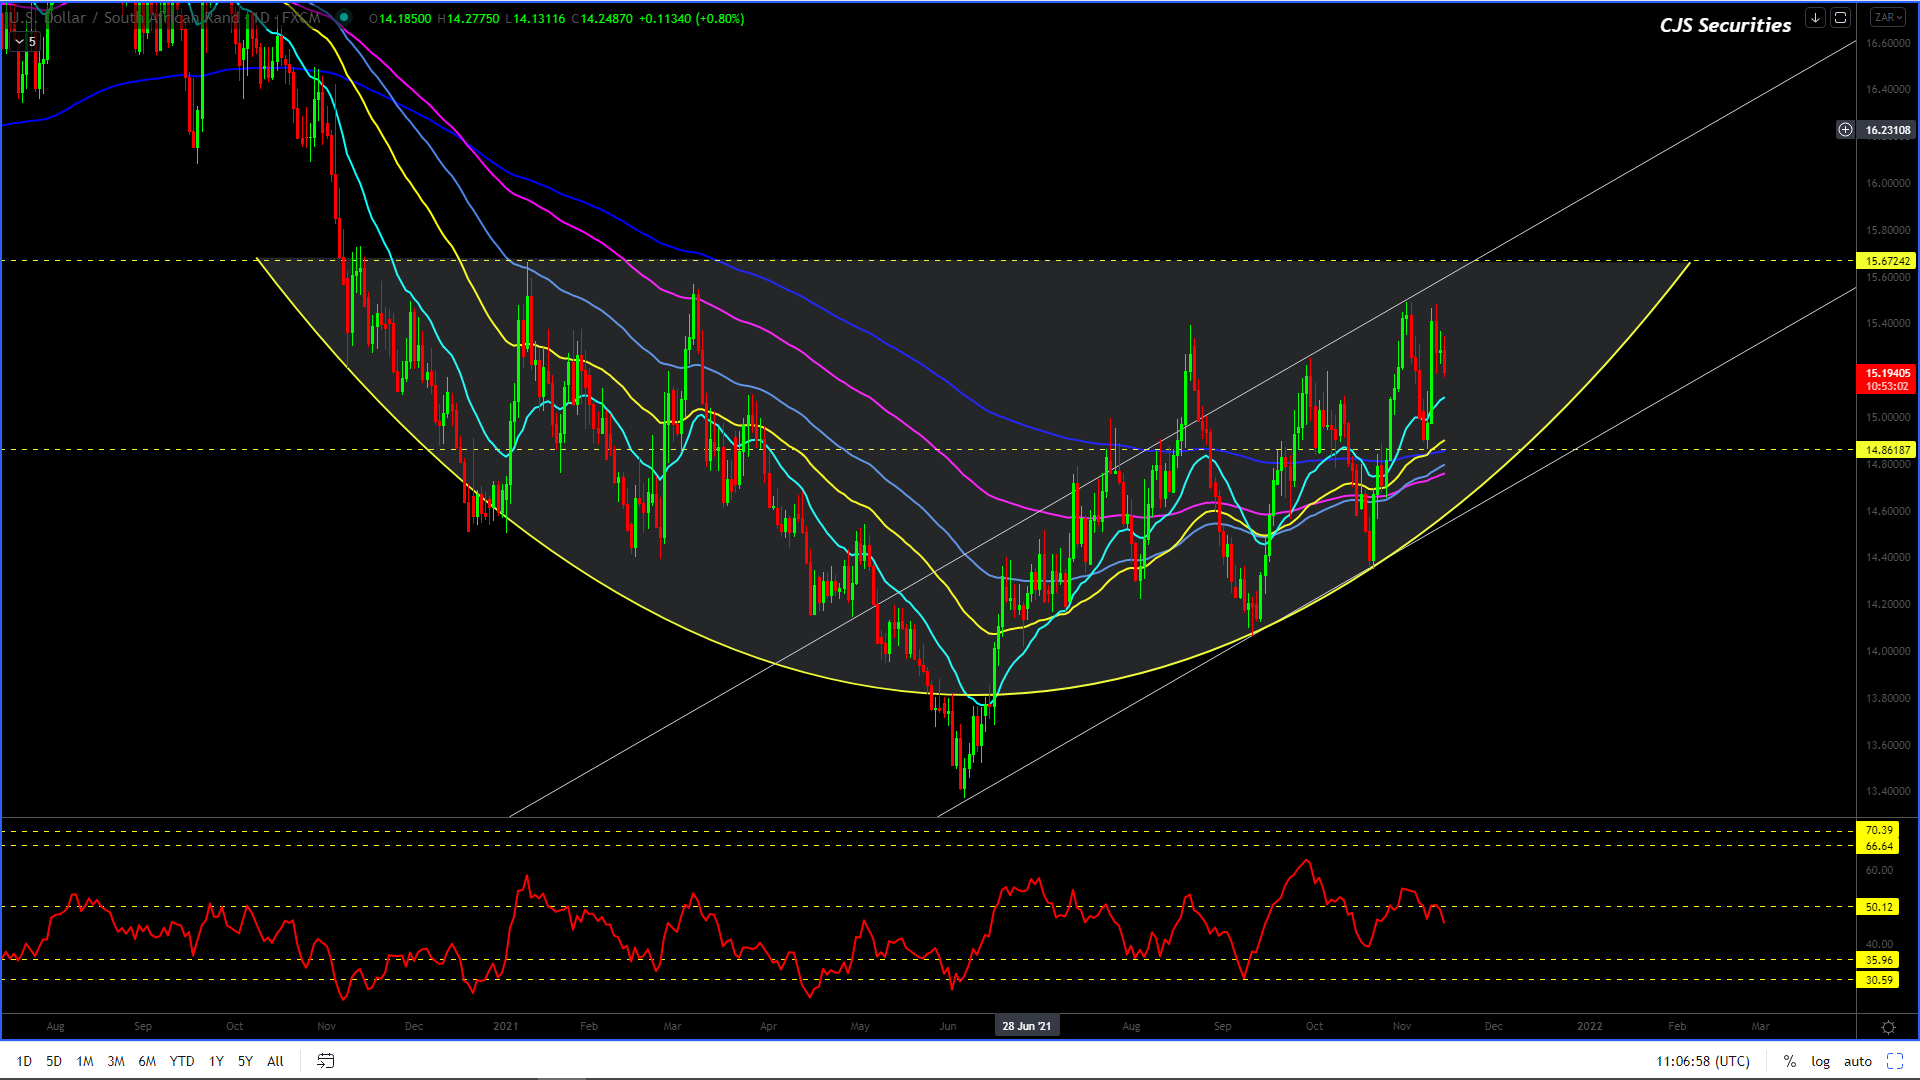
Dollar/Rand 240 min Candle
Firstly, it’s a pity the chart failed at R15.50 and had zero follow through, but people based on my longer term views I have a trade that might work for you and hopefully we have not missed the bus with this morning’s low being R14.9367.
Buy R15.00 – R14.90 with a stop under R14.8650.
Targets will be at R15.47 – R15.66 and this trade will have a 35 / 10 risk reward!
Fingers crossed we can execute.
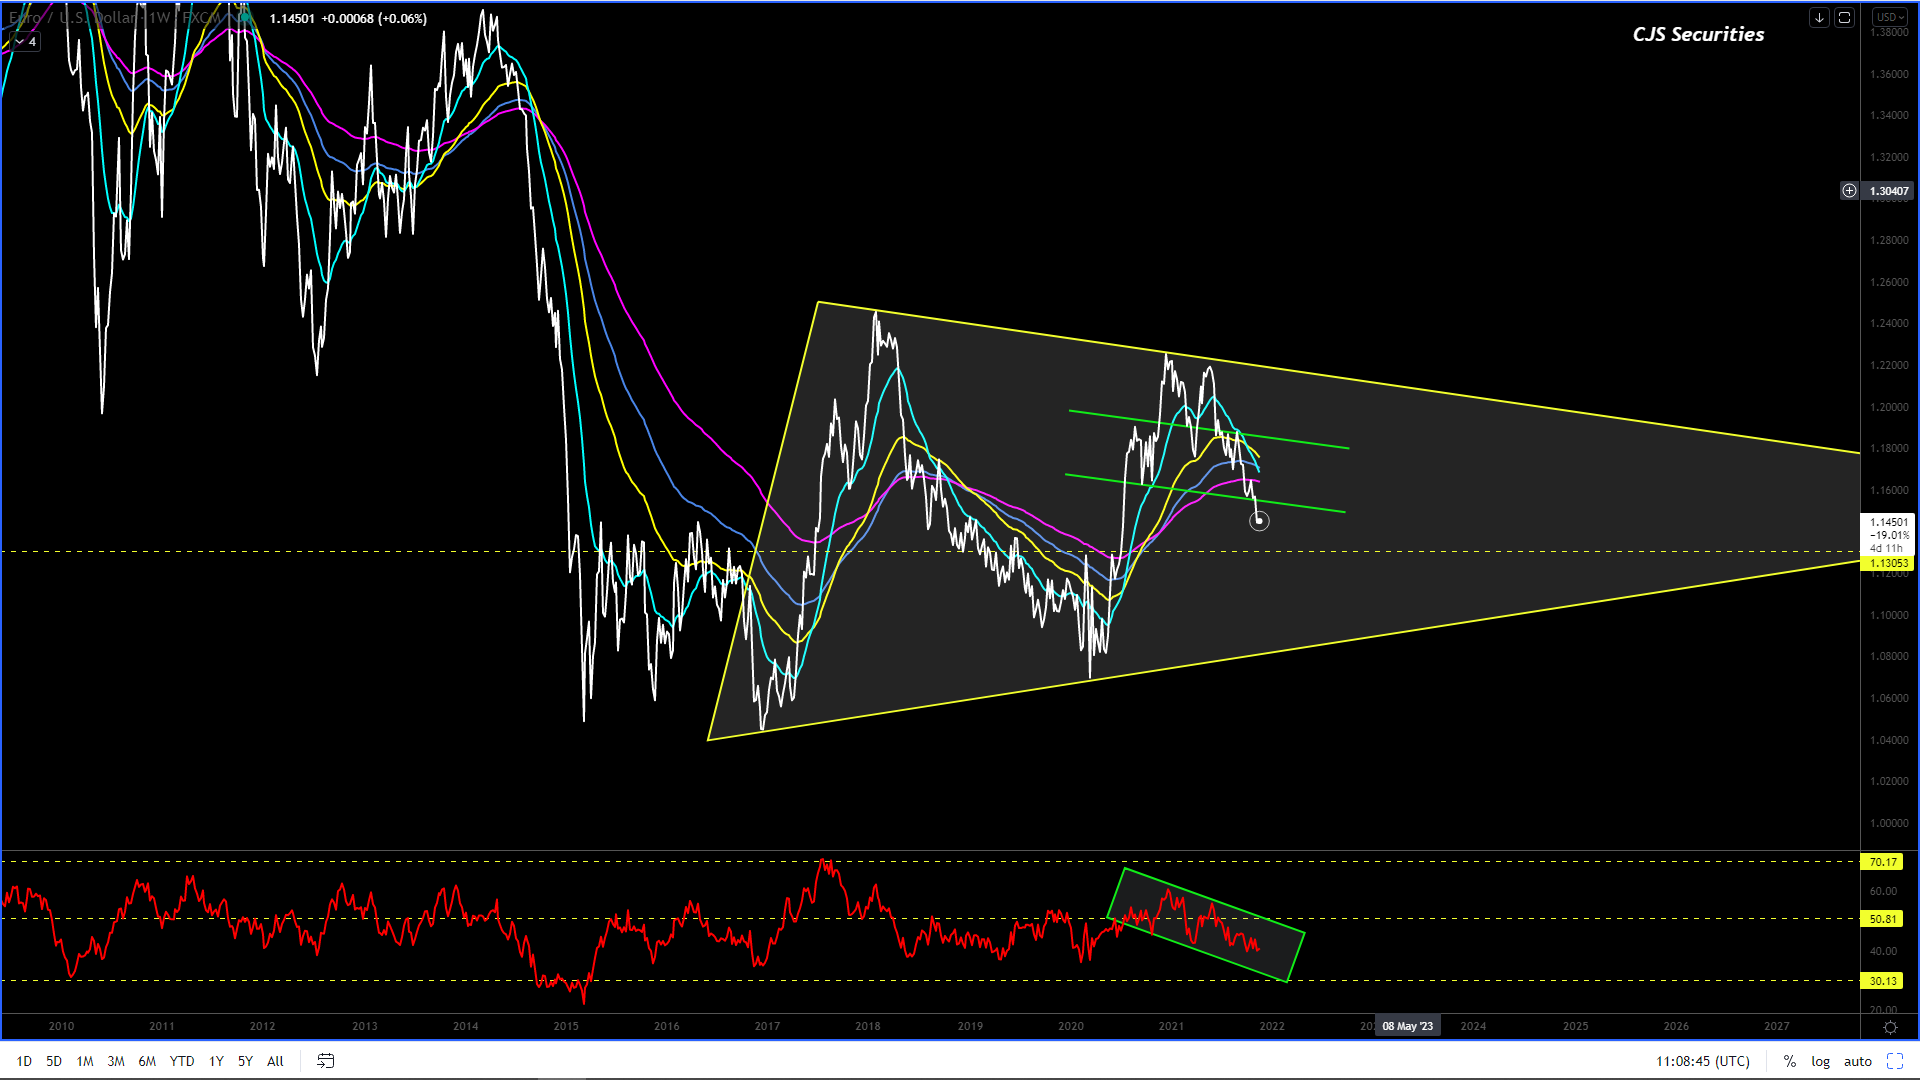
Euro/USD Weekly Close
#No Change in Commentary
I honestly have no idea what I am looking at on this chart because at a glance the chart would appear bearish but yet it lacks follow through.
IMO we should see this chart look to target the top of the range again, but in all honesty I would not put money on it.
We will need this chart to play out over a few weeks before “hopefully” gaining greater insight.
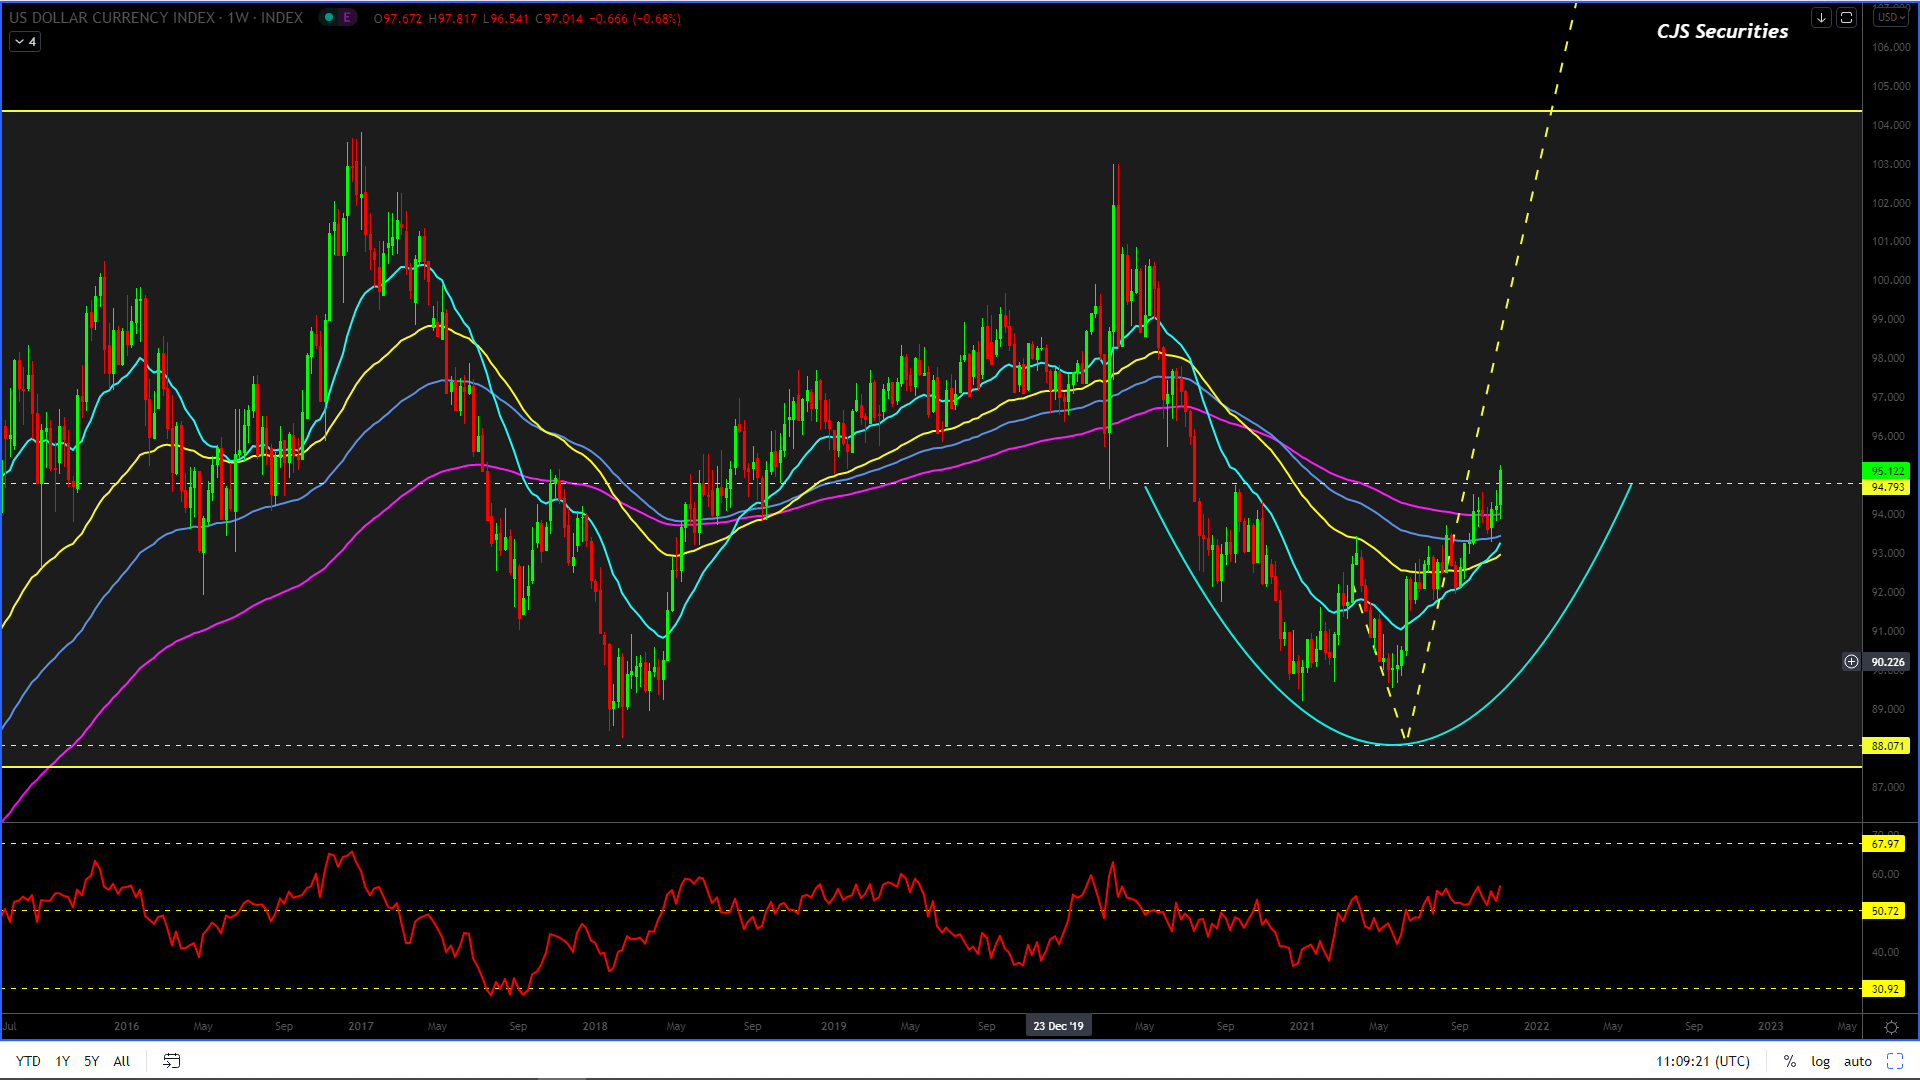
US Dollar Index Weekly Candle
Looking at how this chart is moving I can’t stress just how important the 95 level is on a weekly close!
The range REMAINS 95 -88 and a dip sub 90 is a buy of note while a rally and daily close over 95 would also get me long and until then we will sit on our hands and wait!
SA Government Bond 30 Year Yield Daily Close
I am not happy with what I am looking at and this is either a correction to trade higher or we could be staring at the start of a move that could take this chart sub 9.00%!
The current formation has more than two potential outcomes and hence we are keen to stay out until we have a better view while the downside at 10.30% should remain very solid, I hope!
US Government Bond 30 Year Yield Weekly Close
I still favour the below view but this chart is not very pretty at all.
I would look at buying a move back to 1.90% – 1.80%that will have upside targets from 2.58% – 2.71%.
Use an SL under 1.70%.
Please note that only a weekly close of over 3.50% will confirm that the trend has been broken.
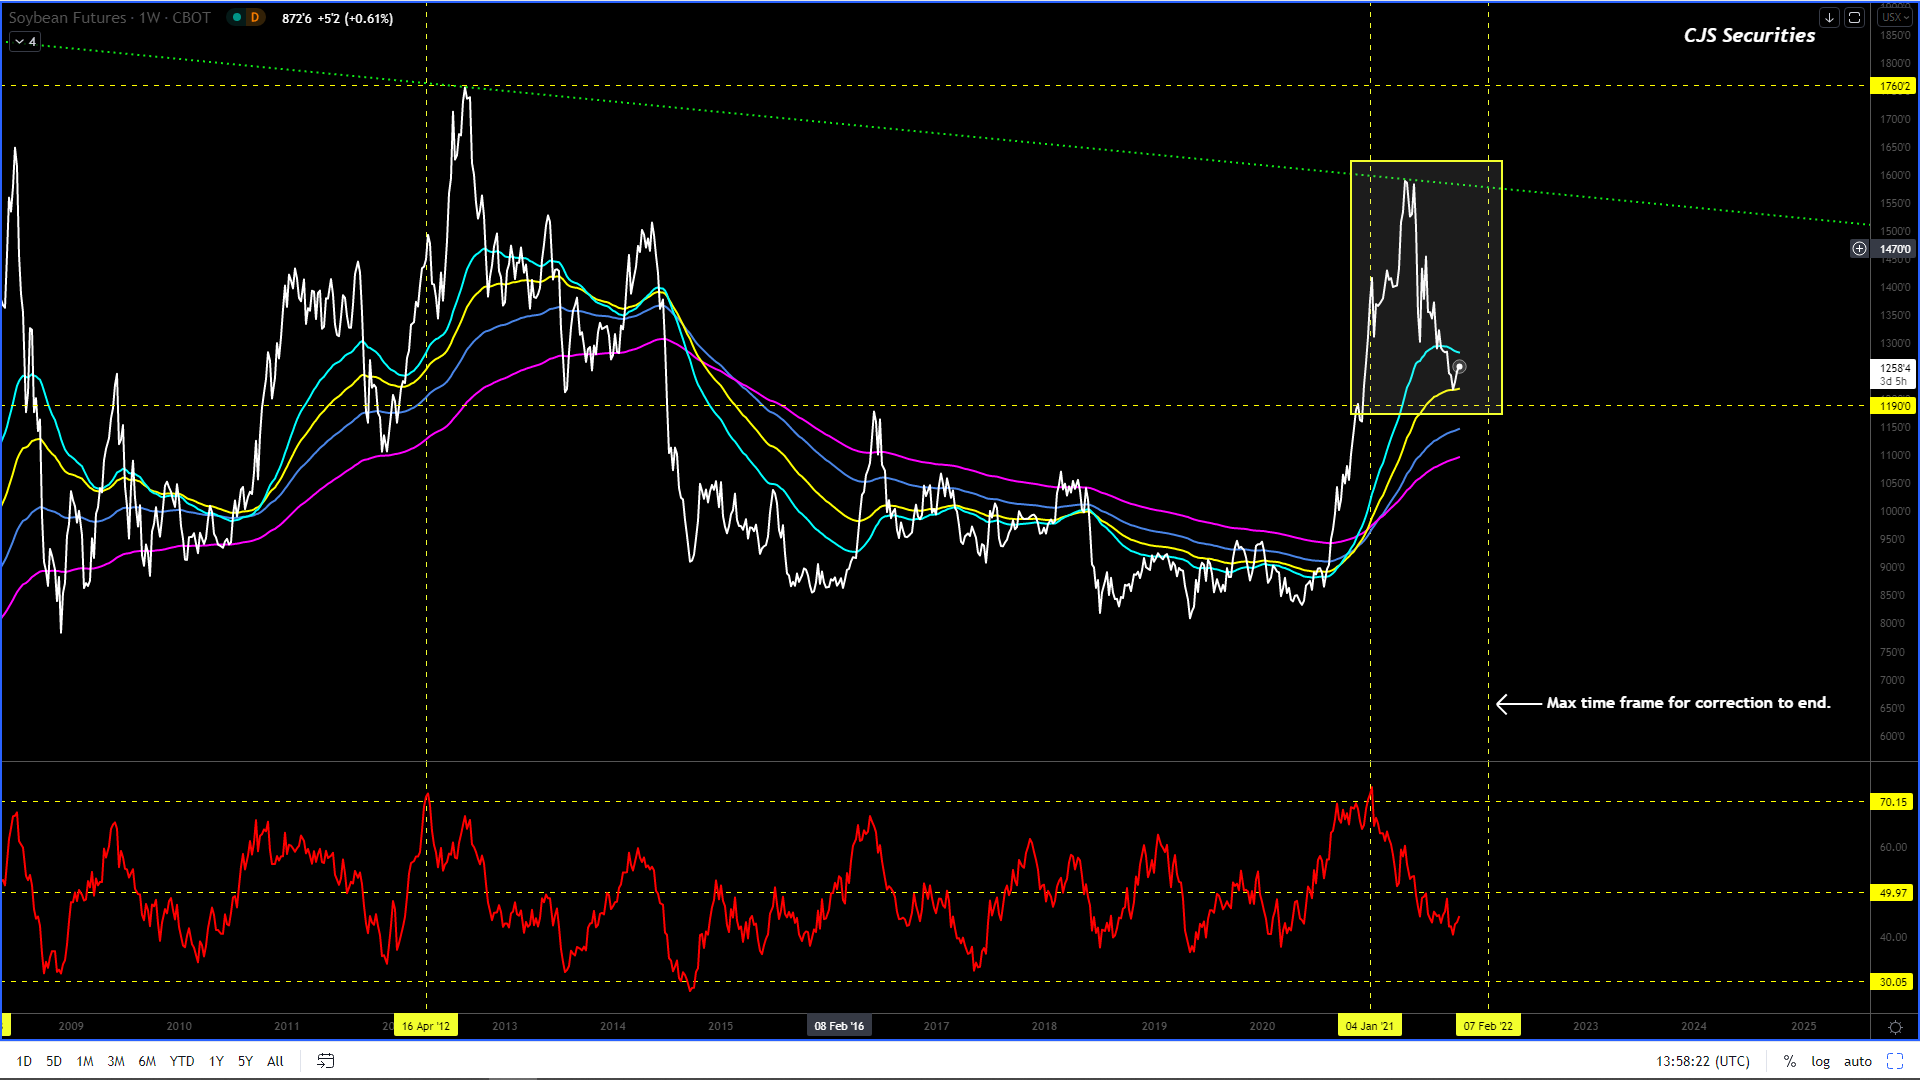
We have printed sub $12.00 and IMO the MT low is in, along with the 89 week EMA holding solidly.
In short the correction could well be over but we would need a $1.00 rally and Weekly Close over $13.02 to get me really excited.
One should use the volatility to play the ranges with a bias to building a decent long sub $12.00!– I hope many of you played ball sub $12.00as we printed $11.84.
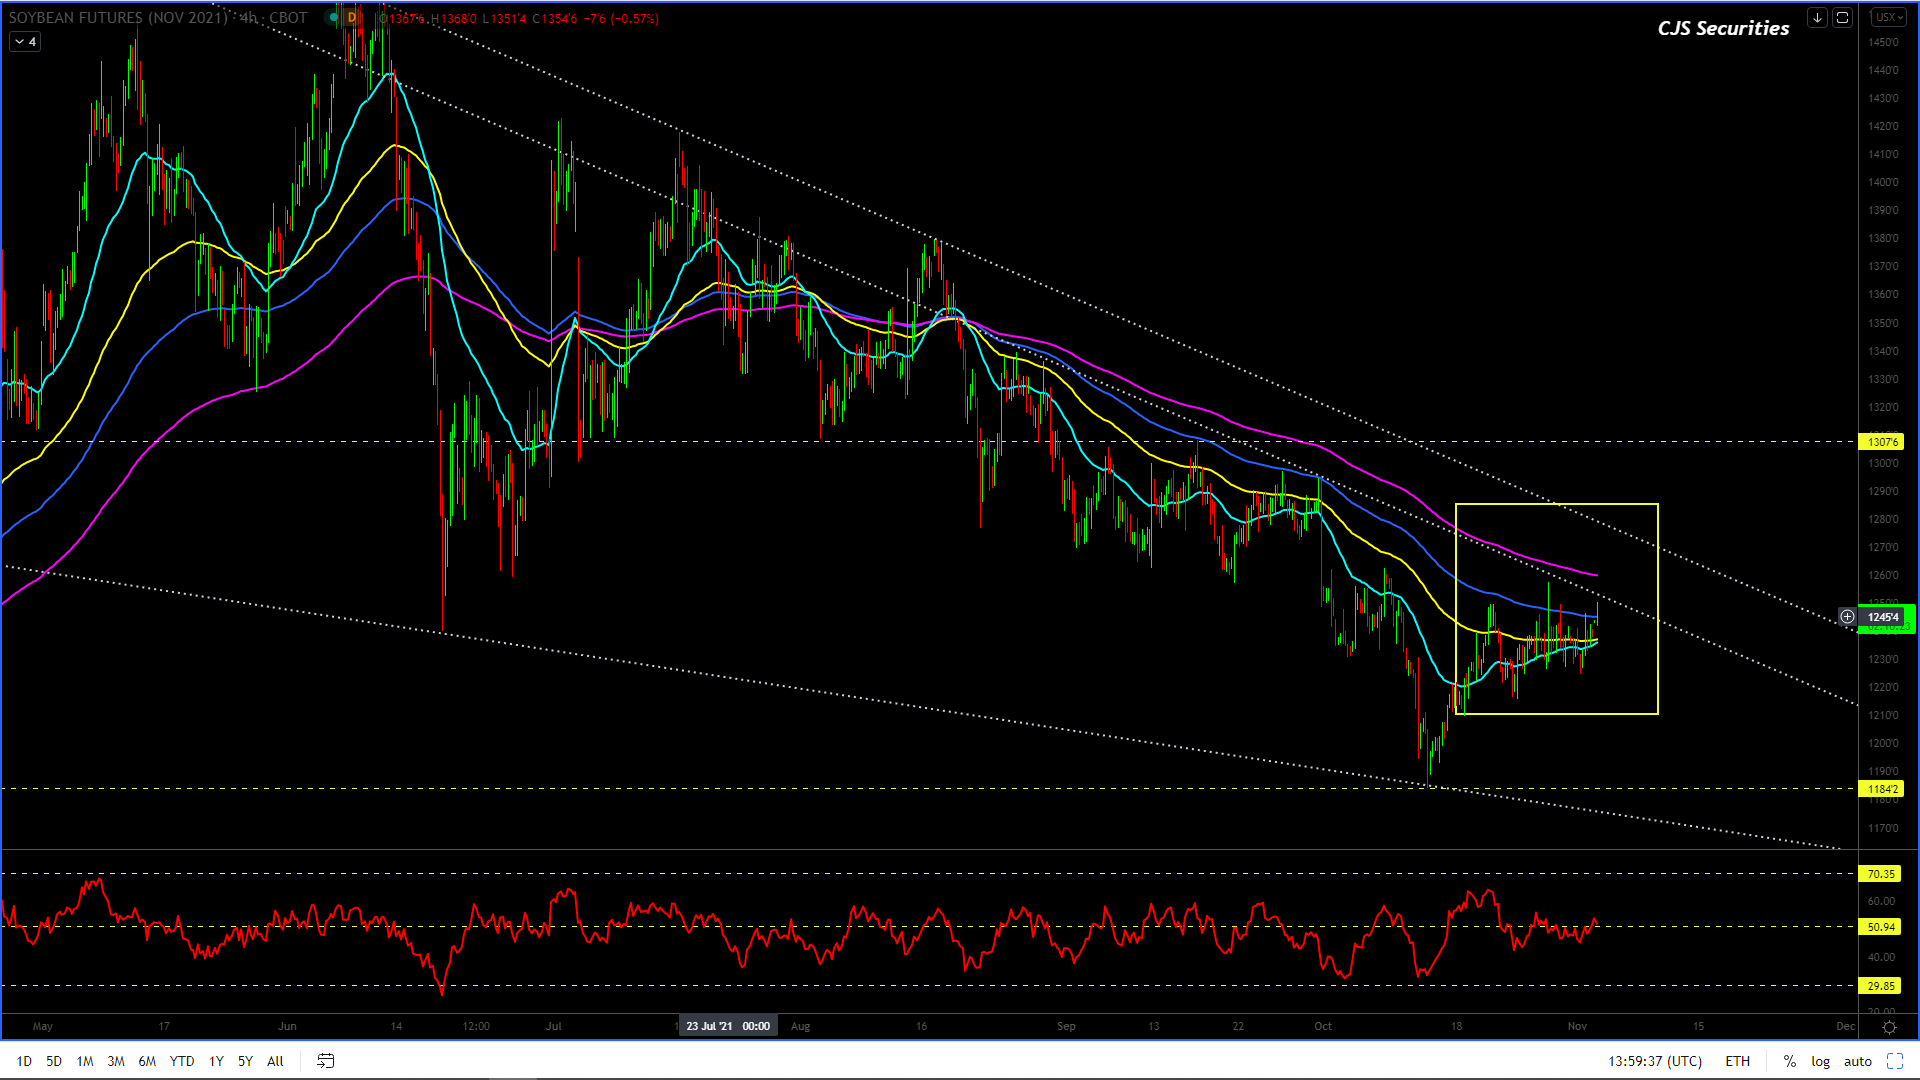
240 Min CBOT November 21 Soybean Candle Chart
I don’t like this formation and although it can trade higher this chart needs and should see another leg lower.
My view is to take cash off the table over $12.40 and keep BTFD’s.
This view is valid as untill we have a move and close over $13.08 the bull market is not yet confirmed.
Board Crush Continuous Daily Close
This chart is wild and although its now taking a breather, its going to take out the highs in the coming weeks.
We might look to get involved but the set up would have to be perfect and we are happy to sit out for now.
Oil Share Continuous Daily Close
This chart can make a new high and in all likelihood will make a new high as long as the price stays above 47% ,so for those that are long please keep your stops tight.
Weekly SAF Soy Continuous Close
#No Change in Commentary.
The chart is coming off beautifully and, with a bit of luck, could still trade as low as R6700.00.
Irrespective of the market moving, one should use weakness to price, daily!
Weekly SAF Suns Continuous Close
This chart has now printed R11000on multiple occasions and all I can say is that one should not be in this market right now.
If you are long you could be overplaying your hand.
Weekly CBOT Soy Oil Continuous Close
#No Change in Commentary. (steady as she goes)
I am super bullish and starting to wonder if the energy / power issues in China will transpire as the trigger for the below number to play out?
I feel the correction is done, (I feel good about this one) and all the pullbacks from here are buying opportunities with upside targets between $0.85 -$0.89!
I almost feel that we don’t have enough cash to get as long as we should, buy at best and scale down, this is budget making stuff with sprinkling of retirement!!!!
Weekly CBOT SBM Continuous Close
We
are long and we are hoping, which is a terrible feeling.
This
chart will kick sooner or later, but its Fugly and could still print as low as $288, but we are long and burning worse than a
California wild fire, but feel a move sub $290will be an opportunity to buy more!
This corn chart has traded beautifully and has now printed its targets.
I would look to take profit on my longs and give the chart a few days to play out as I will only consider the correction over on a weekly close over $5.95.
We are very happy to be square until we have more confidence in our view and until then I am happy to live by the saying that one is only as good as your last trade.
I REMAIN really bullish in the “big picture” but, we could easily see this market come off and look to trade back sub $5.30.
240 Min December 21 Corn Candle Chart Close
The chart has printed the high target set at $5.80 and we are super happy and would now happily sit square.
The next trade on the list is to sell at best and all the way up to $5.94with a stop over $5.96.
The downside targets will be sub $5.30 and hence this trade will have a 7/1 risk reward.
I REMAIN a proponent of BTD’s and take cash on the rallies until we confirm a bull market over $6.00!.
Weekly WM Continuous Close
The chart looks great and steady as she goes even though we are lagging parity daily.
I would continue to take risk off the table the higher we go as a R200 – R300 pullback will be hard and fast and we do not want to be caught flat footed.
The big pullbacks are still decent buying opportunities.
Weekly YM Continuous Close
The chart looks great and headed to the target area.
I would look to take some profits into strength as a pullback will be hard and fast and we would like the ability to buy back.
In short steady as she goes and don’t rock the boat!
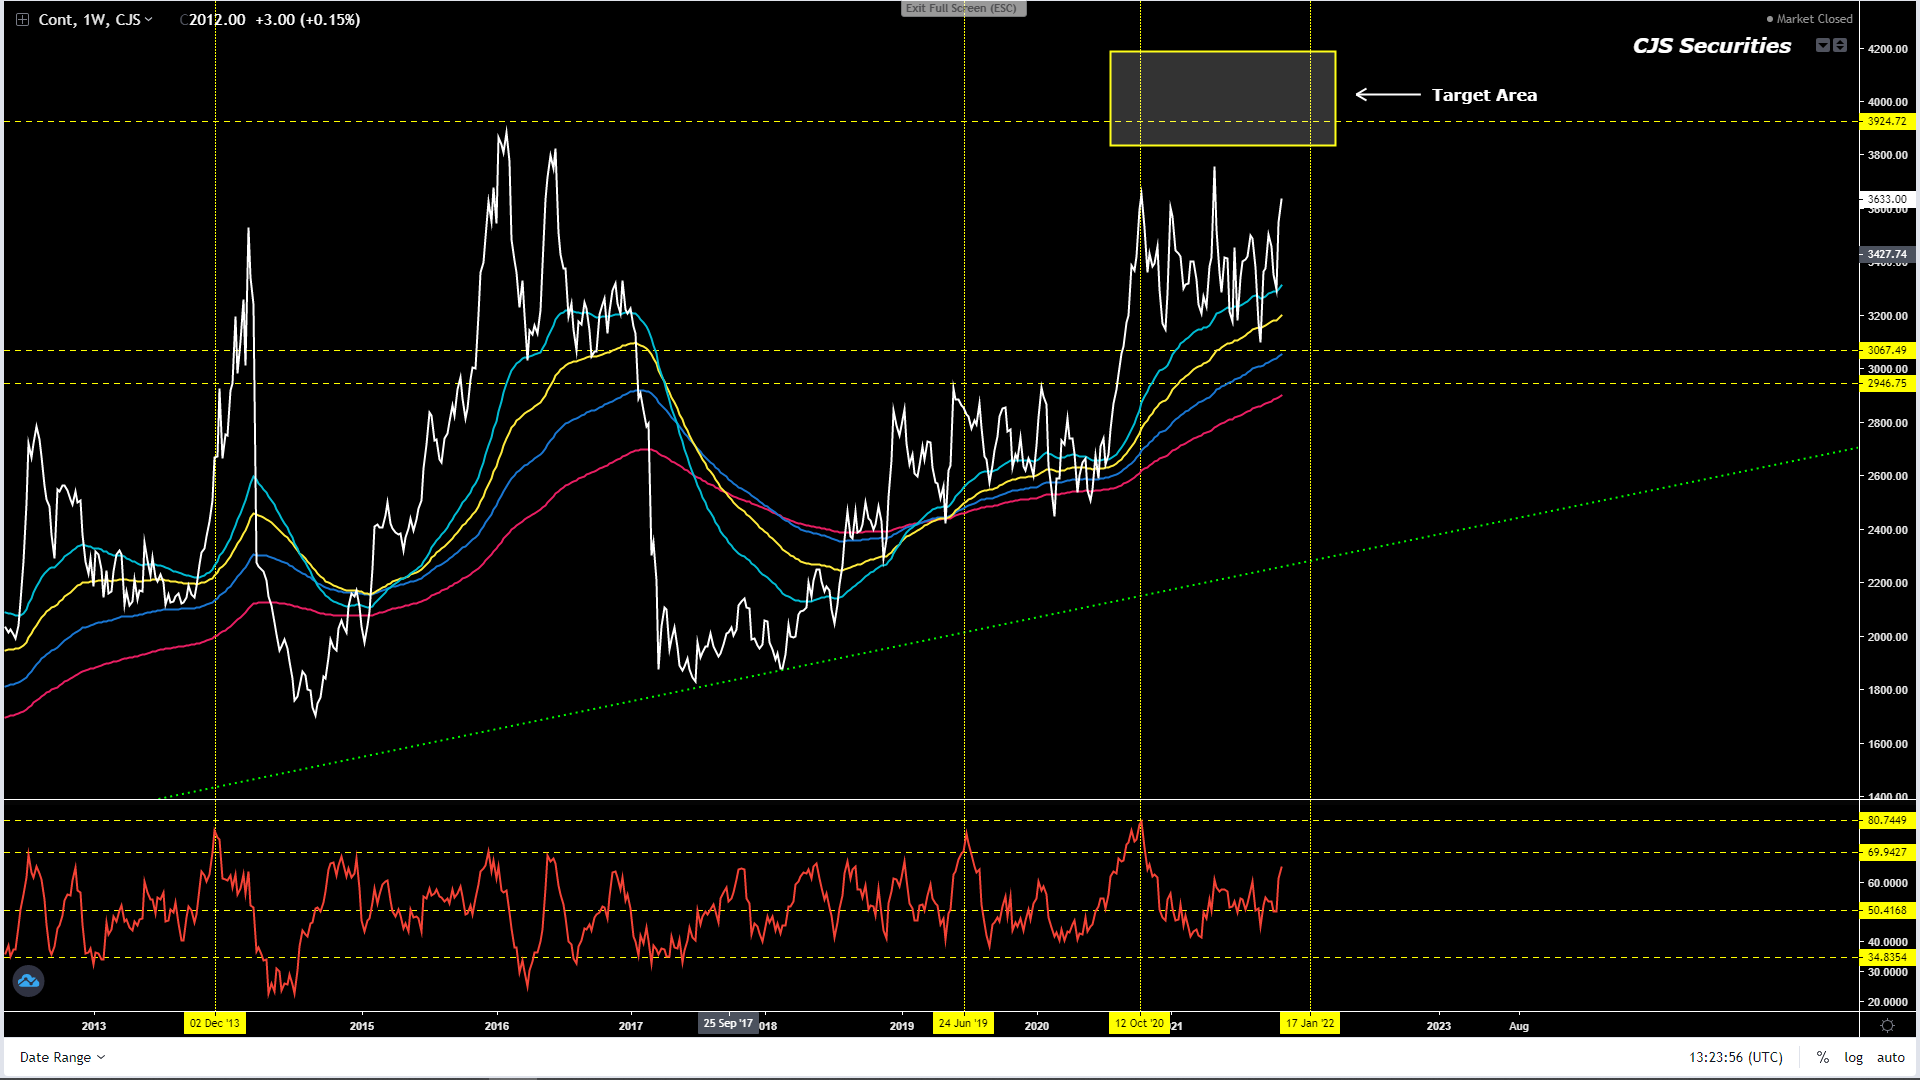
Weekly KC Wheat Continuous Close
Firstly, for all those that held and followed the road map, congratulations!
I hope you are all planning your Maldives holidays.
Now that we have given ourselves the biggest pat on the back, targets have almost been reached and we would take the cash and go square!
We have happy little piggy banks.
Weekly Chicago SRW Wheat Continuous
As with KC, great effort to hold and follow the road map!
Now is the time to take the money, sit back and enjoy our handy work as it does not often play out as well as this!
Daily Close KC Wheat v Chicago SRW Continuous Close
For those that held a little longer (we did not) and sold over $0.20 congratulations!
The market traded just short of its targets at $0.28 and the top seems to be in for now!
Weekly SAF Wheat Continuous Close
The kick to R6000on the Dec contract is here and the chart could look to trade a little higher.
For those that bought the dip well done, but I would definitely look to take profits here and if I were a producer I would look to hedge my crop over R6000.
Daily Matif Wheat Continuous Close
We made a mammoth profit
on this long position and would like to congratulate you all.
This chart is now heading
into overbought territory and we are happy to sit out for a few weeks.
Apologies for being away last week, but I am back and with not much to add as these charts have been playing out perfectly.
The pullback to R14.37 was a little deeper than expected but was very short lived.
The inverted H&S formation has targets from R15.50 – R15.86 and it is with these targets in mind that I would look to take profit over R15.50 in what has been a great run.
The chart still has a potentially “bigger picture” formation that needs to play out and we are now very happy to sit back and allow the price to play out over the next 6 – 10 trading days before making our next call.
Dollar/Rand Daily Candle
As mentioned in the Weekly commentary the chart traded around R0.13 lower than expected but was always within the correction range.
We are very close to the targets (R15.70 – R15.86) set out in our now long running scenario #2 and we would look to take the cash and go square.
I feel the need to square up based on the fact that I do not trust this chart as there is a possibility that we could be experiencing an irregular flat formation and if so this would lead to a pullback to the low R14’s once the MT top has been printed.
In closing there are too many variables and hence taking the money right now just feels so right!
Dollar/Rand 240 min Candle
We were long and stopped and as the saying goes “so are the days of our lives”.
I know that micro manging positions is very difficult, but this will not stop us from trying and so we have a new trade to look at on a ST basis.
Sell R15.62 – R15.86 with a stop over R15.88.
Targets will be at R14.23 and this trade will have a 1089 / 100 risk reward!
Euro/USD Weekly Close
I honestly have no idea what I am looking at on this chart because at a glance the chart would appear bearish but yet it lacks follow through.
IMO we should see this chart look to target the top of the range again, but in all honesty I would not put money on it.
We will need this chart to play out over a few weeks before “hopefully” gaining greater insight.
US Dollar Index Weekly Candle
#No Change in Commentary
The range REMAINS 95 -88 and a dip sub 90 is a buy of note while a rally and daily close over 95 would also get me long and until then we will sit on our hands and wait!
SA Government Bond 30 Year Yield Daily Close
The chart has a nice
rounding bottom and we could potentially look at targeting the 11.40%level.
The current formation
has more than two potential outcomes and hence we are keen to stay out until we
have a better view while the downside at 10.30%should remain very solid.
US Government Bond 30 Year Yield Weekly Close
#No Change in Commentary
I would look at buying a move back to 1.90% – 1.80%that will have upside targets from 2.58% – 2.71%.
Use an SL under 1.70%.
Please note that only a weekly close of over 3.50% will confirm that the trend has been broken.
Although I think this chart should come lower, we have now printed sub $12.00 and IMO the MT low is in, along with the 89 week EMA holding solidly.
In short the correction could well be over but we would need a $1.00 rally and Weekly Close over $13.02 to get me really excited.
One should use the volatility to play the ranges with a bias to building a decent long sub $12.00!– I hope many of you played ball sub $12.00.
My new downside target is sub $12.00 and potentially $11.70, this would be a massive MT buying opportunity to say the least. – we printed $11.84.
240 Min CBOT November 21 Soybean Candle Chart
Now that the downside has played out, I trust you are long and only look to cut should we make a new low, but based on the charts current formation we are going north!
I would look to take some cash off the table over $12.40 and keep BTFD’s until a new low is made, because until we have a move and close over $13.08 the bull market is not yet confirmed.
On a technical basis these are the set ups we crave and if we are correct we should be able to extract some serious value out of this chart.
Board Crush Continuous Daily Close
#NO Change in Commentary
This
chart can take you to the cleaners and return your dirty!
I
would stay out until further notice.
The
price action now feels binary!
Oil Share Continuous Daily Close
For all of those that cashed out last week, congratulations.
For those looking to be piggish, I feel the chart can make a new high, but PLEASE remember the following when it comes to the market and that is “most pigs get slaughtered.”
Weekly SAF Soy Continuous Close
#No Change in Commentary. (althoughnothingnew to report, we know that no news or “steady as she goes”)
The chart is coming off beautifully and, with a bit of luck, could still trade as low as R6700.00.
Irrespective of the market moving, one should use weakness to price, daily!
Weekly SAF Suns Continuous Close
If anyone is still short Dec 21 SFS, I have no sympathy for you.
This market is now binary and could trade as high as R11 000 – R12000.
If you are long, enjoy it but you should be taking profits daily.
Weekly CBOT Soy Oil Continuous Close
#No Change in Commentary. (althoughnothingnew to report, we know that no news is really good news for the BULLS or “steady as she goes”)
I am super bullish and starting to wonder if the energy / power issues in China will transpire as the trigger for the below number to play out?
I feel the correction is done, (I feel good about this one) and all the pullbacks from here are buying opportunities with upside targets between $0.85 -$0.89!
I almost feel that we don’t have enough cash to get as long as we should, buy at best and scale down, this is budget making stuff with sprinkling of retirement!!!!
Weekly CBOT SBM Continuous Close
I have snapped out of my Stockholm syndrome.
This chart will kick sooner or later, but its Fugly and could still print as low as $288, but we are long and burning worse than a California wild fire, but feel a move sub $290 will be an opportunity to buy more!
Although there was some intra week price action, the week’ on week’ movement remained low, and it is with this in mind that I cannot change any of the below.
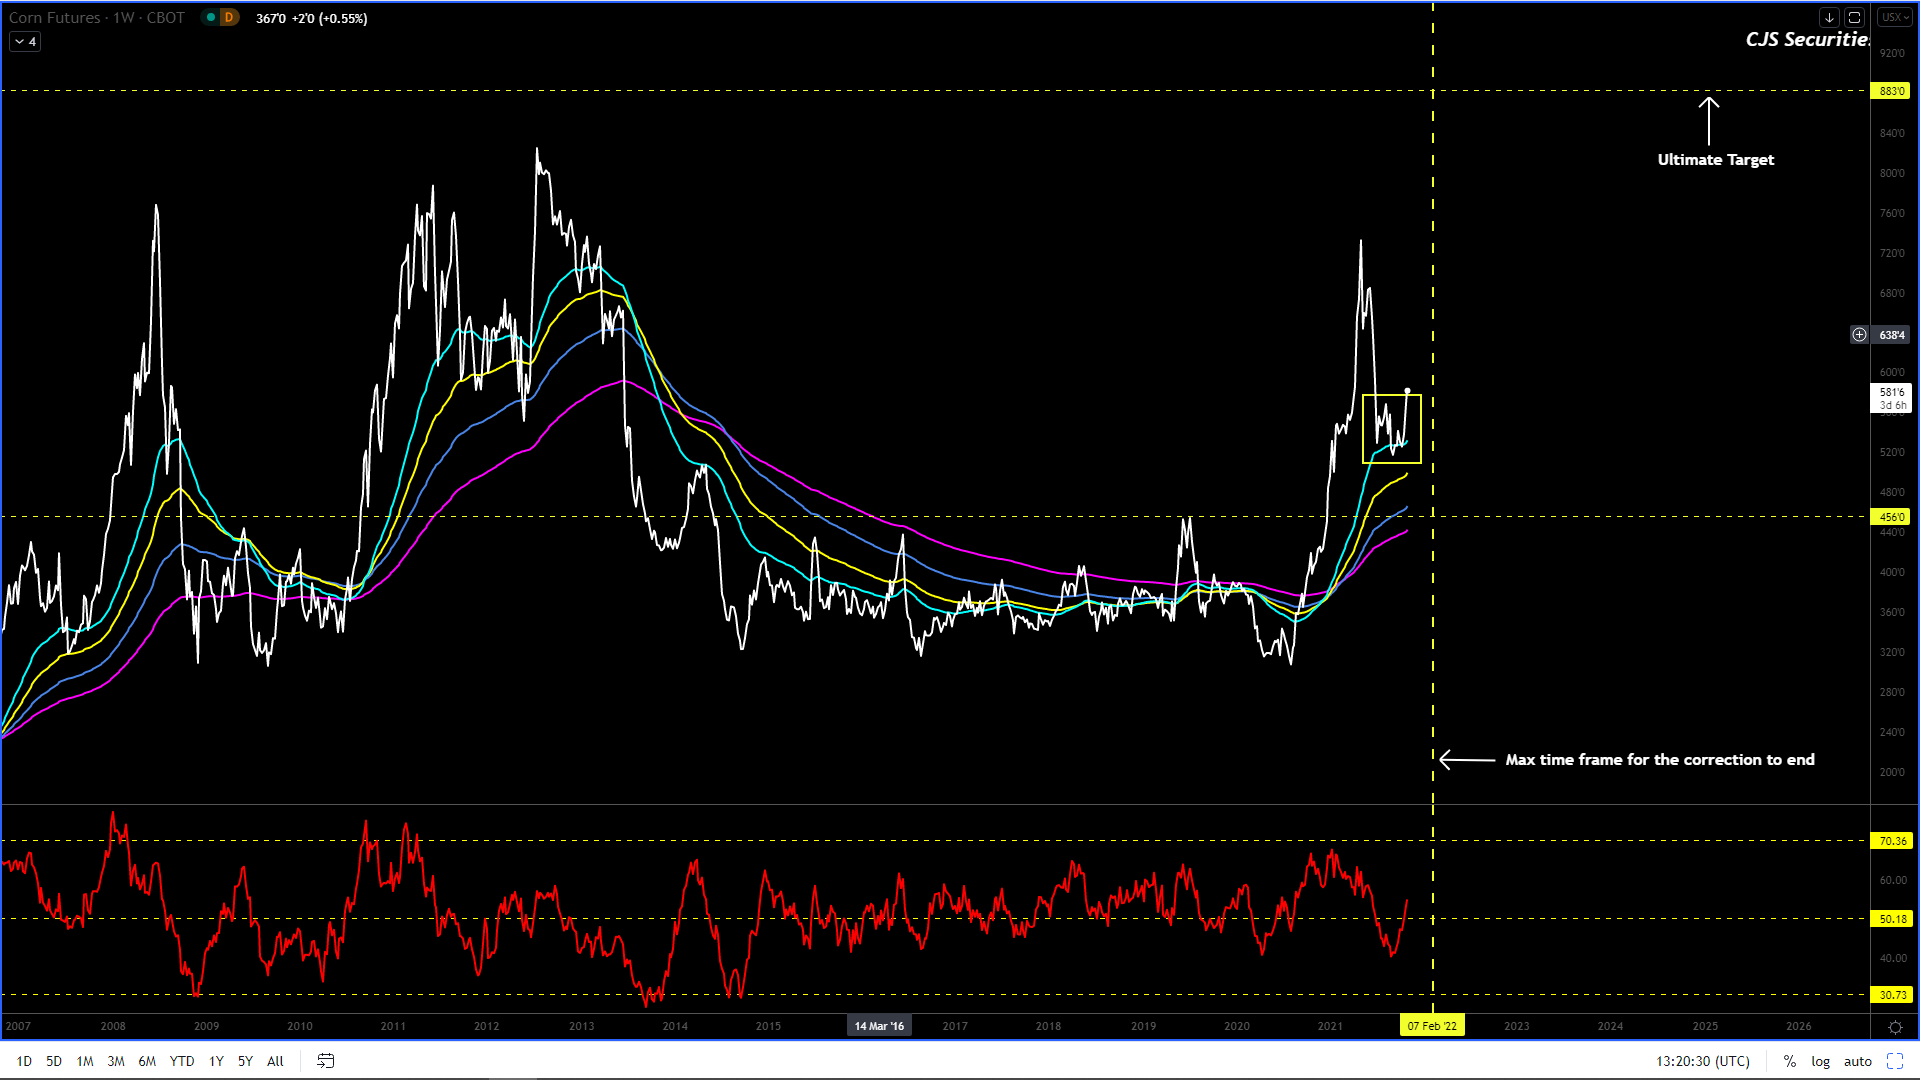
The upside targets are between $5.70 – $5.80 on the Z21 contract.
Please note that I do not feel the correction is over until we have a weekly close over $6.42, while I would only consider the Bull story to be over should we have a Weekly close under $4.56.
Until then trade the ranges, use the market volatility to build your confidence and don’t get married to a view.
I REMAIN really bullish in the “big picture” but, we could easily see this market come off after trying to print $5.70, so in short you may well have the chance to get long sub $5.00!
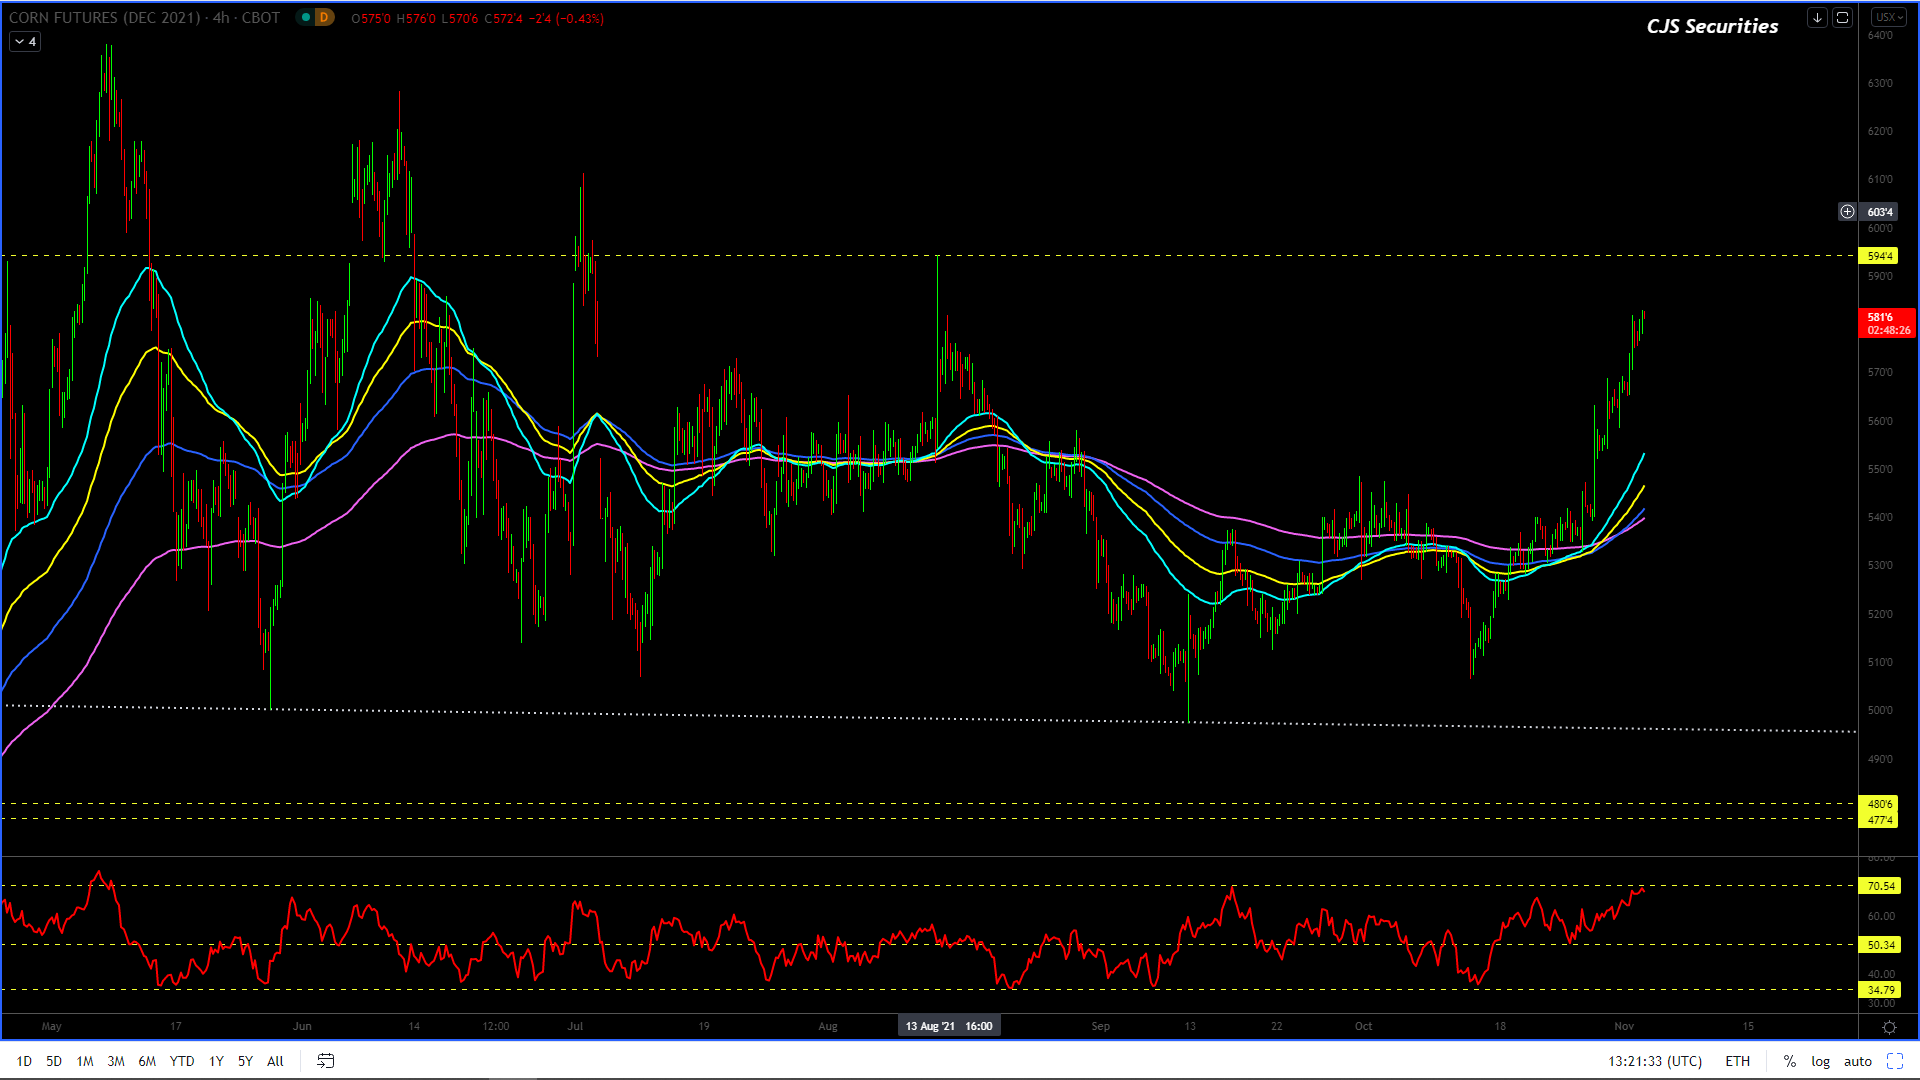
240 Min December 21 Corn Candle Chart Close
I STILL like this chart to still trade higher and print $5.60 – $5.80, but based on the current formation I would be highly surprised to see it hold those levels, in fact should we push up toward these levels I would consider selling with a stop over $5.95 as the downside target would be sub $5.00.
In the BIGGER picture the dips remain buying opportunities potentially as low as $4.70.
I REMAIN a proponent of BTD’s and take cash on the rallies until we confirm a bull market over $6.00!.
Weekly WM Continuous Close
#No Change in Commentary. (althoughnothingnew to report, we know that no news is really good news for the BULLS or “steady as she goes”)
The chart looks great and the dips are still buying opportunities.
I would however take some risk off the table, as the higher we go, the pullback will be hard and fast and we do not want to be caught flat footed.
Even after the current rally off the low, the upside move has not confirmed yet but currently I feel like MT low is in!
Weekly YM Continuous Close
#No Change in Commentary. (althoughnothingnew to report, we know that no news is really good news for the BULLS or “steady as she goes”)
The chart looks great and the dips remain buying opportunities.
Congratulations to all who BTD, even though the chart went a little lower than my technical comfort level.
All the pullbacks remains buying opportunities.
Once the correction is over, the correction is not over yet but its close, the chart will be looking to break out to the upside by R500 or more and make new MT highs.
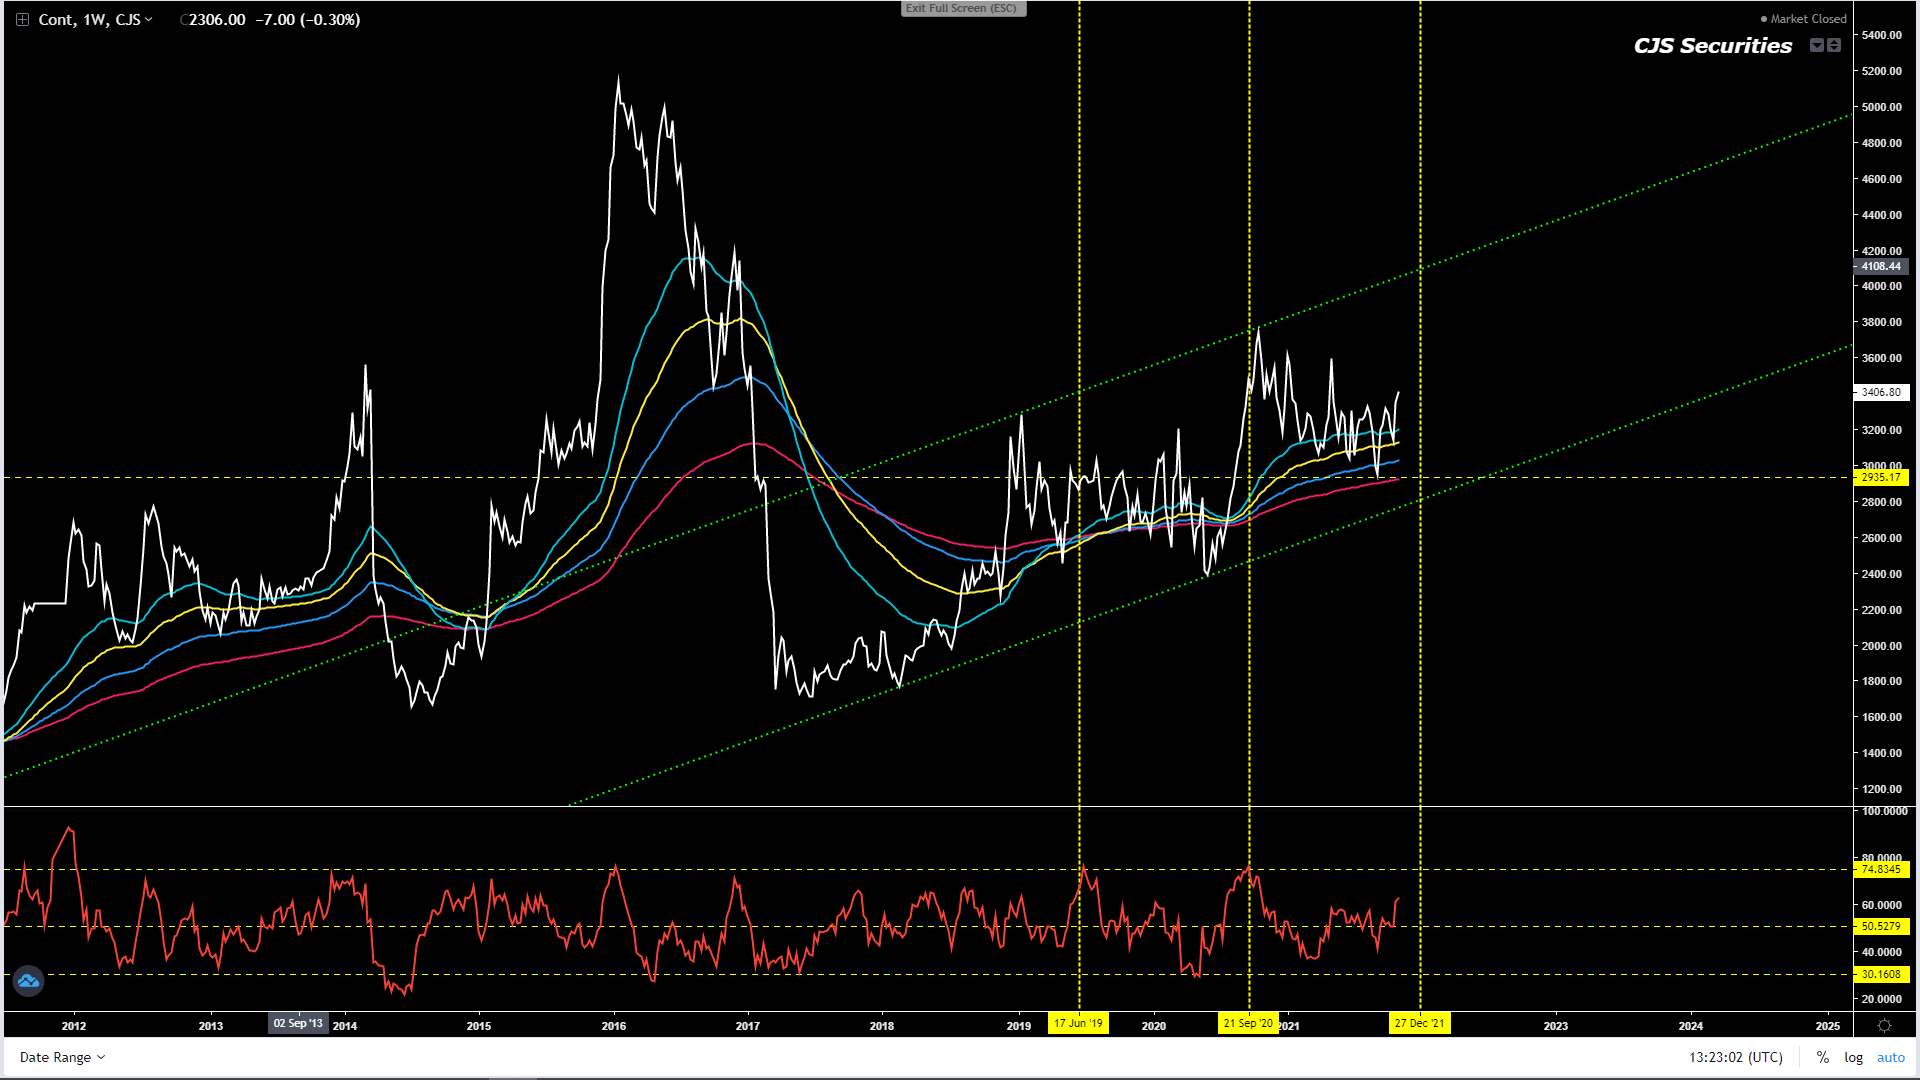
Weekly KC Wheat Continuous Close
#No Change in Commentary. (althoughnothingnew to report, we know that no news is really good news for the BULLS or “steady as she goes”)
There is ZERO reason to sell this chart or take profit, as the digital asset boys say, “HOLD”!
The chart looks great and it’s a buy!
The pullback is over and we are long and waiting to make some green (hope we don’t go home broke).
Weekly Chicago SRW Wheat Continuous
#No Change in Commentary. (althoughnothingnew to report, we know that no news is really good news for the BULLS or “steady as she goes”)
There is ZERO reason to sell this chart or take profit, as the digital asset boys say, “HOLD”!
The pullback is over, the chart looks great!
We are long and waiting to make some green (hope we don’t go home broke).
Daily Close KC Wheat v Chicago SRW Continuous Close
I truly hope some of you went long last week as the “consolidation” looked a sitter and we are still headed north!
Targets could be as high as $0.28!
Weekly SAF Wheat Continuous Close
#No Change in Commentary. (althoughnothingnew to report, we know that no news is really good news for the BULLS or “steady as she goes”)
Although this chart is distorted post the Sep 21 futures close out, I can still easily see the price rally R400 off its currently level, with targets at R6000.
I would look to buy the chart into weakness, down to R5350.
Daily Matif Wheat Continuous Close
#No Change
in Commentary. (althoughnothingnew to report, we know
that no news is really good news for the BULLS or “steady as she goes”)
The below view is playing
out wonderfully and we would raise our stop profit to €260.00
This chart looks decent
and we are looking to buy scale down to €235.00 as
I feel the correction is over with targets over €295.00.
If this chart has a daily
close at or just under€257.00 we will
most certainly go square as a failure at those level could see a€50.00 drop in prices.